
.svg)


Download the full report as a PDF now.
The total number of homes available for sale reached never before seen lows around New Zealand, while the national average asking price sat over $700,000 for the first time since records began 13 years ago. We saw a record low for new listings nationwide.
Closing the decade with 18 record-breaking statistics, the New Zealand property market remained a seller’s game in December 2019. For the first time, data from realestate.co.nz showed all-time high national average asking prices, combined with record lows in new listings and total homes available for sale.
Vanessa Taylor, spokesperson for realestate.co.nz says “this is the first time since our records began in 2007 that we have seen three national records in the same month. There have been years where we have seen a combination of two, but never all three.”
“Low stock, teamed with high asking prices sees us close out the decade as a strong sellers’ market,” says Vanessa.
Last month’s trends have also been largely driven by regional New Zealand.
“Generally, we look to our main centres to lead what is happening in the market, but last month we saw our regions really driving national trends,” she says.
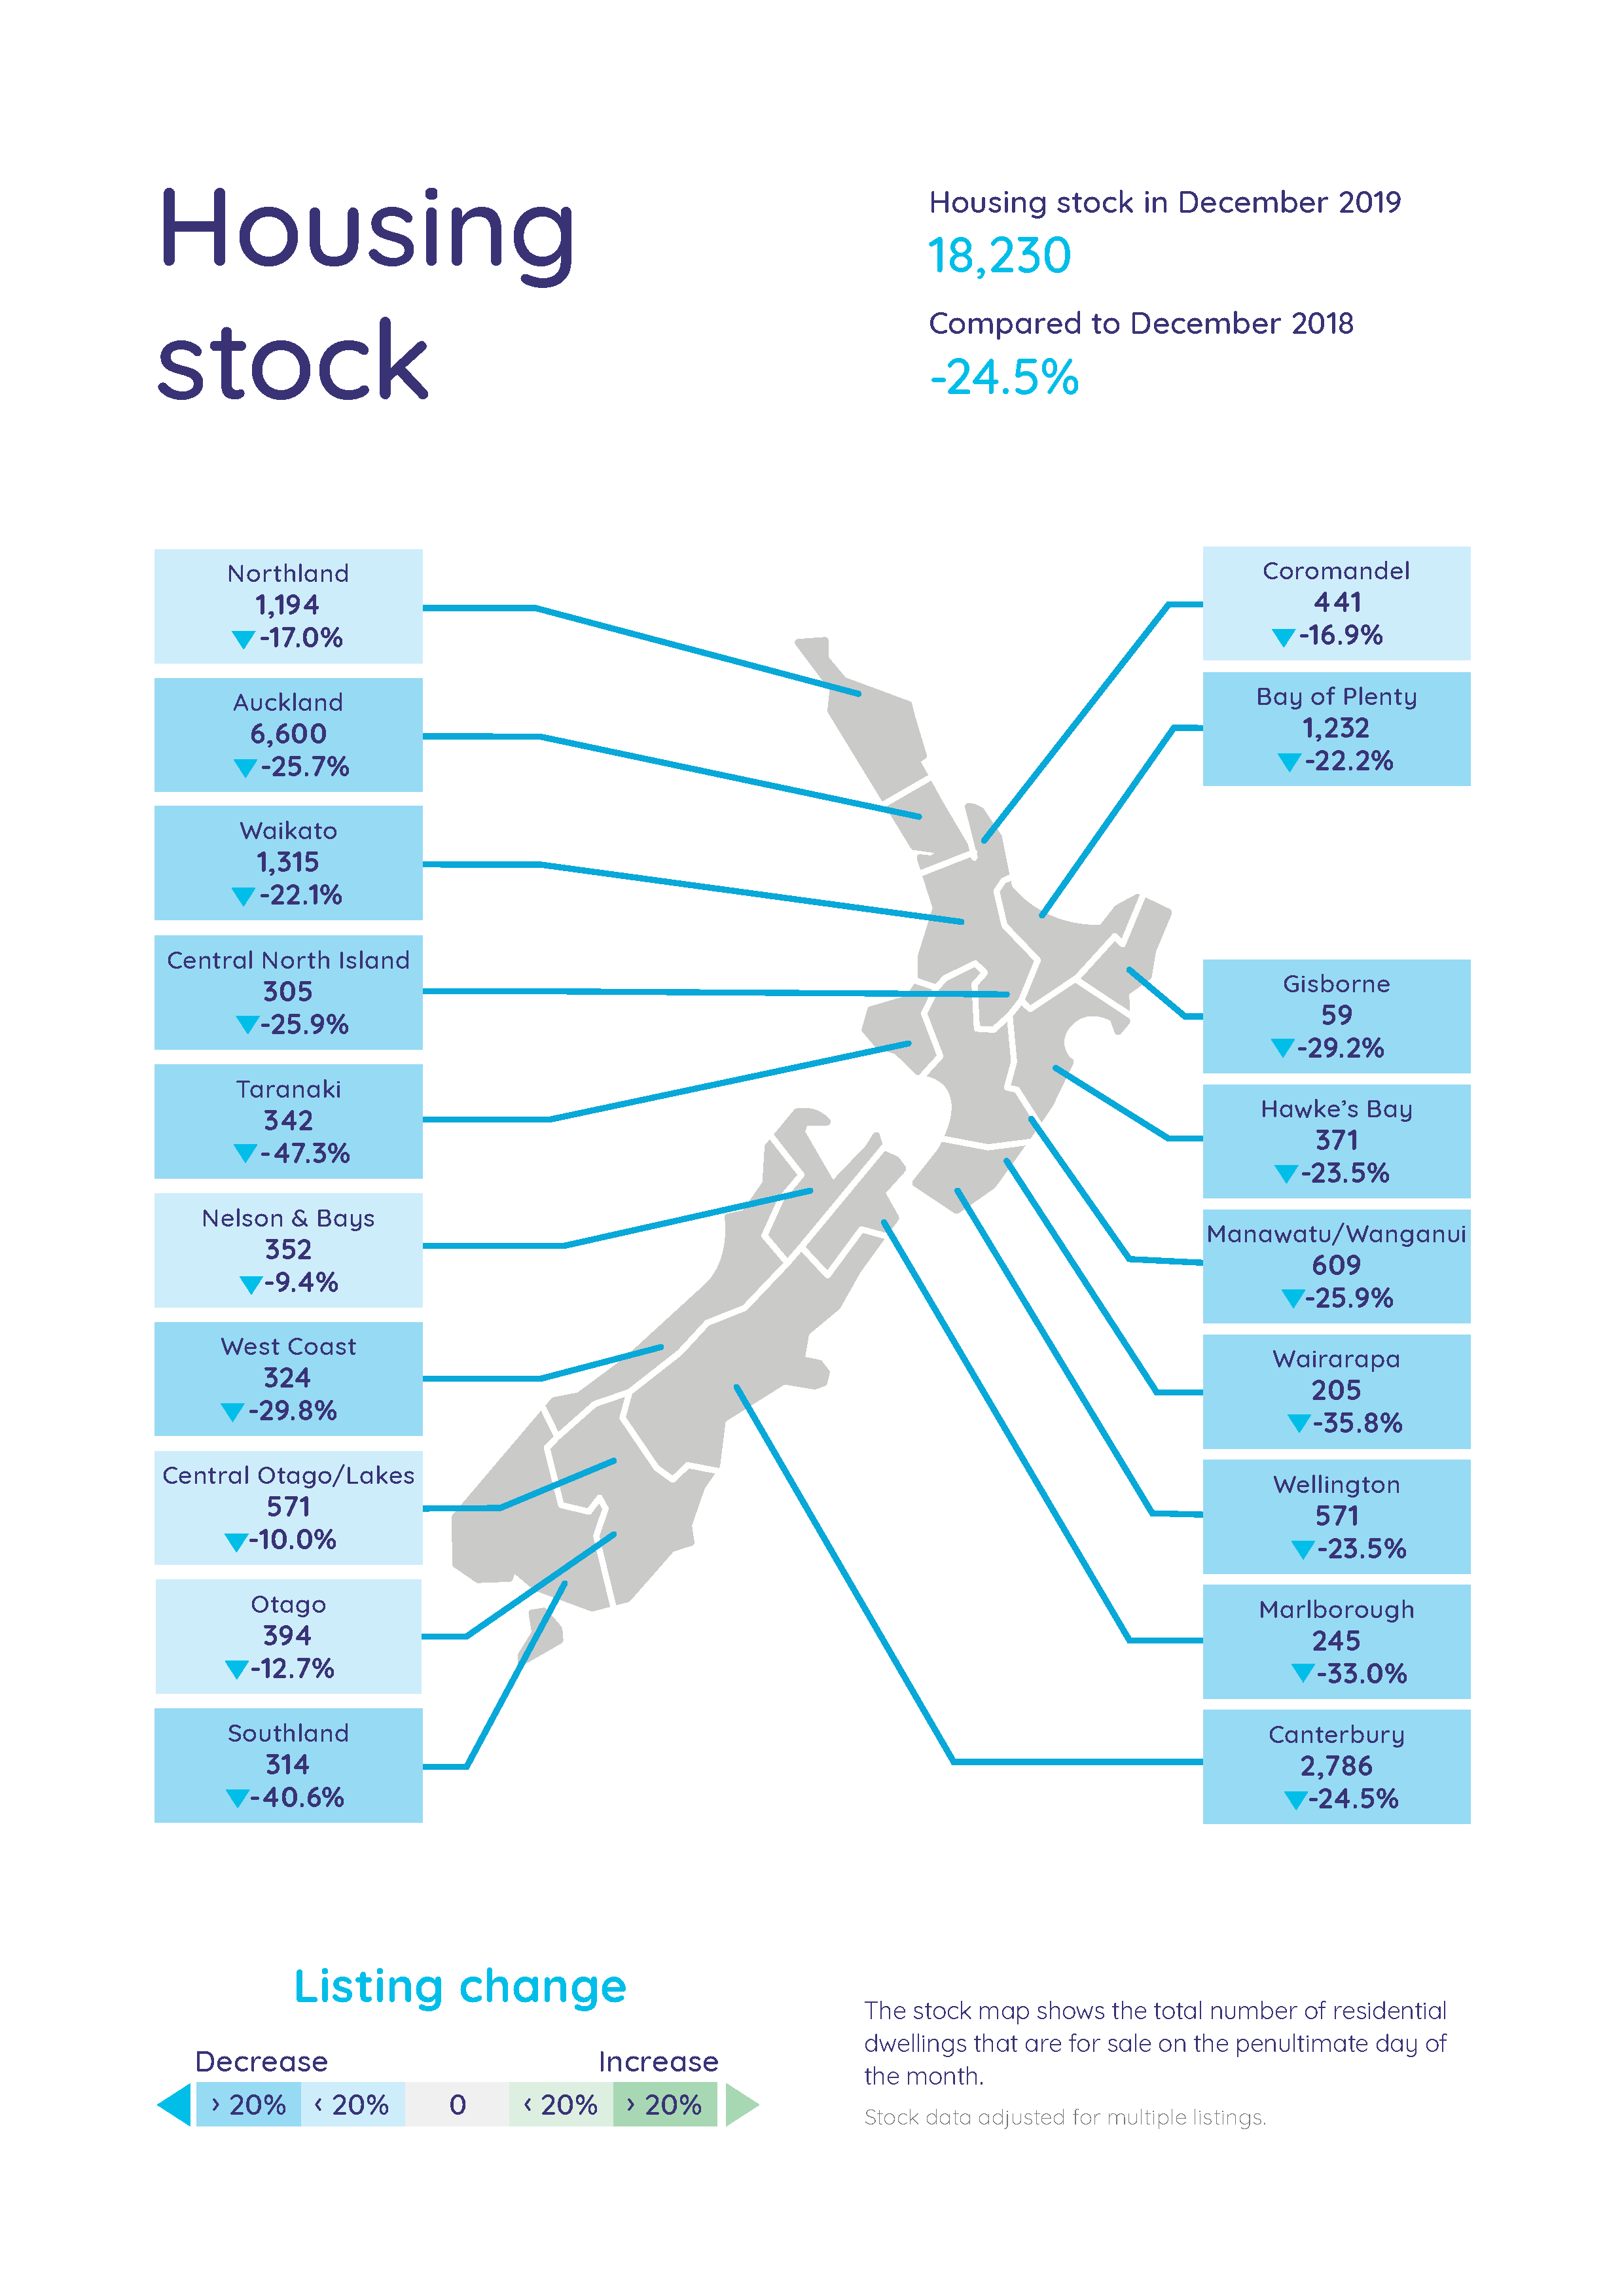
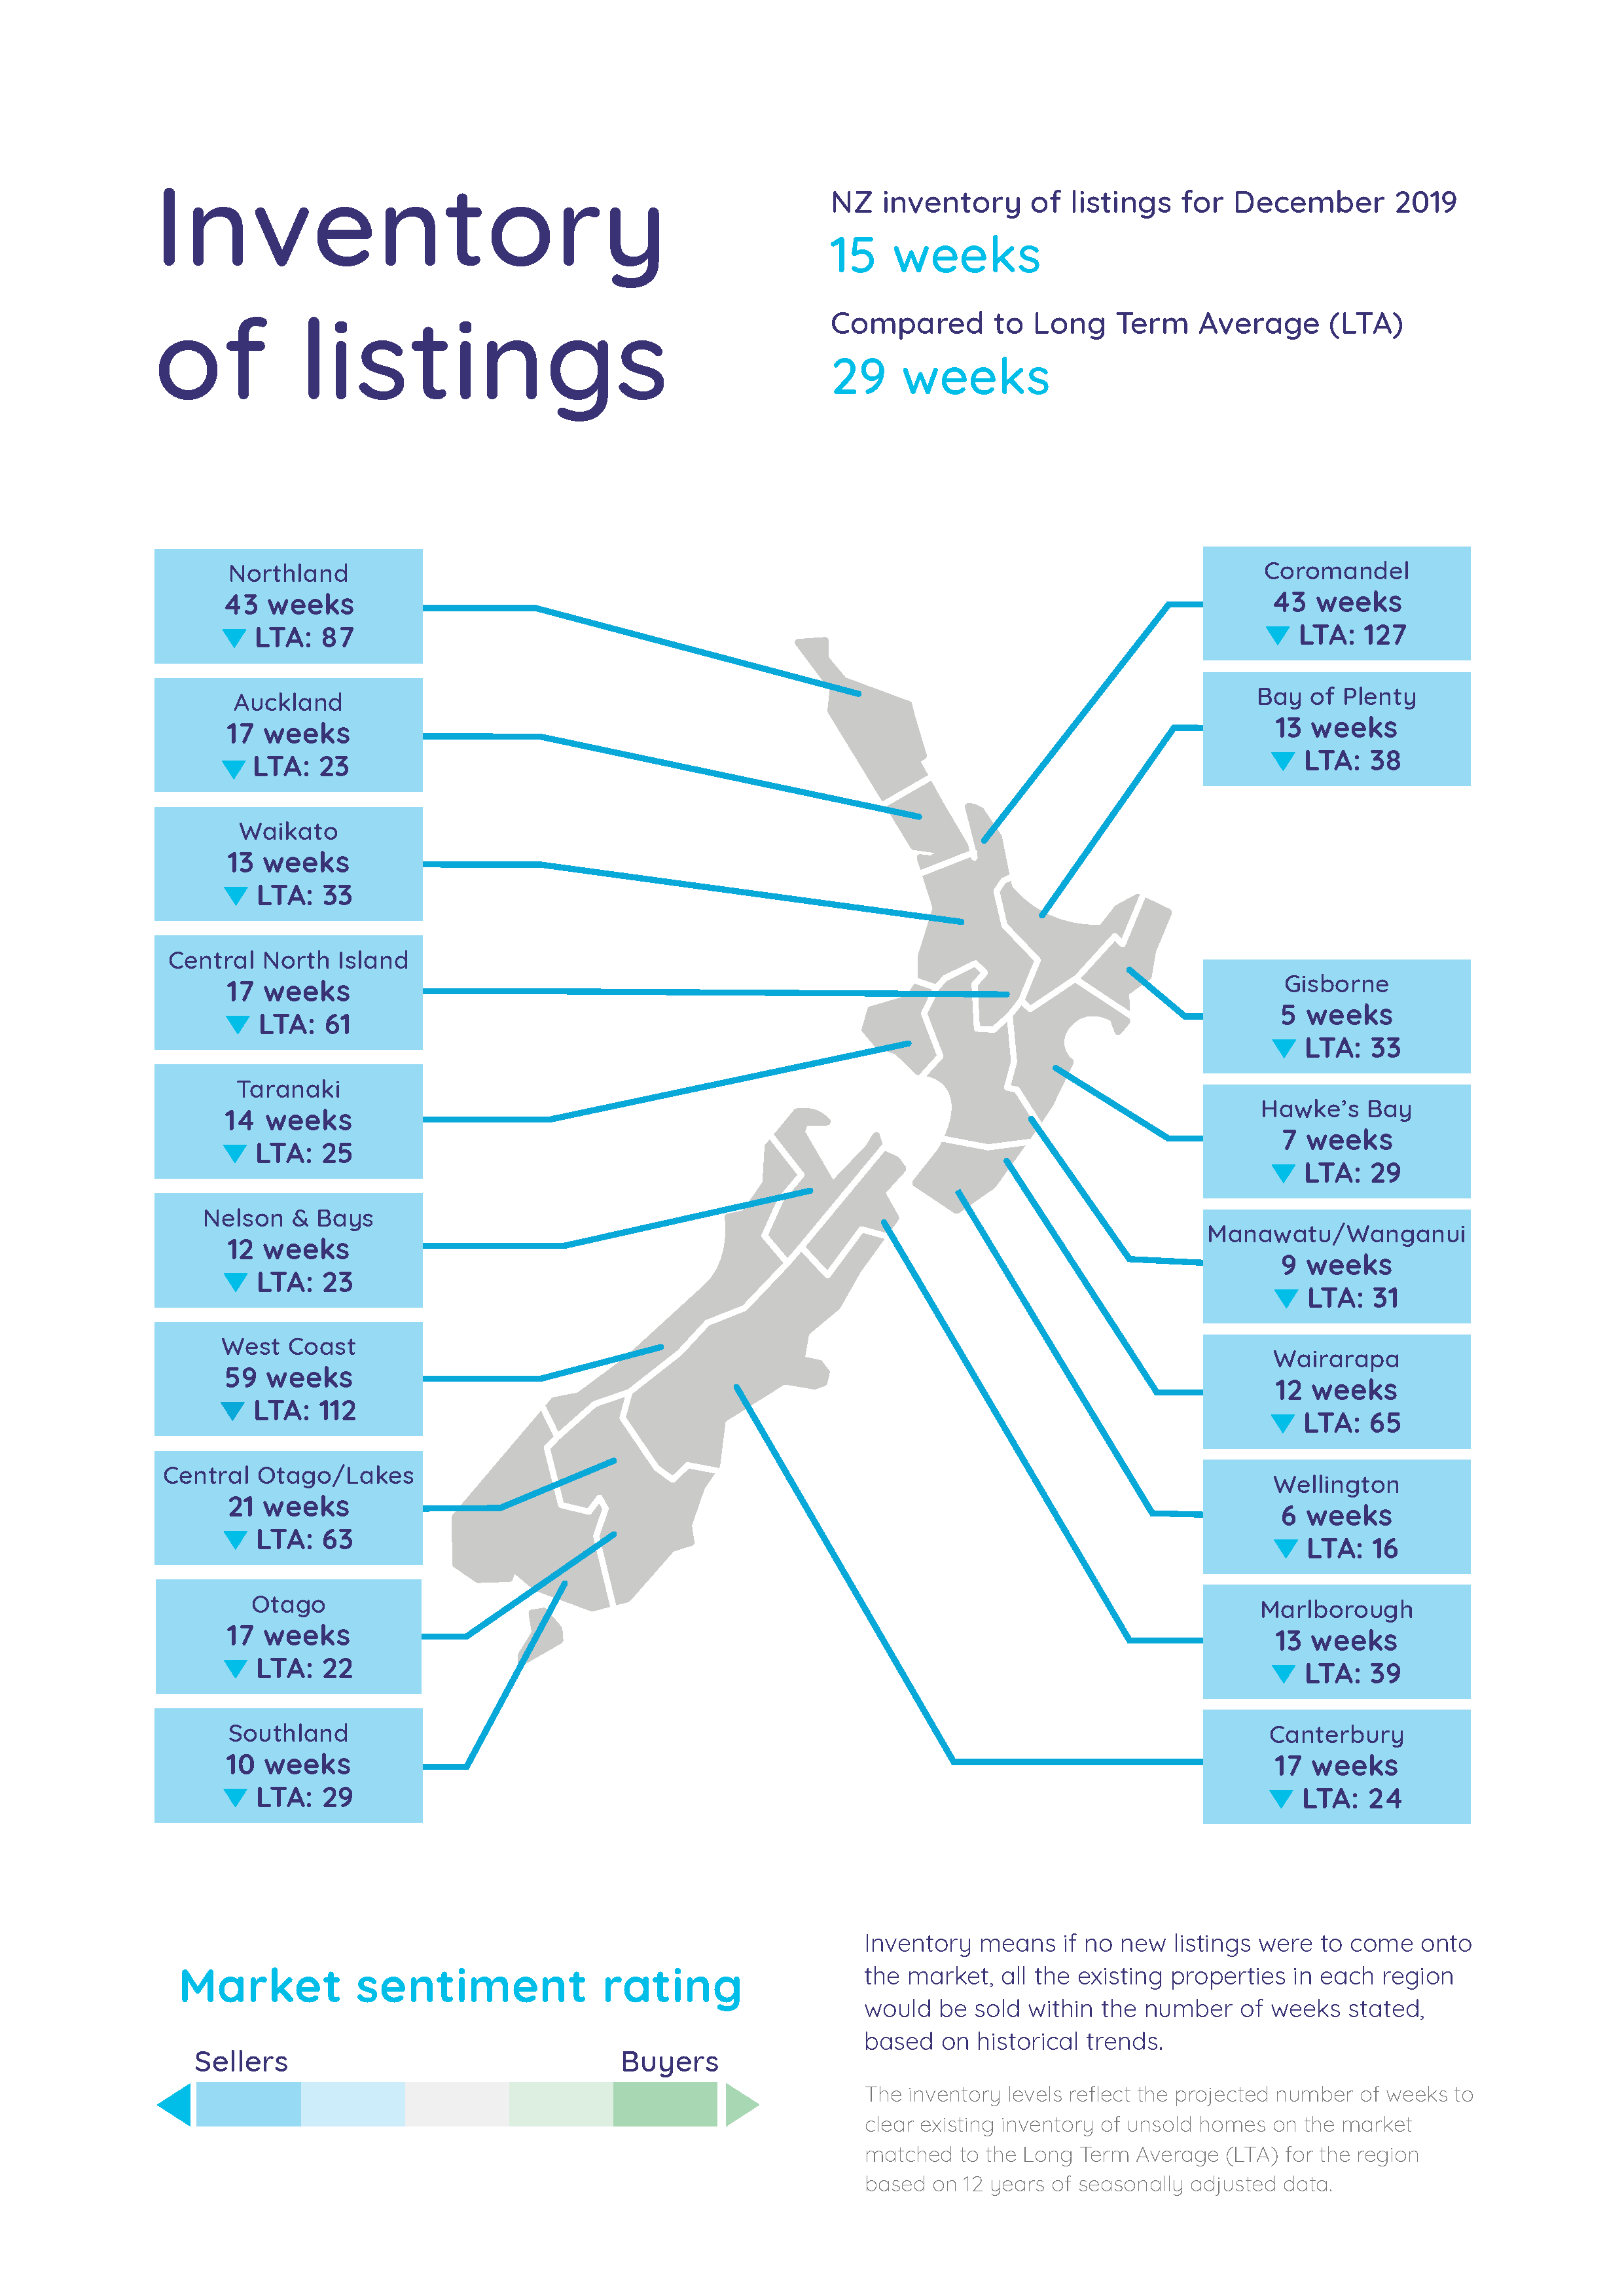
Total number of homes available for sale nationally was at an all-time low, since records began 13 years ago
The total homes available for sale have hit an unprecedented record low. Data shows that there were 24.5% less homes available for sale than in December 2018.
With only 18,230 properties available for sale around the country, the last time we saw a low close to this was in July 2016 when housing stock dropped to 20,682.
By comparison, the last recorded national stock high was in April 2008, when there were 59,795 total homes available for sale around the country.
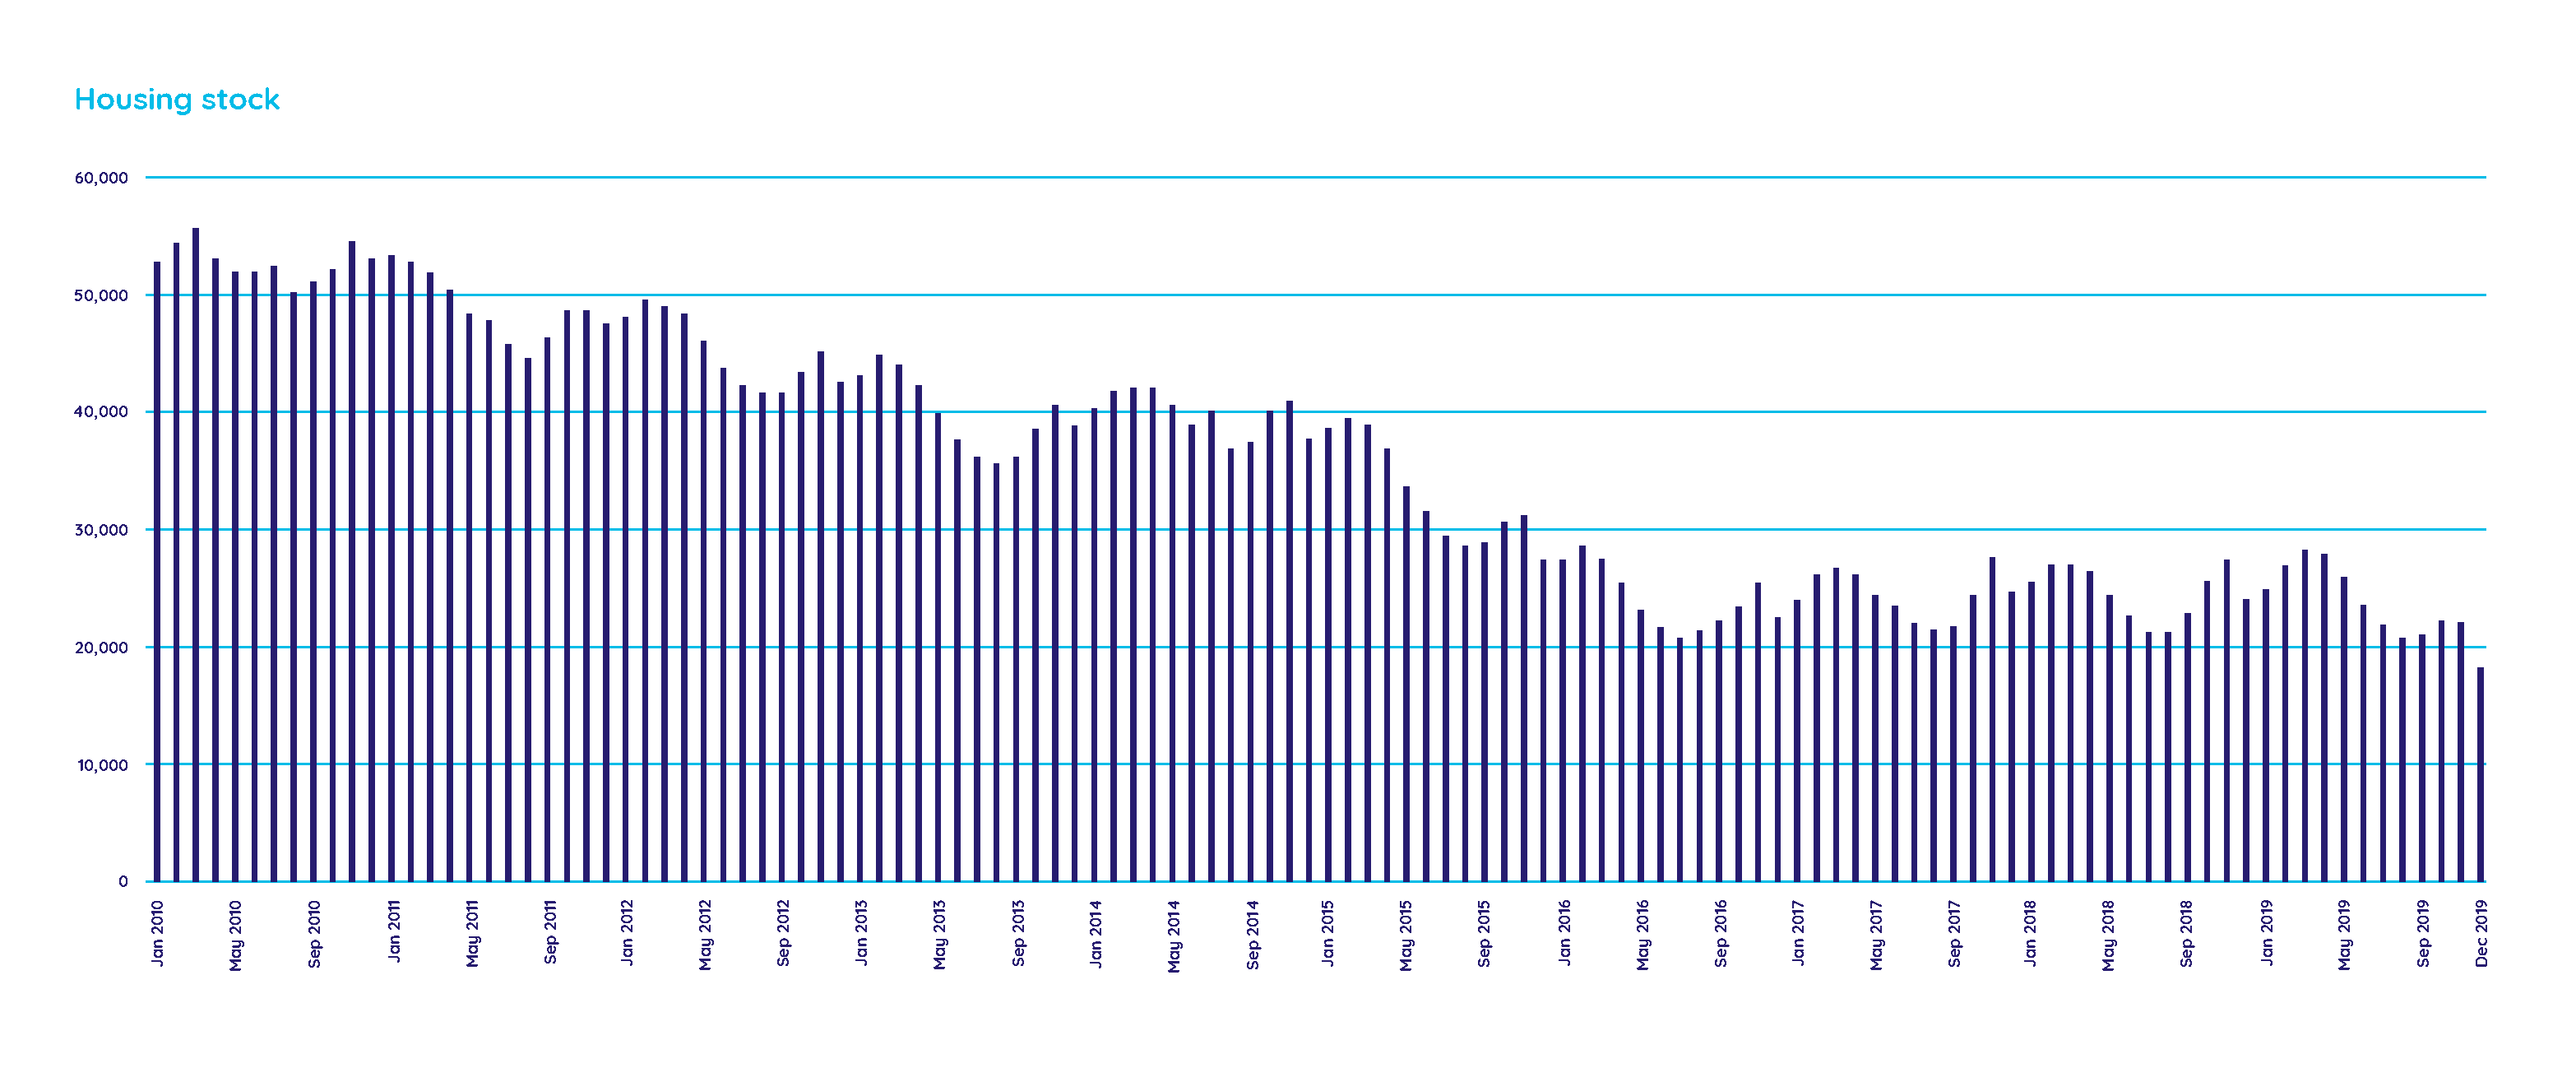
Housing stock nationally has been on a downward trajectory over the last decade potentially due to New Zealand’s population growth, which between 2008 and 2018 grew from 4,280,300 to 4,882,500.
Vanessa says that “with our population growing at a rate of approximately 60,000 people per year over a 10-year span, significant demand for housing is likely to be putting pressure on our property market.”
“In 2020, the total population of New Zealand is estimated be nearing or exceeding 5,000,000, so we might see this stock shortage continue for some time.”
Vanessa says that in times of shortage, people also tend to buy before they sell which could also be adding to the pressure.
“Given the limited choice of homes available, people are often reluctant to sell without having somewhere to go – especially if the rental market in their area is cramped.”
“This then has a flow-on effect with homes coming off the market before new ones go up for sale,” says Vanessa.
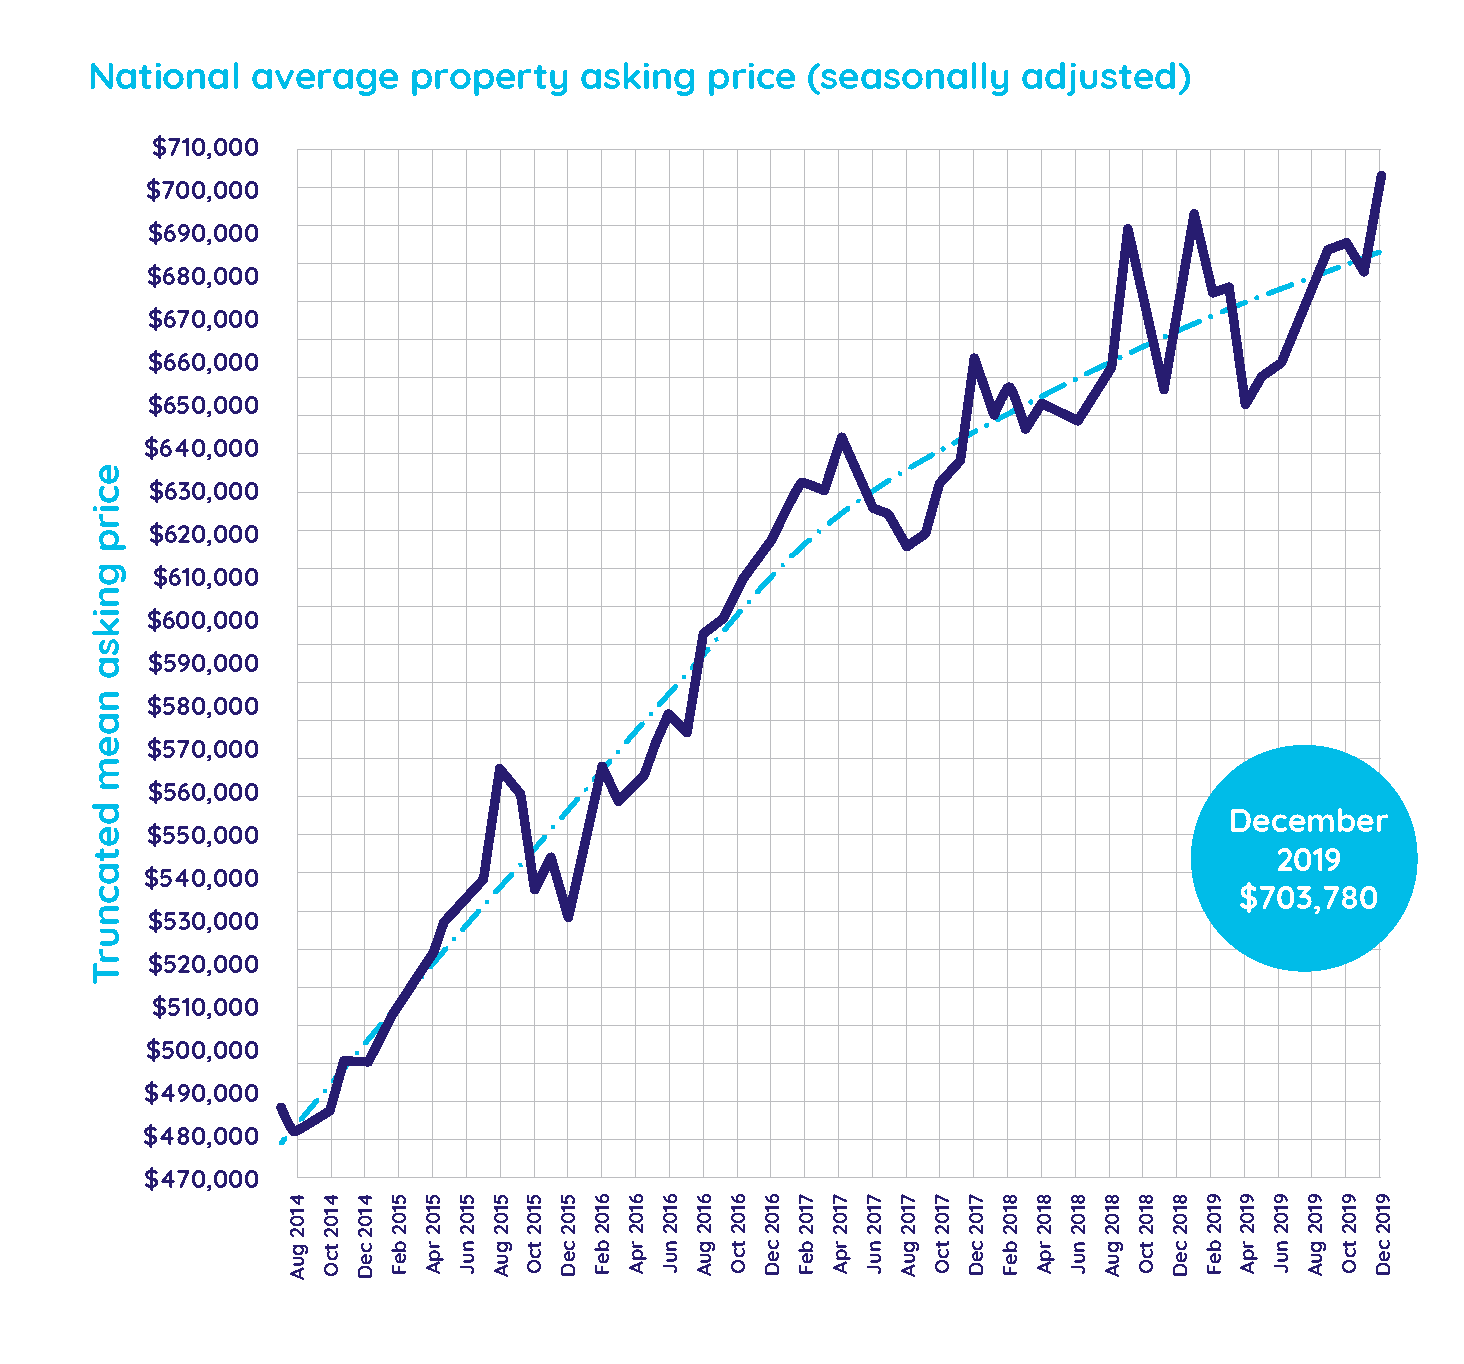
Average asking price tips over $700,000 nationally for the first time since records began 13 years ago
Last month we saw the national average asking price hit $703,780 for the first time since records began in 2007. The last recorded high was in January 2019 when the national average asking price peaked at $695,116. It then dropped back gradually from February 2019, bottoming out at $649,662 in April 2019 before climbing steadily through the rest of the year.
“Despite some peaks and troughs, average asking prices nationally are continuing to rise,” says Vanessa.
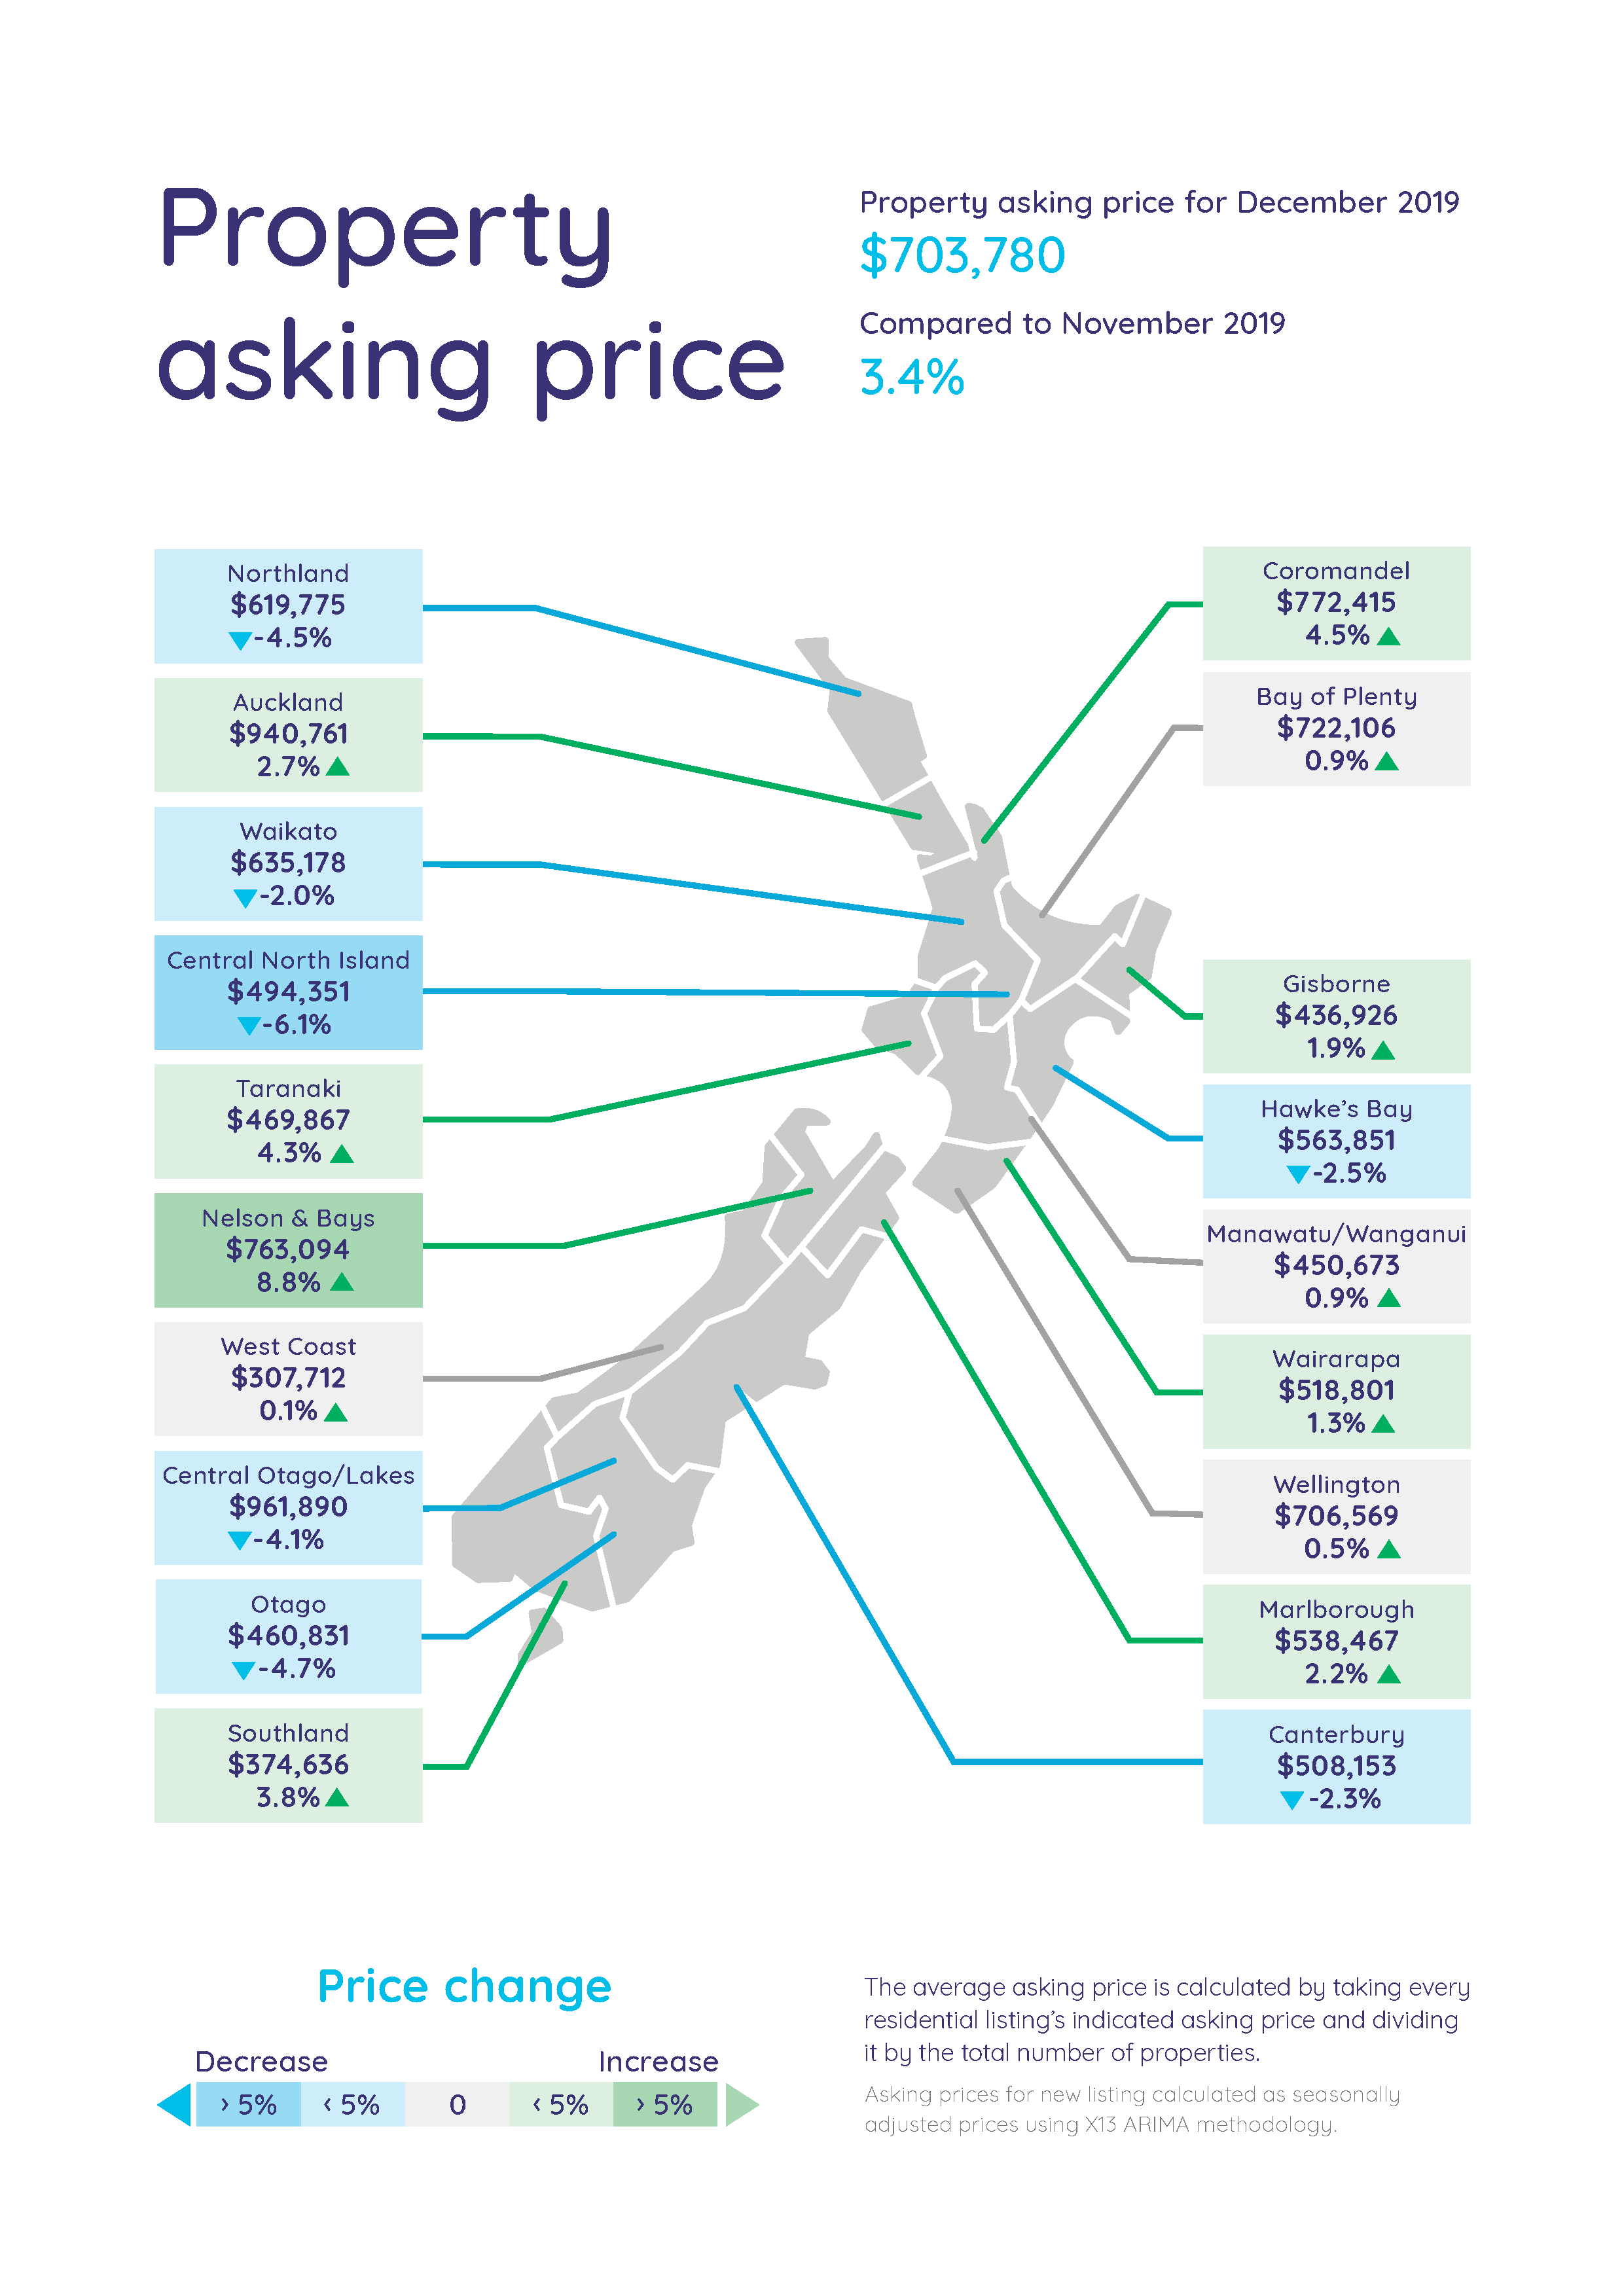
Regional New Zealand leading the charge with average asking price highs
Surprisingly, it was not our main centres of Auckland, Wellington or Canterbury demanding high prices in December – instead five of our regions set the trend with record average asking price highs. These regions were the Bay of Plenty, Nelson & Bays, Southland, Marlborough and Manawatu/Wanganui.
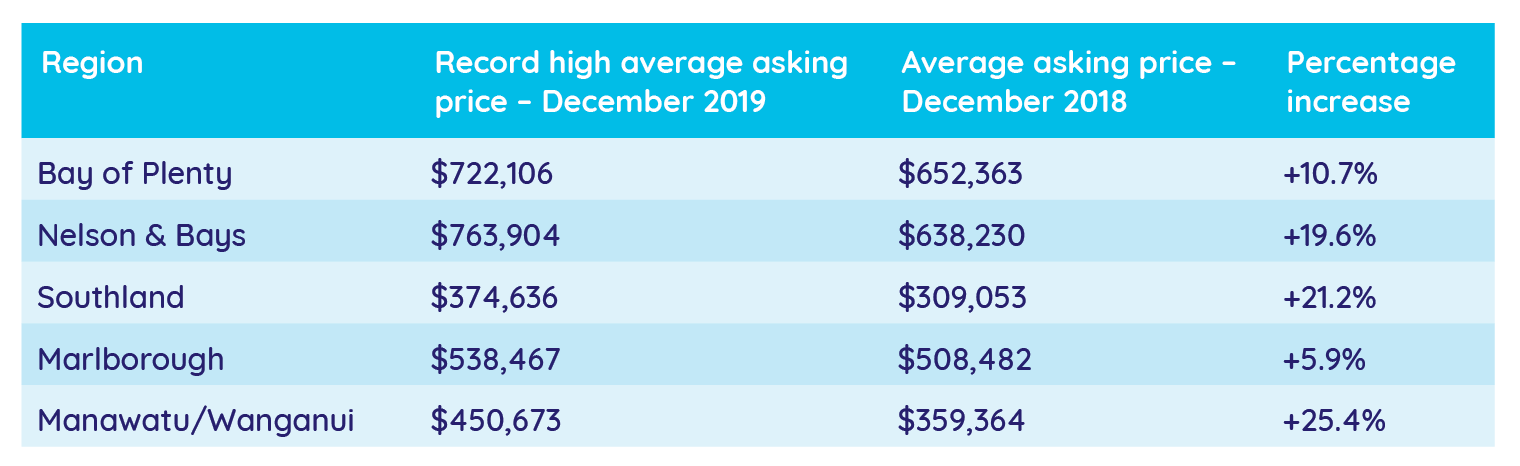
“We are seeing substantial year on year average asking price increases in a number of regions which, generally, tells us that the value of property is continuing to grow,” says Vanessa.
“The only regions where the average asking price has decreased, since the same time last year, are Auckland and the Wairarapa and even then, the decreases are just marginal at 1.4% and 0.3% respectively,” says Vanessa.
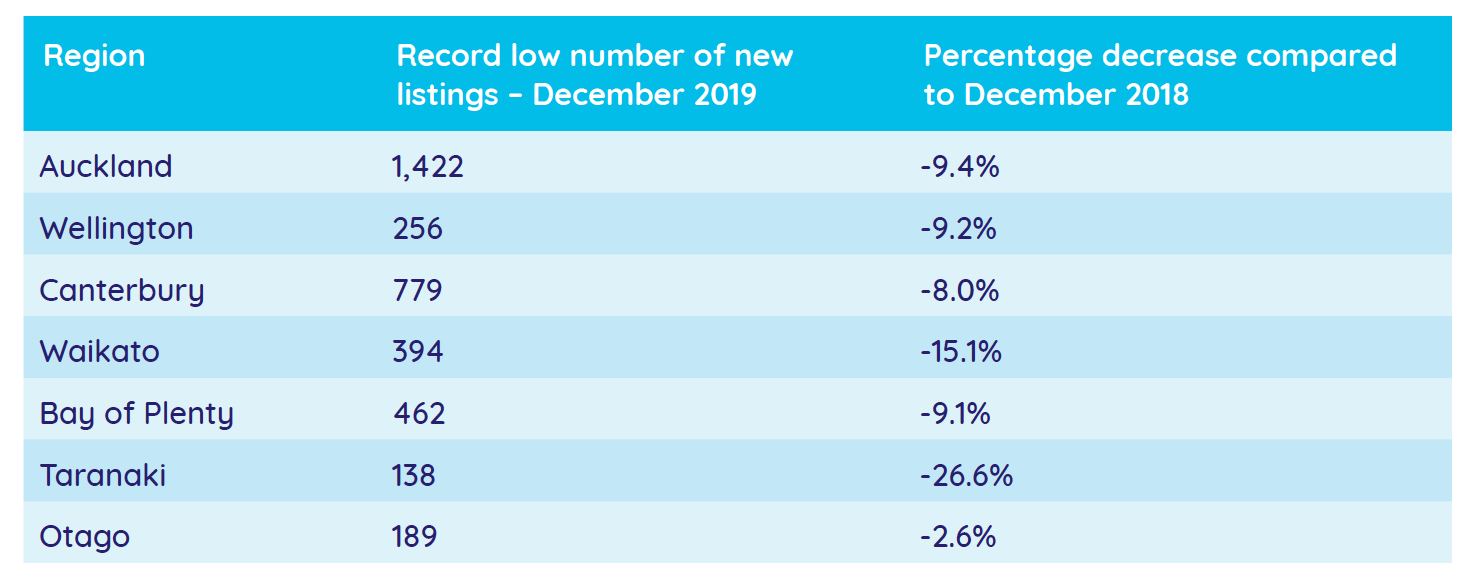
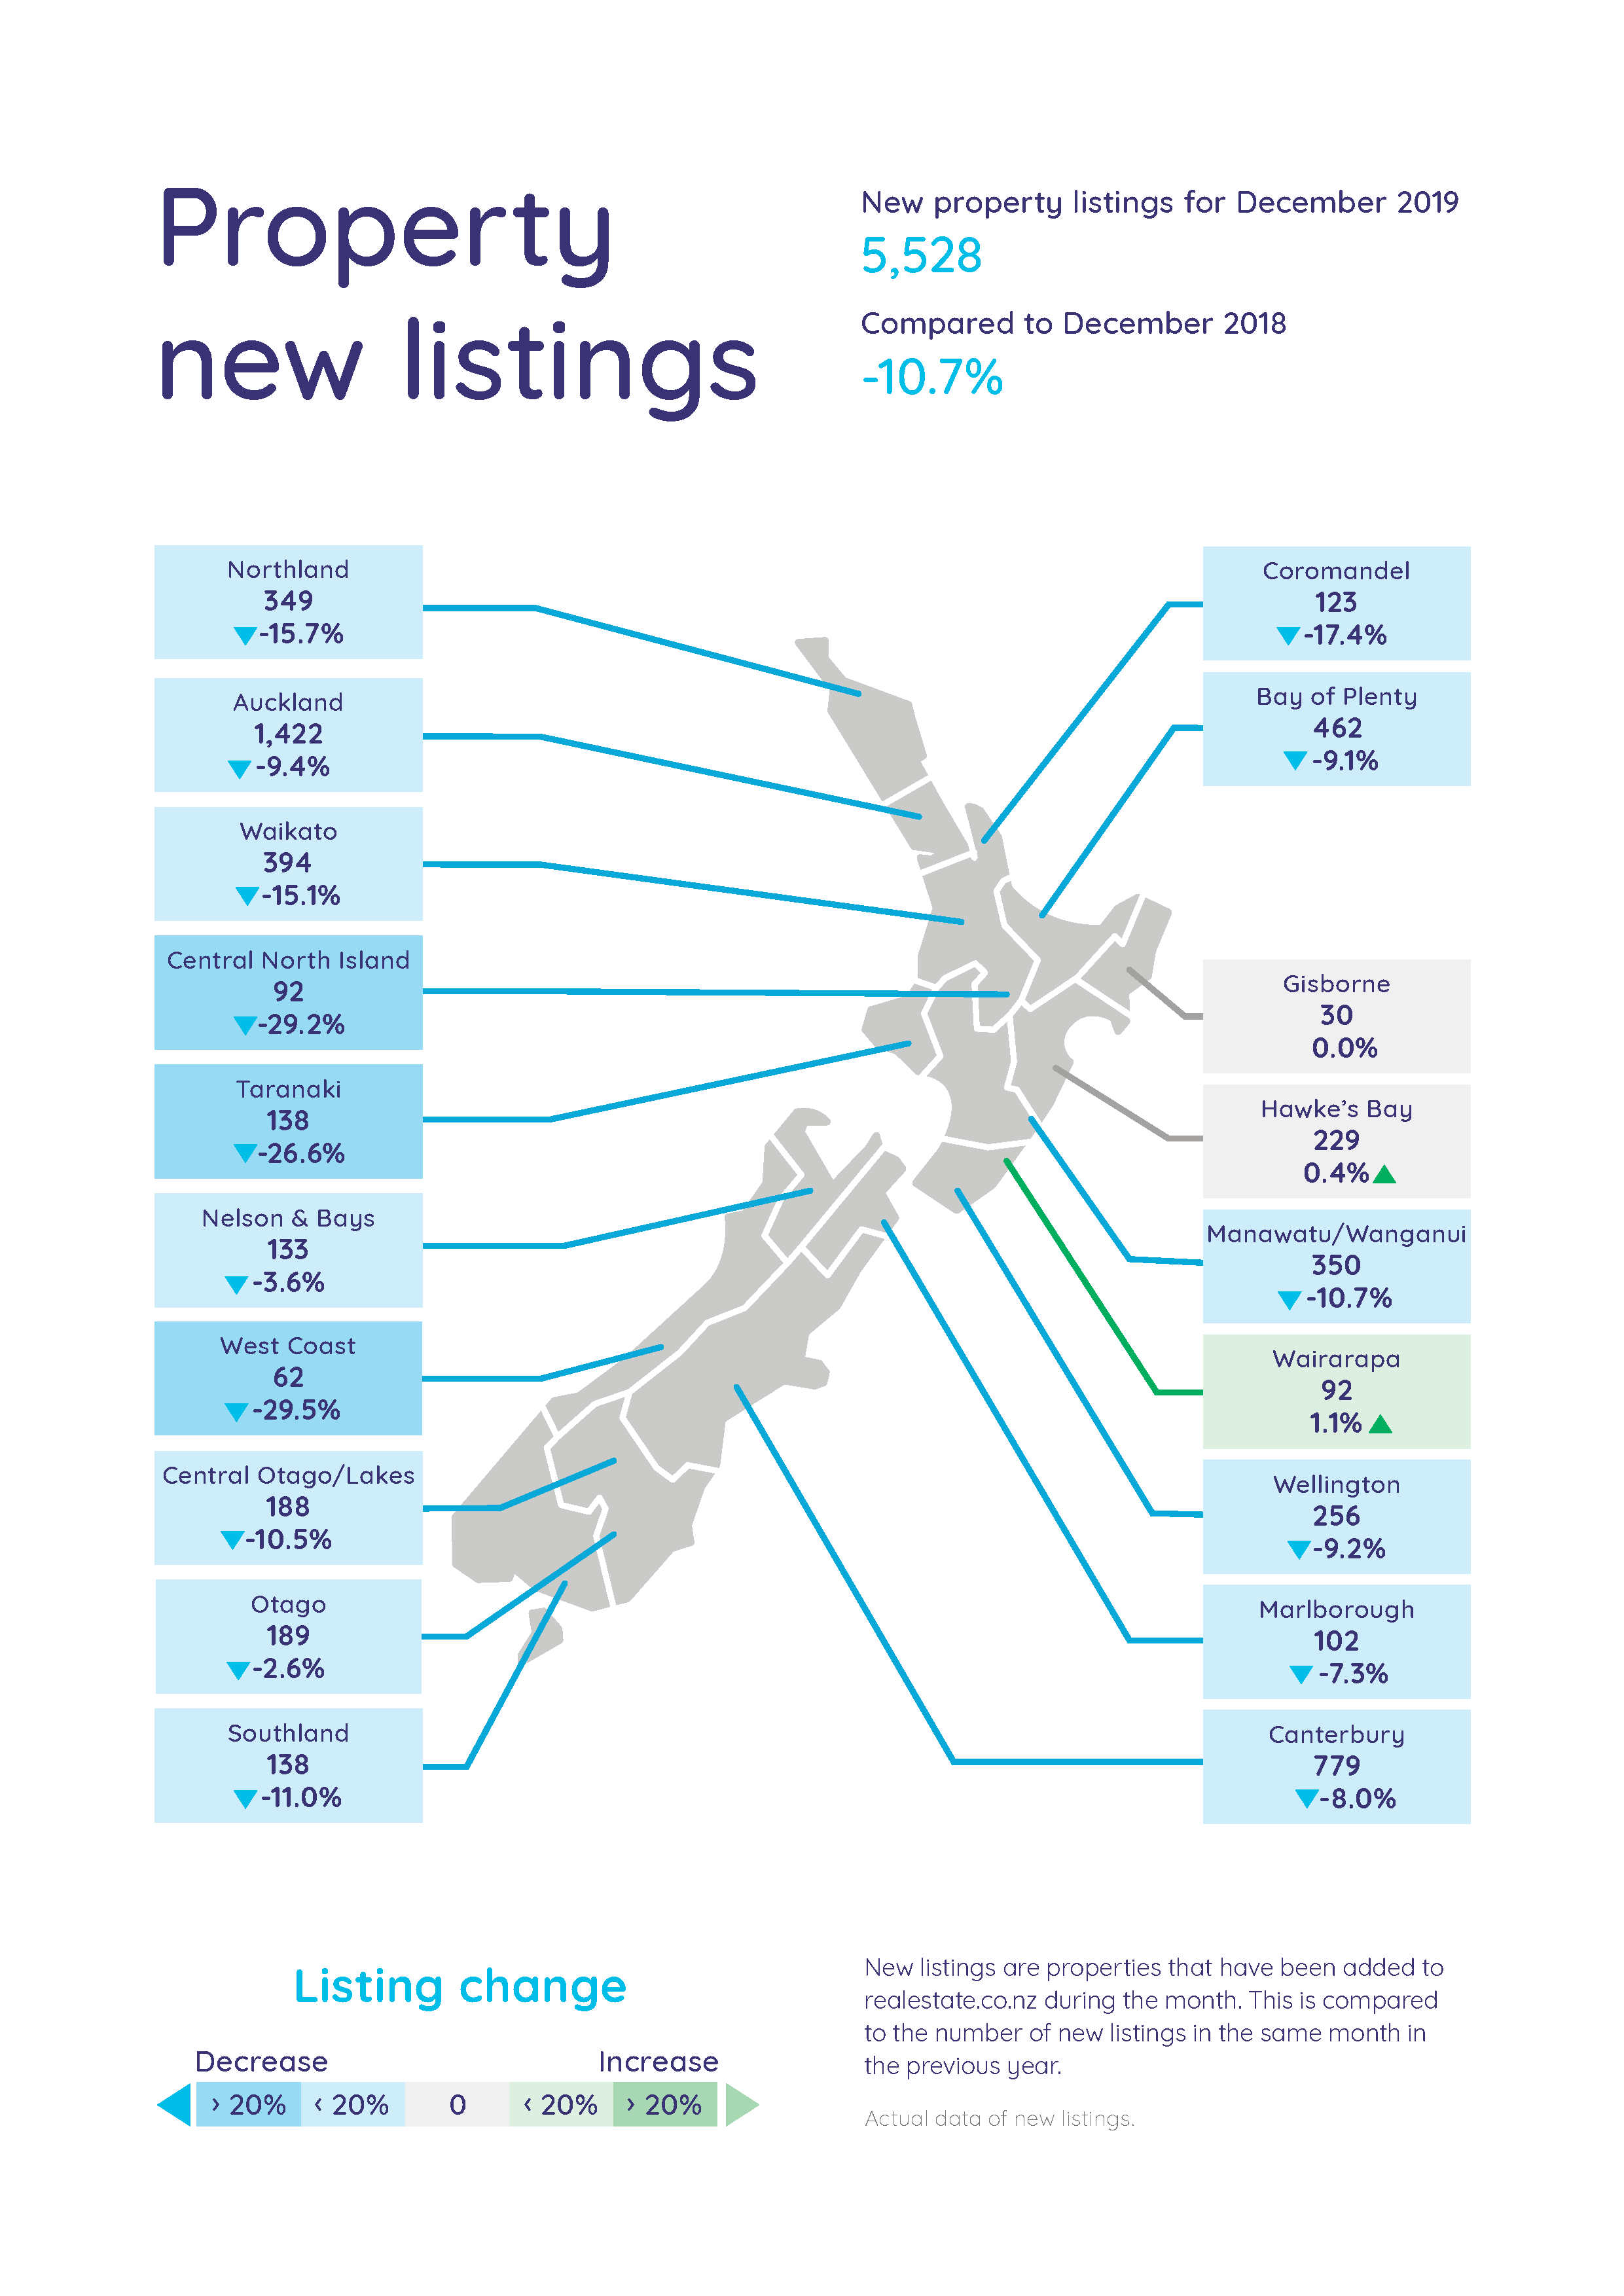
New listings reach all-time low nationally
New listings dropped below 6,000 for the first time, to 5,528 listings nationwide – a decrease of 10.7% since the same month last year.
Real-time data from realestate.co.nz shows that this is the lowest level of new listings we’ve seen since December 2018 when new listings were 6,187. The lack of new houses coming onto the market could mean that Kiwis were more focussed on getting through the last few weeks of work and into the festive season than on selling their homes.
The main centres of Auckland, Wellington and Canterbury all hit record lows in December 2019 with new listings decreasing.
New listings were also down in most other regions with Waikato, Bay of Plenty, Taranaki and Otago also reaching record lows. The only increase across the country was in Wairarapa where we saw a marginal increase of 1.1%.
Vanessa says it will be interesting to see if there is a surge of Kiwis putting their homes on the market after the holiday break.
“New listings were down during most of 2019 so we will be watching to see if there is an influx of new listings in late January and February once people get back into a routine after the summer break.”
For media enquiries, please contact:
Trish Fitzsimons | 021 022 96927 | trish@realestate.co.nz
Glossary of terms: As the only provider of real estate data in real-time, realestate.co.nz offers valuable property market information not available from other sources. Data from realestate.co.nz span 13 years with data records since 2007 available.
- Average asking price is not a valuation. It is an indication of current market sentiment. Statistically, asking prices tend to correlate closely with the sales prices recorded in future months when those properties are sold. As it looks at different data, average asking prices may differ from recorded sales data released at the same time.
- Inventory is a measure of how long it would take, theoretically, to sell the current stock at current average rates of sale if no new properties were to be listed for sale. It provides a measure of the rate of turnover in the market.
- New listings are a record of all the new listings on realestate.co.nz for the relevant calendar month. As realestate.co.nz reflects 97% of all properties listed through registered estate agents in New Zealand, this gives a representative view of the New Zealand property market.
- Demand: the increase or decrease in the number of views per listing in that region, taken over a rolling three-month time frame, compared to the same three-month time frame the previous year – including the current month.
- Seasonal adjustment is a method realestate.co.nz uses to better represent the core underlying trend of the property market in New Zealand. This is done using methodology from the New Zealand Institute of Economic Research.
- Truncated mean is the method realestate.co.nz uses to provide statistically relevant asking prices. The top and bottom 10% of listings in each area are removed before the average is calculated, to prevent exceptional listings from providing false impressions.
Share
-
.svg)
.svg)
.svg)