
.svg)


Download the full New Zealand Property Report as a PDF.
The national average asking price for a Kiwi home is at an all-time high, since records began 12 years ago. There is more choice for property hunters in the Auckland region, as new listings are up while asking prices stay static, but Kiwis’ passion for property remains strong.
Eight regions’ all-time asking price highs are the major driving force behind a new record high for New Zealand’s average asking house price.
“Auckland is not one of those regions, but has its own story to tell,” says realestate.co.nz spokesperson Vanessa Taylor.
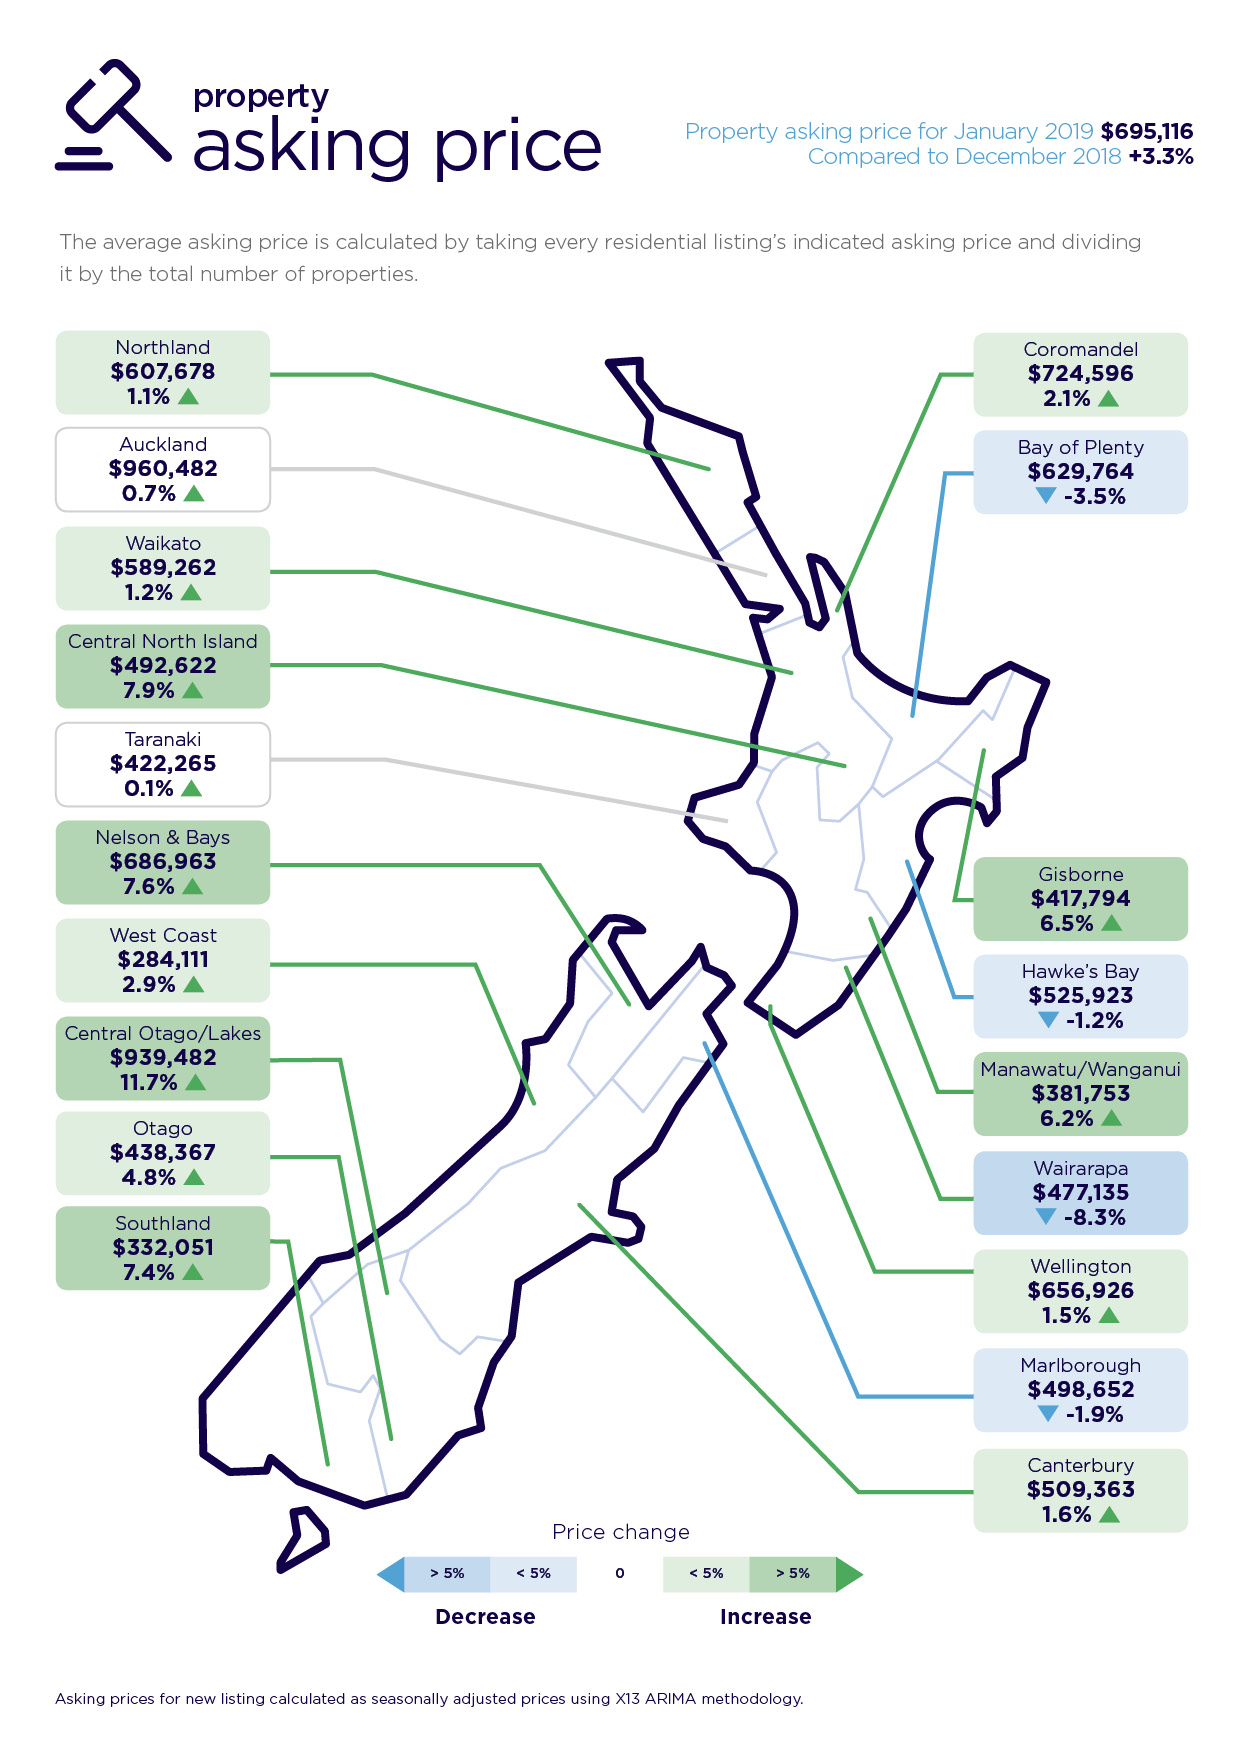
Real-time statistics from the country’s largest property listing site show the national property asking price in January 2019 climbed 3.3% on the previous month to $695,116 - the highest on record.
Spokesperson Vanessa Taylor says when realestate.co.nz started collecting data 12 years ago (January 2007) the average national asking price for a property was $410,666.
“Since then, the continuous increases in the national asking prices have largely been led by the Auckland region, but this month it was a diverse mix of eight other regions which took the limelight,” she says.
“These eight regions paint an interesting picture. Typically, they have experienced a fall in new listings, and have low overall stock levels, which has helped vendors command handsome prices for their properties.
The eight regions that experienced all-time high asking prices in January were Waikato, Gisborne, Wellington, Nelson and Bays, Otago, Southland, Central North Island and Manawatu/Wanganui.
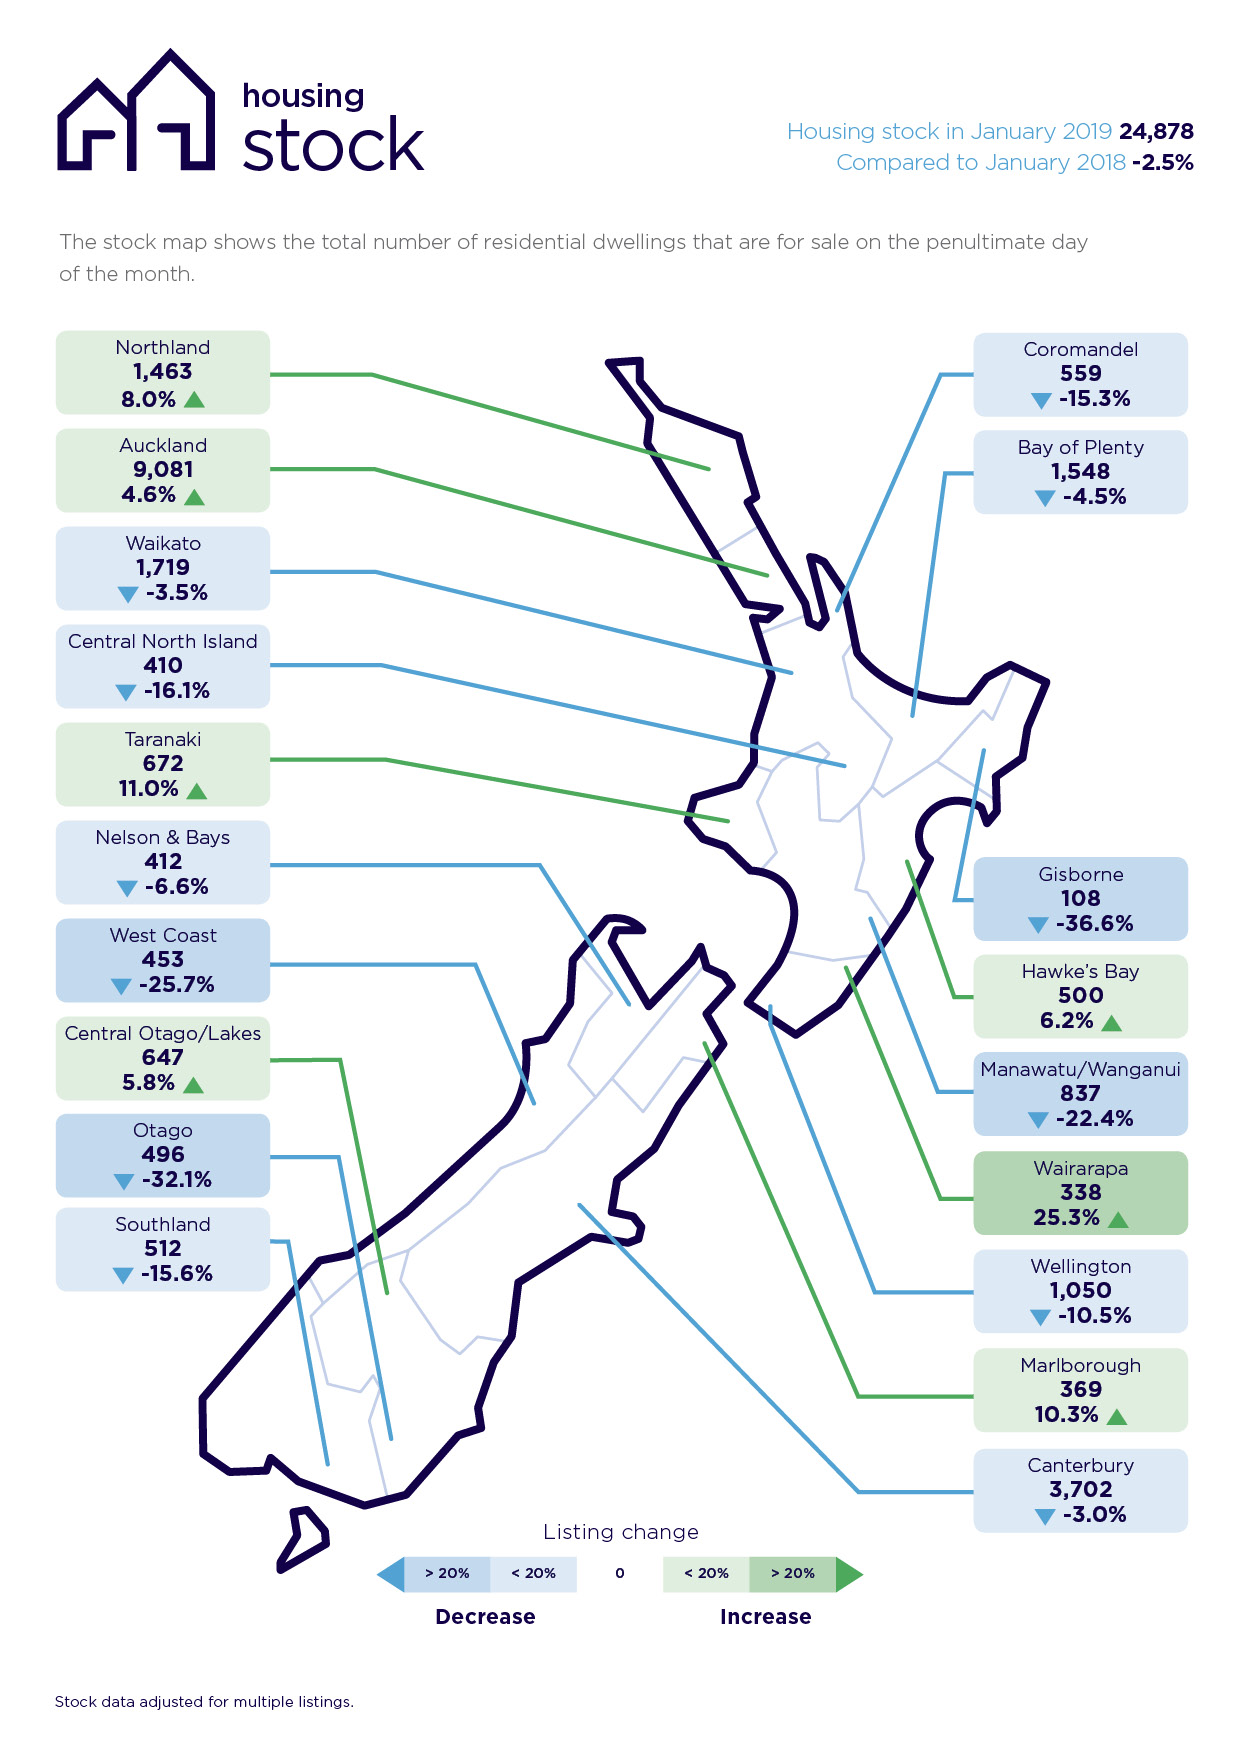
Nationally, there was a 2.5% fall in the total number of houses for sale in January compared with January 2018. The total number of houses for sale across New Zealand in January was 24,878.
Despite this fall in houses for sale across the country, property seekers were still heavily interested in the market, with realestate.co.nz registering 1,126,076 unique users who were browsing for property in January.
“The Kiwi passion for property is alive and kicking,” says Vanessa.
The Auckland region a different story
“The Auckland region also has its own unique story to tell and is tending to favour those who are buying,” says Vanessa.
While total housing stock across the nation was down 2.5% when compared to January 2018, in the Auckland region stock was up 4.6% with a total of 9,081 homes on the market.
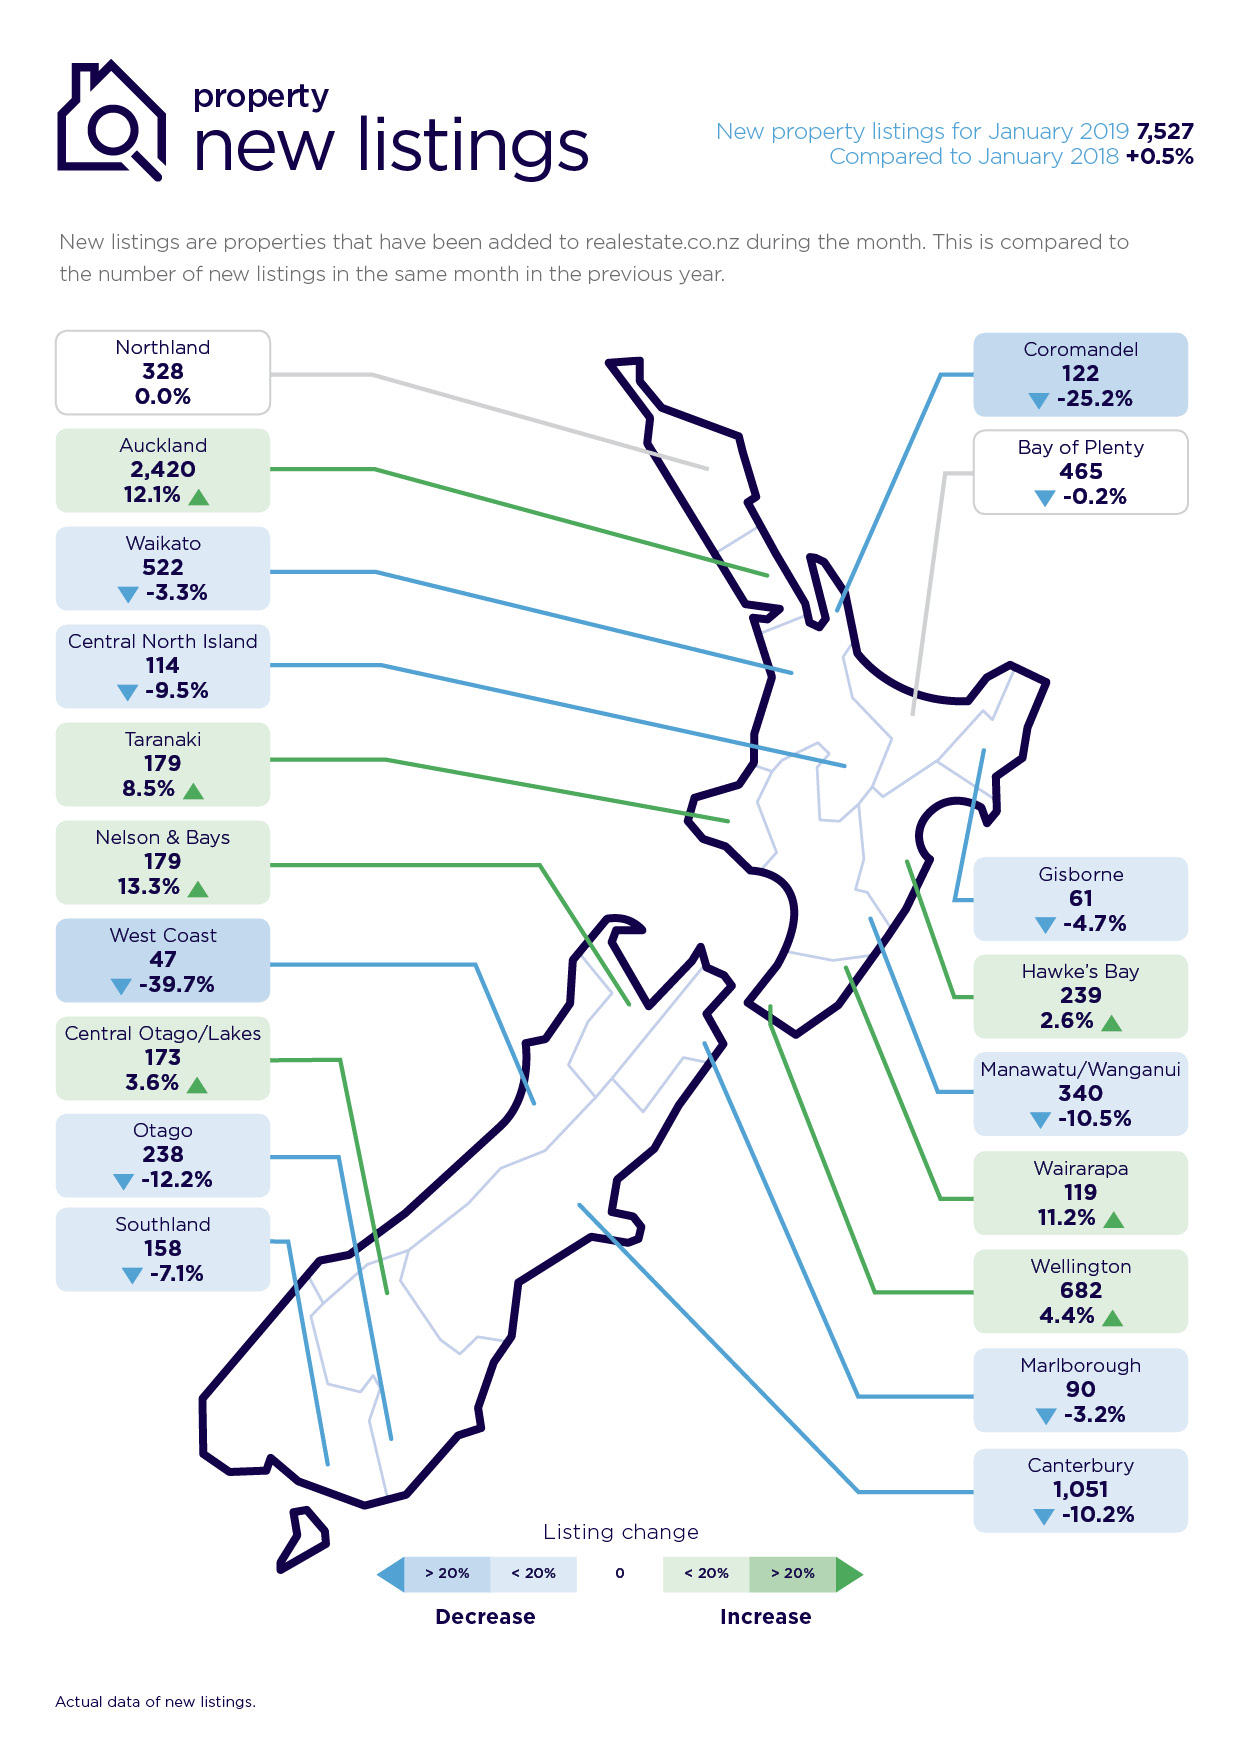
Of these 9,081 homes, 2,420 were new listings, which is a 12.1% increase on January 2018. The average asking price in the Auckland region was flat (a slight increase of 0.7% to $960,482) when compared to December 2018.
“The Auckland market is favouring buyers, with a fresh injection of new listings, a flattening in the average asking price and a slowdown in the time it takes for properties to sell.*
“More choice, more time and less pressure if you’re home hunting,” says Vanessa.
Record asking price highs in eight regions, led by Wellington, Otago and Waikato
While Auckland’s average asking price remained static, a diverse mix of eight regions registered all-time highs, since records began in January 2007.
Otago region
Of the three larger regions (Wellington, Otago and the Waikato), it was Otago which recorded the largest asking price increase (up 4.8% to $438,367 compared to the prior month).
Vanessa Taylor says this is not surprising given that there was a significant drop in new listings in the Otago region (down 12.2% compared to January 2018) and only 496 properties in total for sale in the region (down 32.1% compared to a year ago).
“It’s a very tight market and this would be influencing the asking price,” she says.
Wellington region
“It’s no shock that the Wellington region’s average asking price continued to rise and hit a new record in January, although the increase was relatively modest,” says Vanessa Taylor.
“The Wellington region has traditionally been tightly held, with a scarcity in listings,” she says.
The average asking price rose 1.5% in January to $656,926.
There were 682 new listings in January (up 4.4% on January 2018) bringing the total number of homes for sale to 1,050. This was down 10.5% compared to January 2018.
“The city of Wellington is such a tight market so it’s good to see a healthy injection of new listings, however, it’s not unexpected that in January the region set a record average asking price based on total stock numbers,” says Vanessa.
Waikato region
Waikato saw a new record asking price high of $589,262, a 1.2% increase on the previous month and like other record-breaking regions, it was coupled with falls in new listings and total housing stock.
The number of new listings fell compared to January 2018 (522 new listings, down 3.3%) and total stock was down 3.5% to 1,719.
Five smaller regions make up the numbers
While three of New Zealand’s main regions hit new records, five smaller regions also made history, with all-time asking price highs.
All but one of the five regions experienced the same mix of property fundamentals, namely a fall in new listings, a fall in overall stock and a record asking price.
Nelson and Bays was the exception, in that it recorded an all-time average asking price high of $686,963 (up 7.6% compared to the prior month) and a fall in total housing stock compared to the previous year (down 6.6% to 412 listings). However new listings were up, reaching 179 when compared to January 2018, a 13.3% increase.
The Central North Island’s asking price lifted to $492,622 in January (which was a 7.9% increase on December 2018). New listings in January stood at 114, down 9.5% compared to January 2018 while total stock also fell 16.1% to 410, compared to the same period last year.
Southland’s record asking price of $332,051 was a 7.4% increase on December 2018. Stock levels were low in January, with 512 homes for sale, down 15.6% on the same month the previous year. New listings represented 158 of the homes for sale in January, down 7.1% on January 2018.
The Manawatu/Wanganui region’s asking price hit $381,753 and was a 6.2% increase on December 2018. With a 10.5% fall in new property listings (340 in January 2019 compared to January 2018) and a total of 837 homes on the market, down 22.4%, it’s not surprising asking prices have lifted.
In the Gisborne region, property asking prices reached an all-time high of $417,794. This is a 6.5% increase on the previous month. New listings were down in January (61 homes representing a 4.7% drop on the same month last year). In January this year, the Gisborne region showed 108 homes listed for sale, a 36.6% fall compared to January 2018.
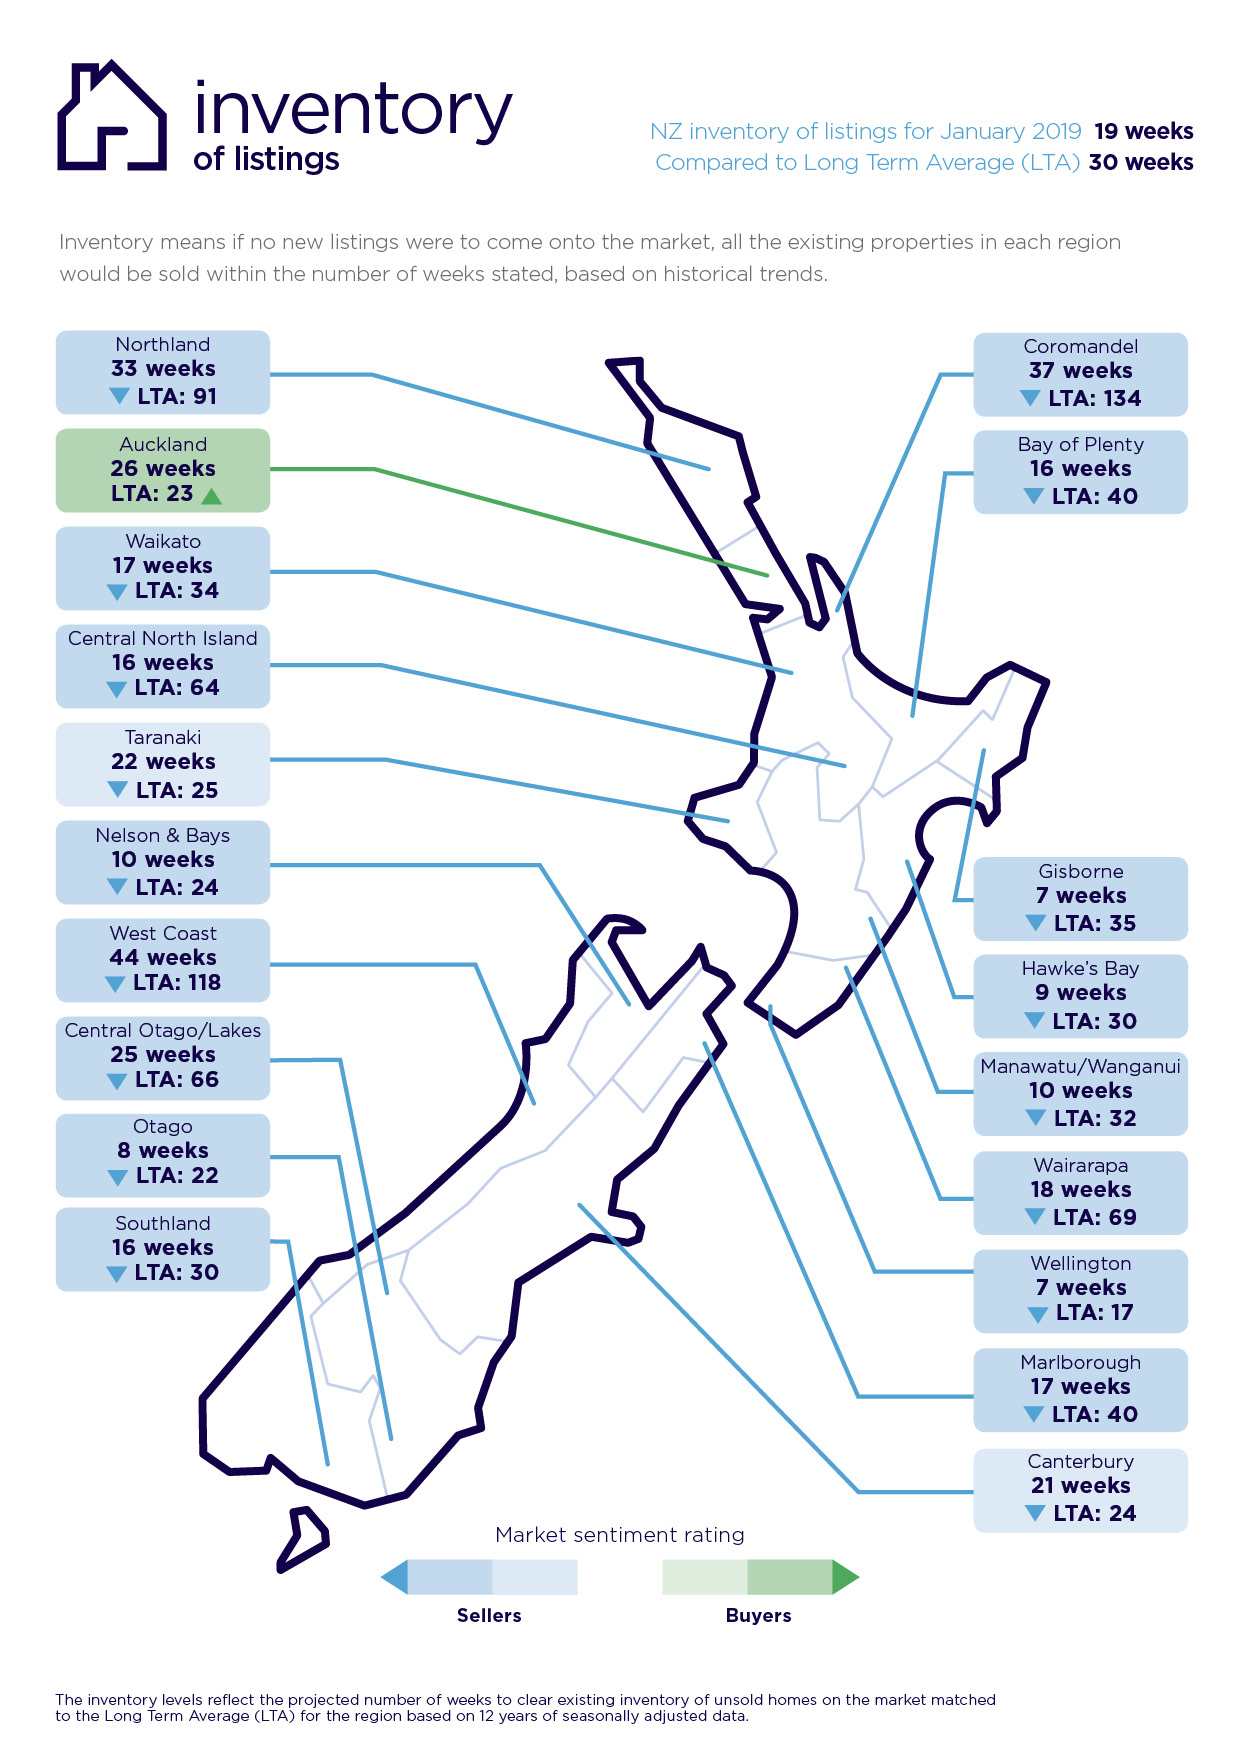
*The injection of new listings and increase in total stock shows us that if theoretically no new homes were to come onto the market, at the current sale rate the total pool of houses for sale on the market would sell out in 26 weeks - which is 3 weeks longer than the long-term average of 23 weeks for the Auckland region.
Glossary of terms:
As the only provider of real estate data in real time, realestate.co.nz offers valuable property market information not available from other sources.
- Average asking price gives an indication of current market sentiment. Statistically, asking prices tend to correlate closely with the sales prices recorded in future months when those properties are sold. As it looks at different data, average asking prices may differ from recorded sales data released at the same time.
- Inventory is a measure of how long it would take, theoretically, to sell the current stock at current average rates of sale if no new properties were to be listed for sale. It provides a measure of the rate of turnover in the market.
- New listings are a record of all the new listings on realestate.co.nz for the relevant calendar month. As realestate.co.nz reflects 97% of all properties listed through registered estate agents in New Zealand, this gives a representative view of the New Zealand property market.
- Demand is the increase or decrease in the number of views per listing in that region, taken over a rolling three-month time frame, compared to the same three-month time frame the previous year – including the current month.
- Seasonal adjustment is a method realestate.co.nz uses to better represent the core underlying trend of the property market in New Zealand. This is done using methodology from the New Zealand Institute of Economic Research.
- Truncated mean is the method realestate.co.nz uses to provide statistically relevant asking prices.
- The top and bottom 10% of listings in each area are removed before the average is calculated, to prevent exceptional listings from providing false impressions.
For media enquiries, please contact:
Alex Dudley, PPR
T: +64 27 5399 555
E: alex.dudley@ppr.co.nz
Share
-
.svg)
.svg)
.svg)