
.svg)


Download the full New Zealand Property Report as a PDF.
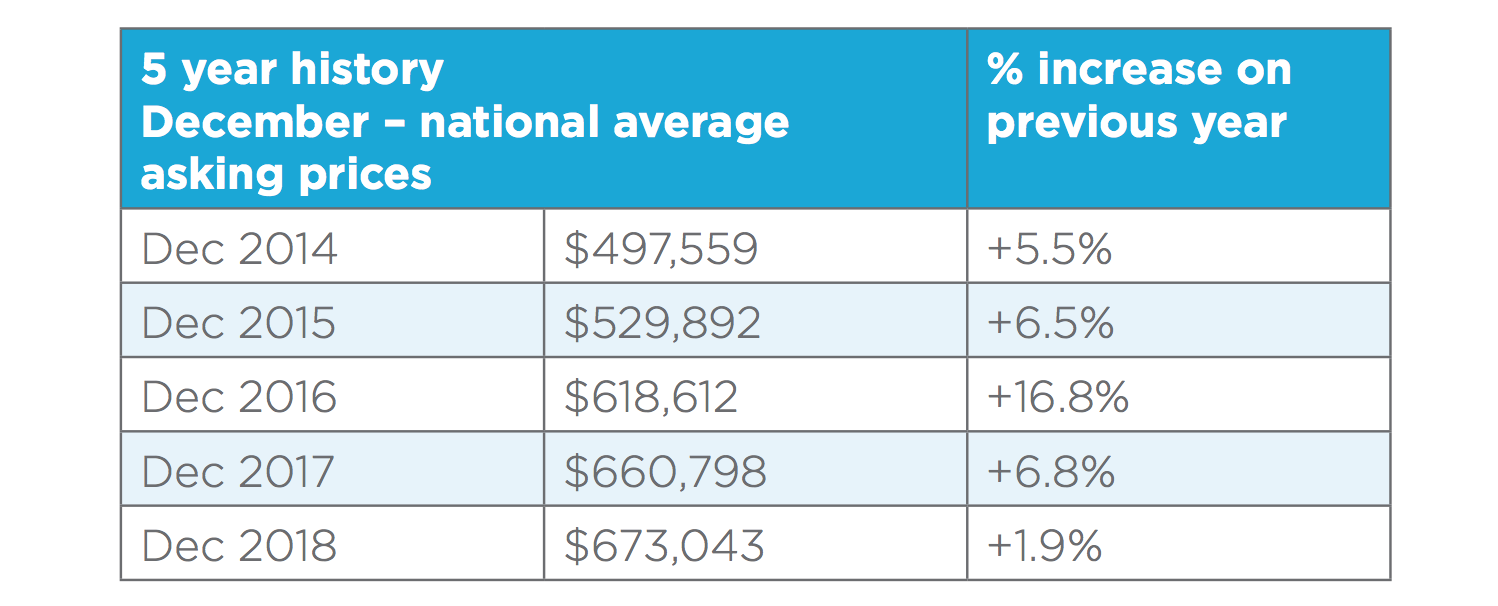
One year ago (December 2017) the national average asking price for a home was $660,798 on realestate.co.nz, the country’s largest property listing site. One year later (December 2018) it sits at $673,043.
This 1.9% price increase is the lowest (year-on-year) for any December since 2012.
“While this may well be a correction rather than a trend, this past year has seen the market stabilise compared to the extremes of previous years,” says realestate.co.nz spokesperson Vanessa Taylor.
“We have had fluctuations in average asking prices throughout 2018 and in fact the national average asking price in December was 3.0% up on the previous month (November 2018).
“However, the modest 1.9% December 2018 increase compared to December 2017 reflects a smoothing out, compared to the upward trajectory of recent years.”
“One of the challenges for sellers and buyers at the height of rapidly escalating house prices in recent years was timing.
“Purchasing a house in a stable market reduces the pressure to make snap decisions,” says Vanessa.
“The Auckland region has naturally dominated movements in the average national asking price due to its size,”
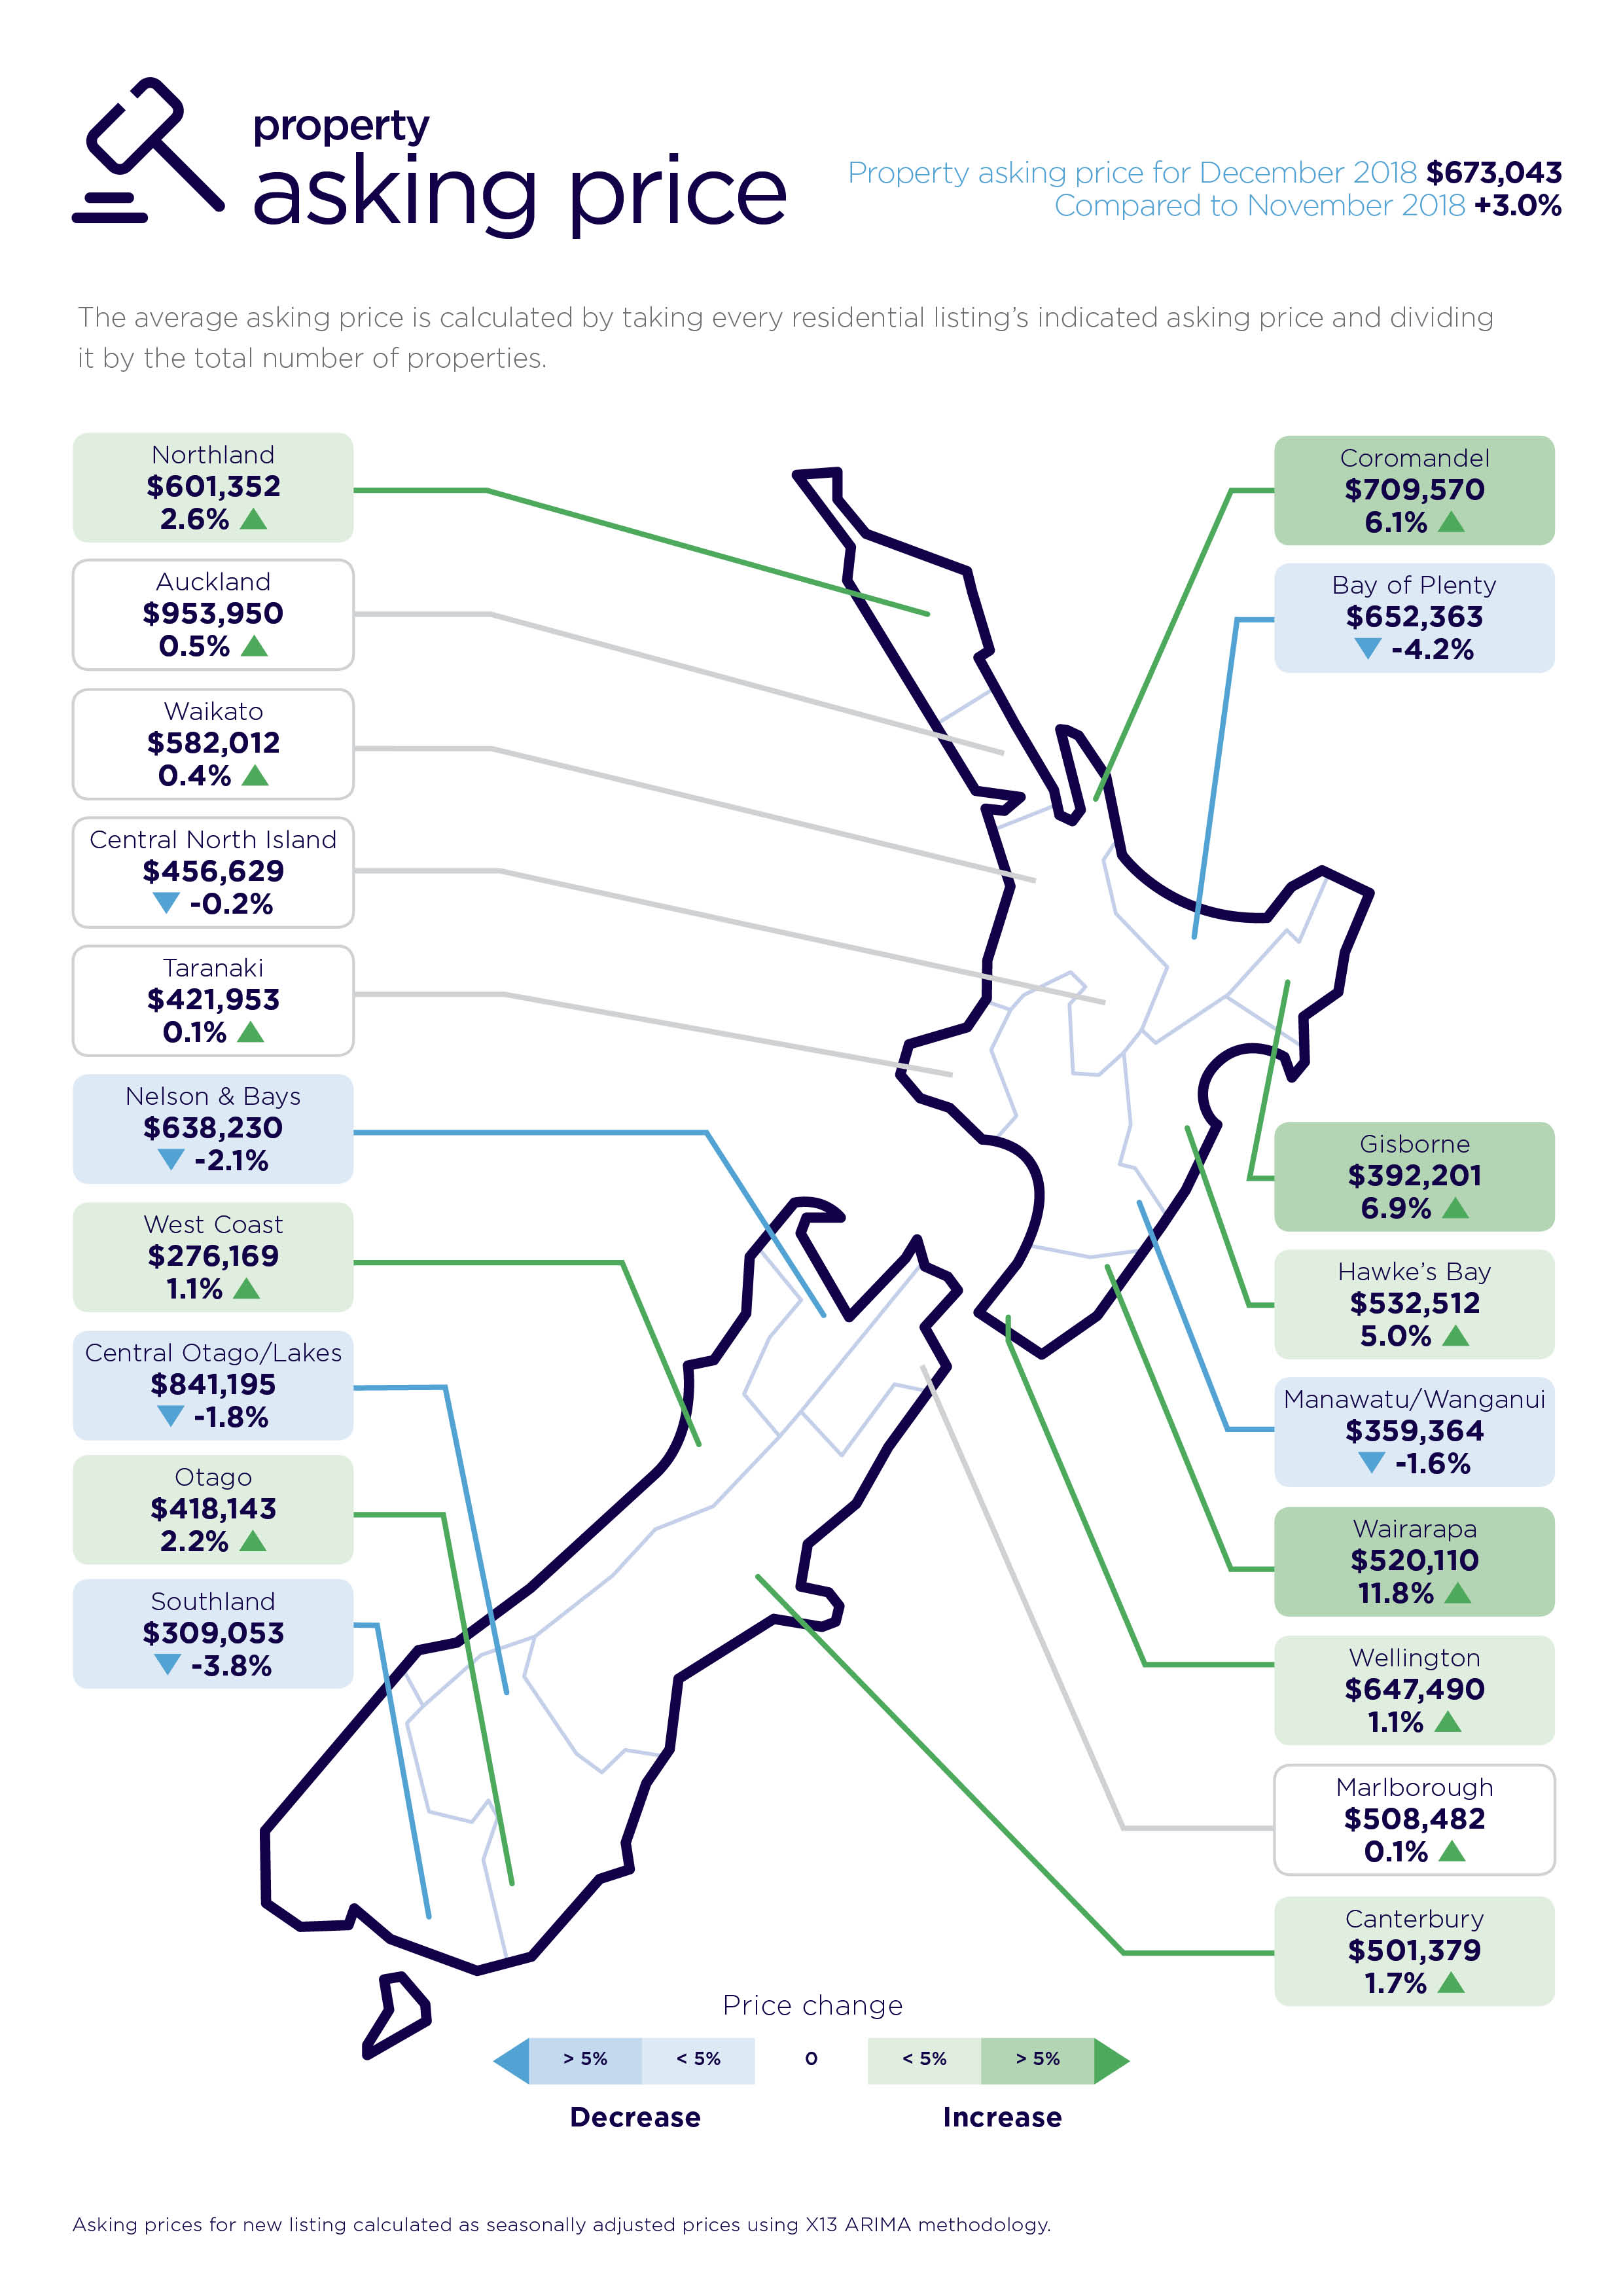
“In December 2018 the Auckland region’s average asking price of $953,950 represented a 2.9% fall compared to December 2017, but was a 0.5% increase on the previous month,” says Vanessa.
New property listings in December 2018 in the Auckland region were down 17.7% compared to December 2017 (1,569 properties).
Wellington’s record-breaking December and Otago hot on its heels
Two main regions, Wellington and Otago, recorded all-time high average asking prices and had an influence on the national average asking price.
The Wellington region’s record-breaking December reflects a classic supply and demand situation.
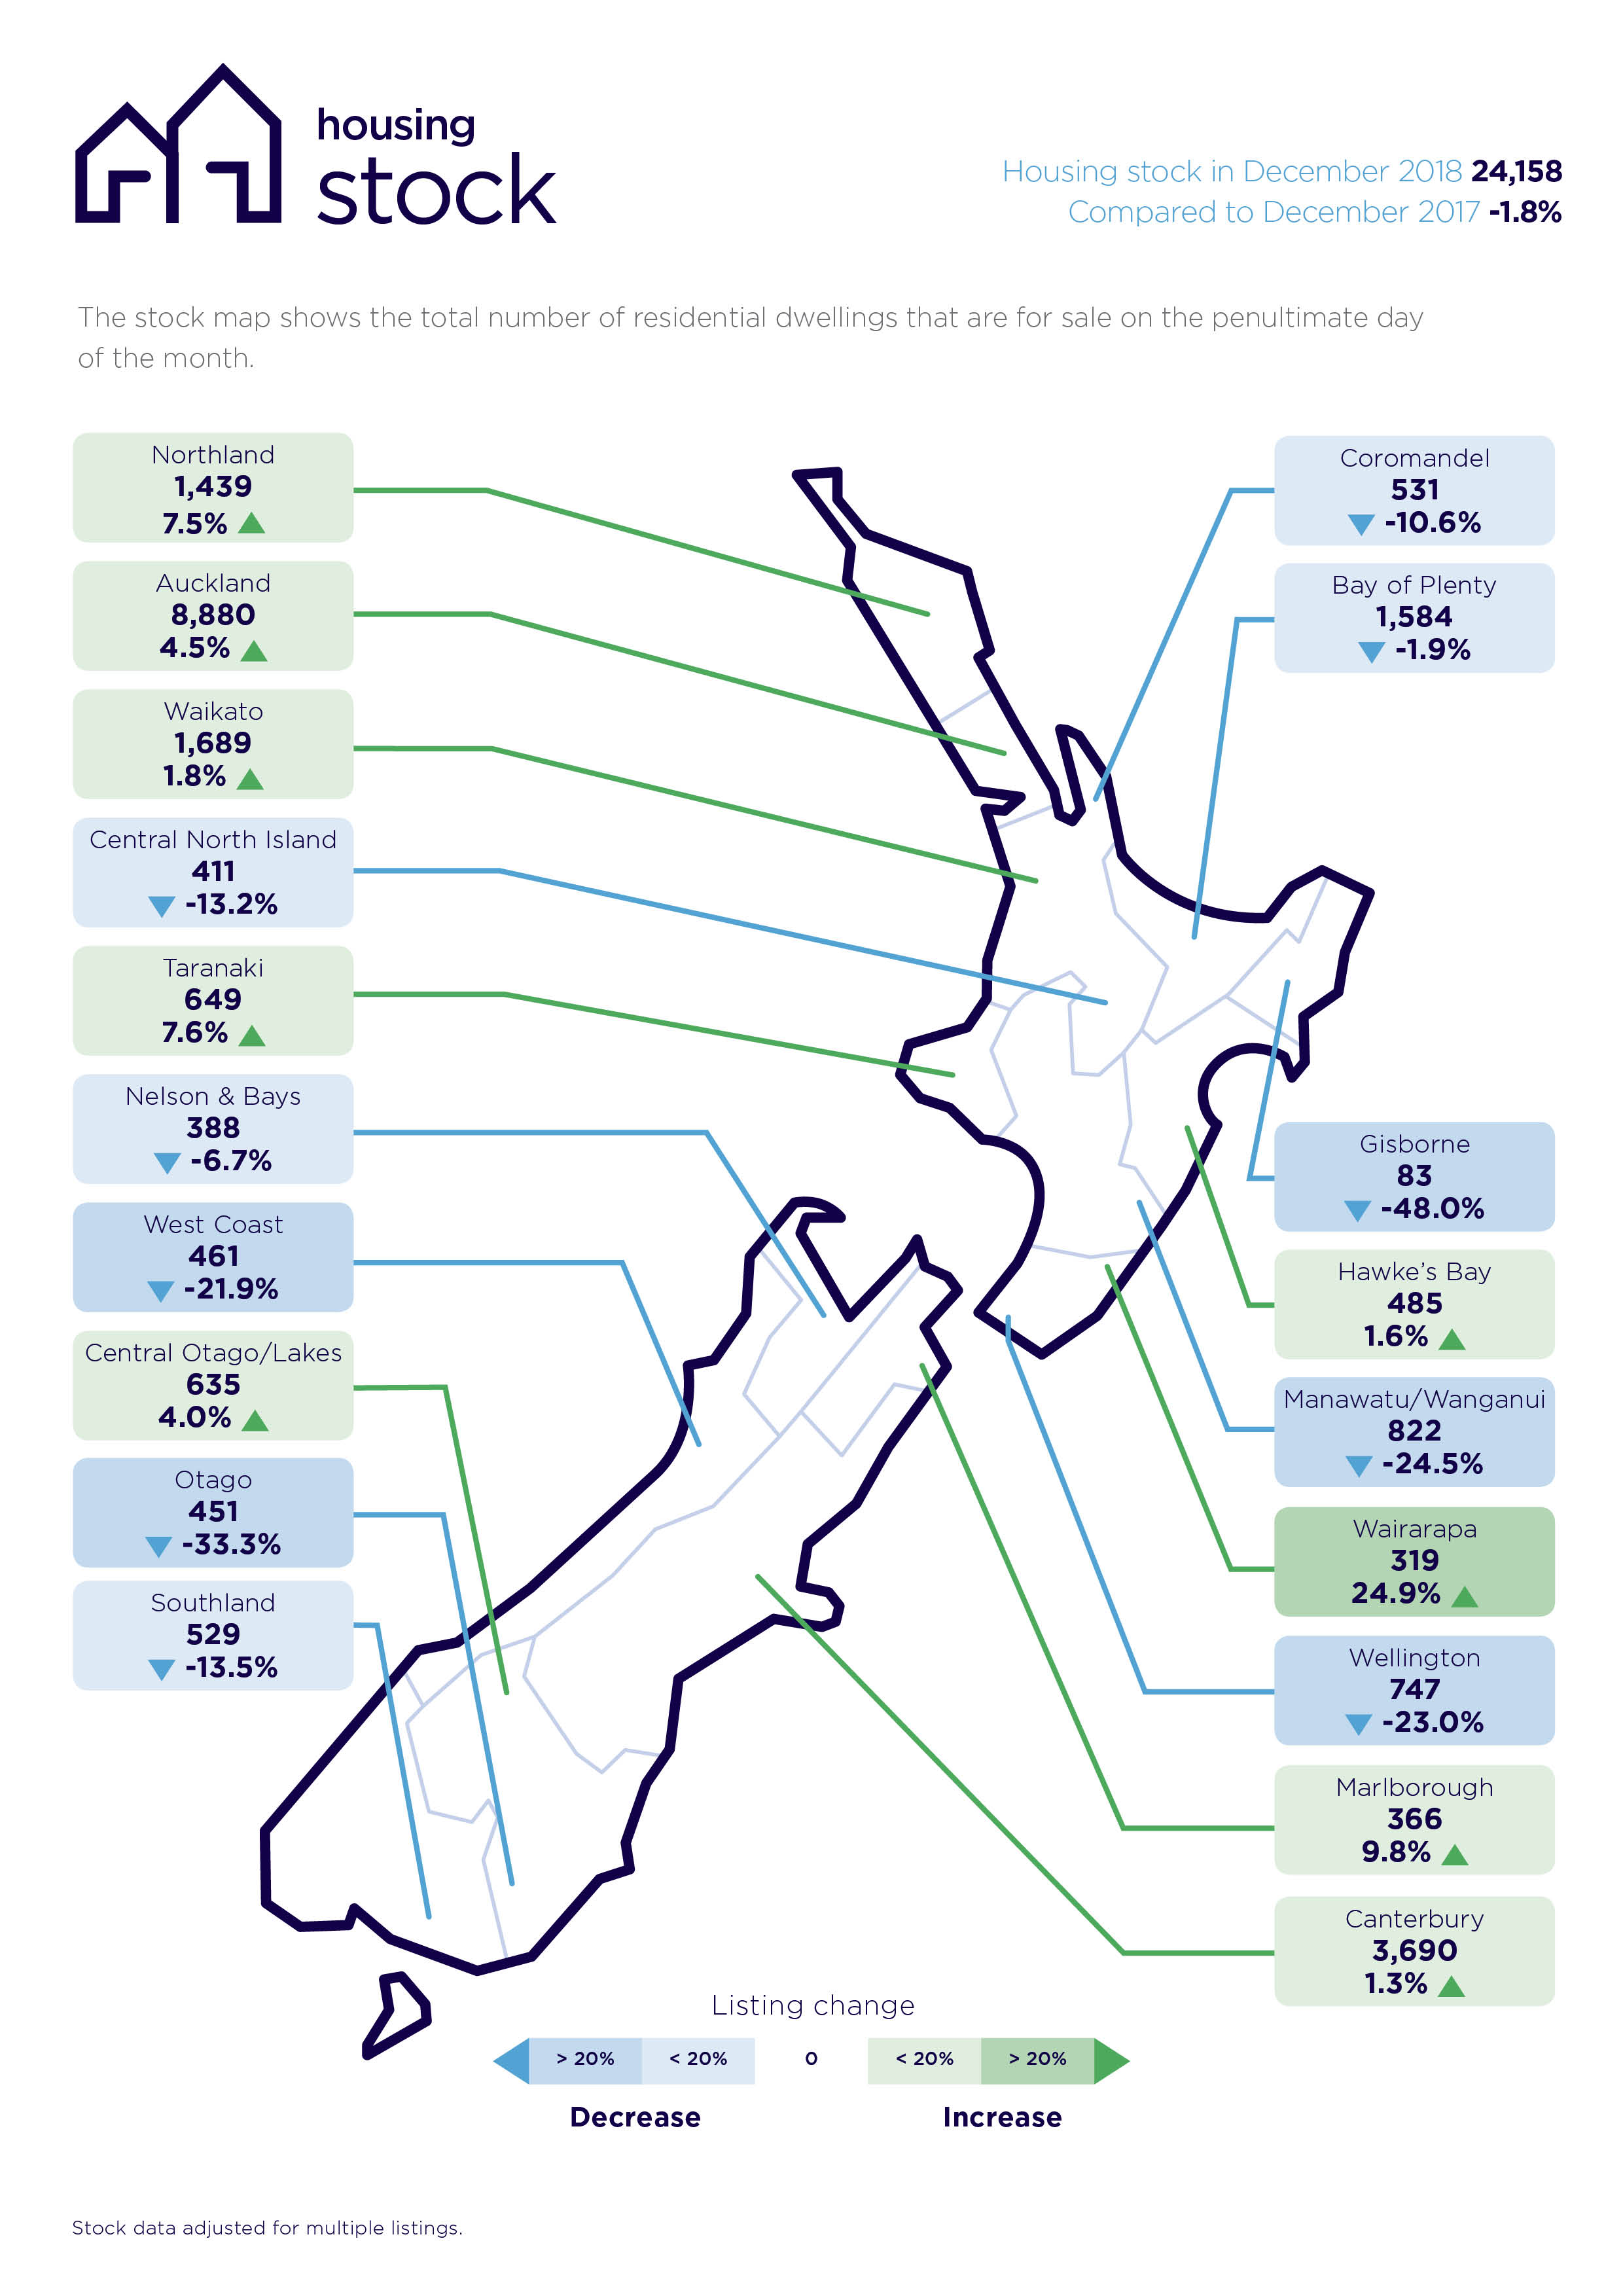
Since realestate.co.nz began collating statistics 11 years ago, in December 2018 the Wellington region recorded an all-time asking price high, the lowest level of new listings in any one month (December 2018), and an all-time low in the total number of homes for sale.
“The Wellington region has always been a relatively tight market, but this December was exceptional,” says Vanessa Taylor.
The number of new listings (282) in the region was down 23.6% compared to December 2017, while total stock (747 homes), was similarly down (23.0% compared to December 2017).
The average asking price in the Wellington region lifted 1.1% to $647,490 compared to November 2018.
“The relatively modest increase in asking prices in a tight market does offer opportunities for several scenarios, whether that’s to sell and buy in the same market, or to sell and move to another region within commuting distance, such as the Wairarapa,” says Vanessa.
The Otago region’s all-time asking price high was similarly modest. The average asking price lifted to $418,143, representing a 2.2% increase compared to November 2018.
Like Wellington, new listings were also well down on December 2017 in the Otago region, falling by 24.5% (194 new listings).
Lifts in average asking prices in Wairarapa, Gisborne, Northland, Coromandel and Hawke’s Bay regions
As would be expected, it was the hot summertime regions that largely featured in terms of average asking price increases in December 2018 (compared to November 2018).
Perhaps unsurprisingly, this was led by the Wairarapa region.
“The Wairarapa region is renown as a lifestyle area, including wineries, food, art galleries and scenery,” says Vanessa Taylor.
“It’s also one hour north of Wellington city by train or car and given the tightness of this region, we would expect people to look further afield to the Wairarapa,” she says.
For Kiwis searching in the Wairarapa region, the top places they were located was Wellington, Auckland and Hawke’s Bay, showing that the main interest in the Wairarapa was coming from outside of the region itself. The hottest suburb searched in the Wairarapa was Masterton.
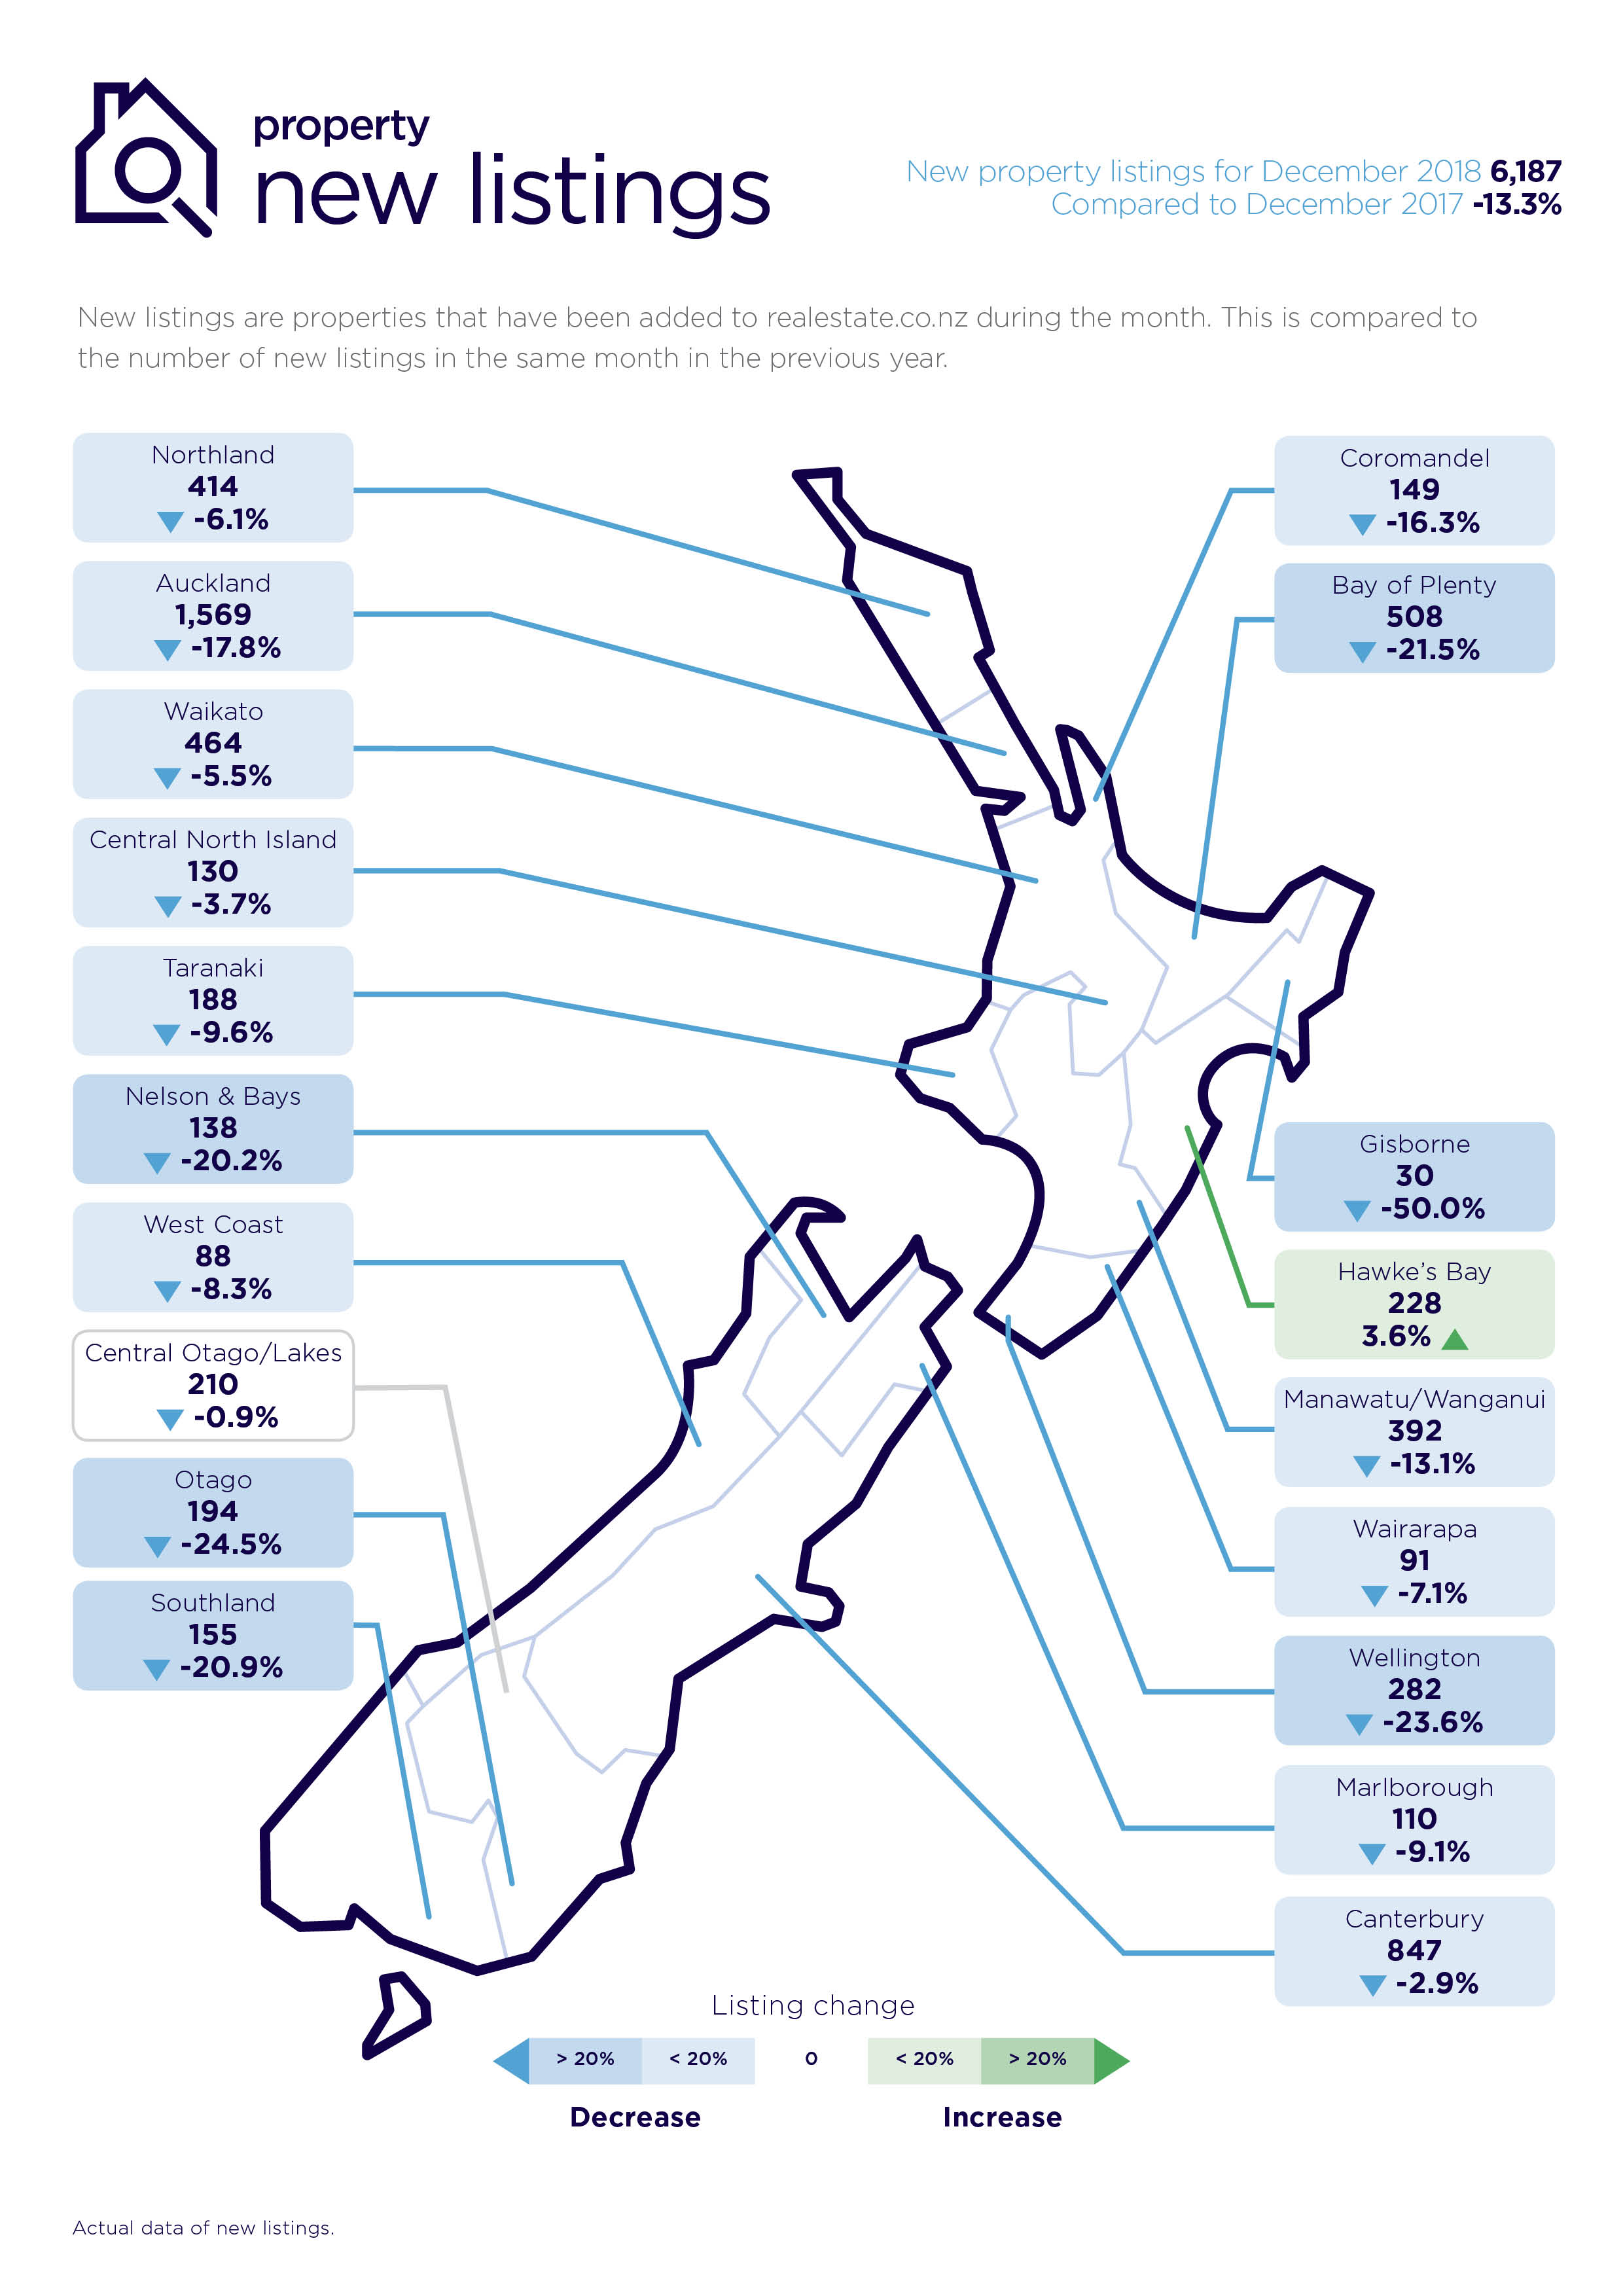
The total number of homes for sale in the Wairarapa region was up 24.9% in December (319 homes for sale) compared to December 2018. However, the number of new homes listed on the market in December 2018 dropped 7.1% compared to December 2017 (91 new listings).
In December the average asking price lifted by 11.8% (to $520,110) compared to the previous month.
Gisborne, Coromandel, Hawke’s Bay and Northland also all recorded increases in average asking prices.
Gisborne led with a 6.9% increase in asking price to $392,201 followed by the Coromandel (up 6.1% to $709,570), Hawke’s Bay (up 5.0% to $532,512) and Northland (up 2.6% to $601,352).
New listings down across the country
Nationally, new listings are down 13.3% compared to December 2017, representing 6,187 properties coming onto the market.
“This is not surprising, given that we had an early start to the spring/summer market this year with higher than normal levels of new listings in the prior three months,” says Vanessa Taylor.
While the Wellington and Otago regions led the drop in new listings compared to December 2017, they were closely followed by four regions with falls greater than 20.0%.
The regions were; Bay of Plenty (508 new listings, down 21.5%), Gisborne (30 new listings, down 50.0%), Nelson-Bays (138 new listings, down 20.2%) and Southland (155 new listings, down 20.9%).
For media enquiries, please contact:
Liz Holt, PPR T: 021 0426 590 E: liz.holt@ppr.co.nz
Glossary of terms:
As the only provider of real estate data in real time, realestate.co.nz offers valuable property market information not available from other sources.
- Average asking price is not a valuation. It is an indication of current market sentiment. Statistically, asking prices tend to correlate closely with the sales prices recorded in future months when those properties are sold. As it looks at different data, average asking prices may differ from recorded sales data released at the same time.
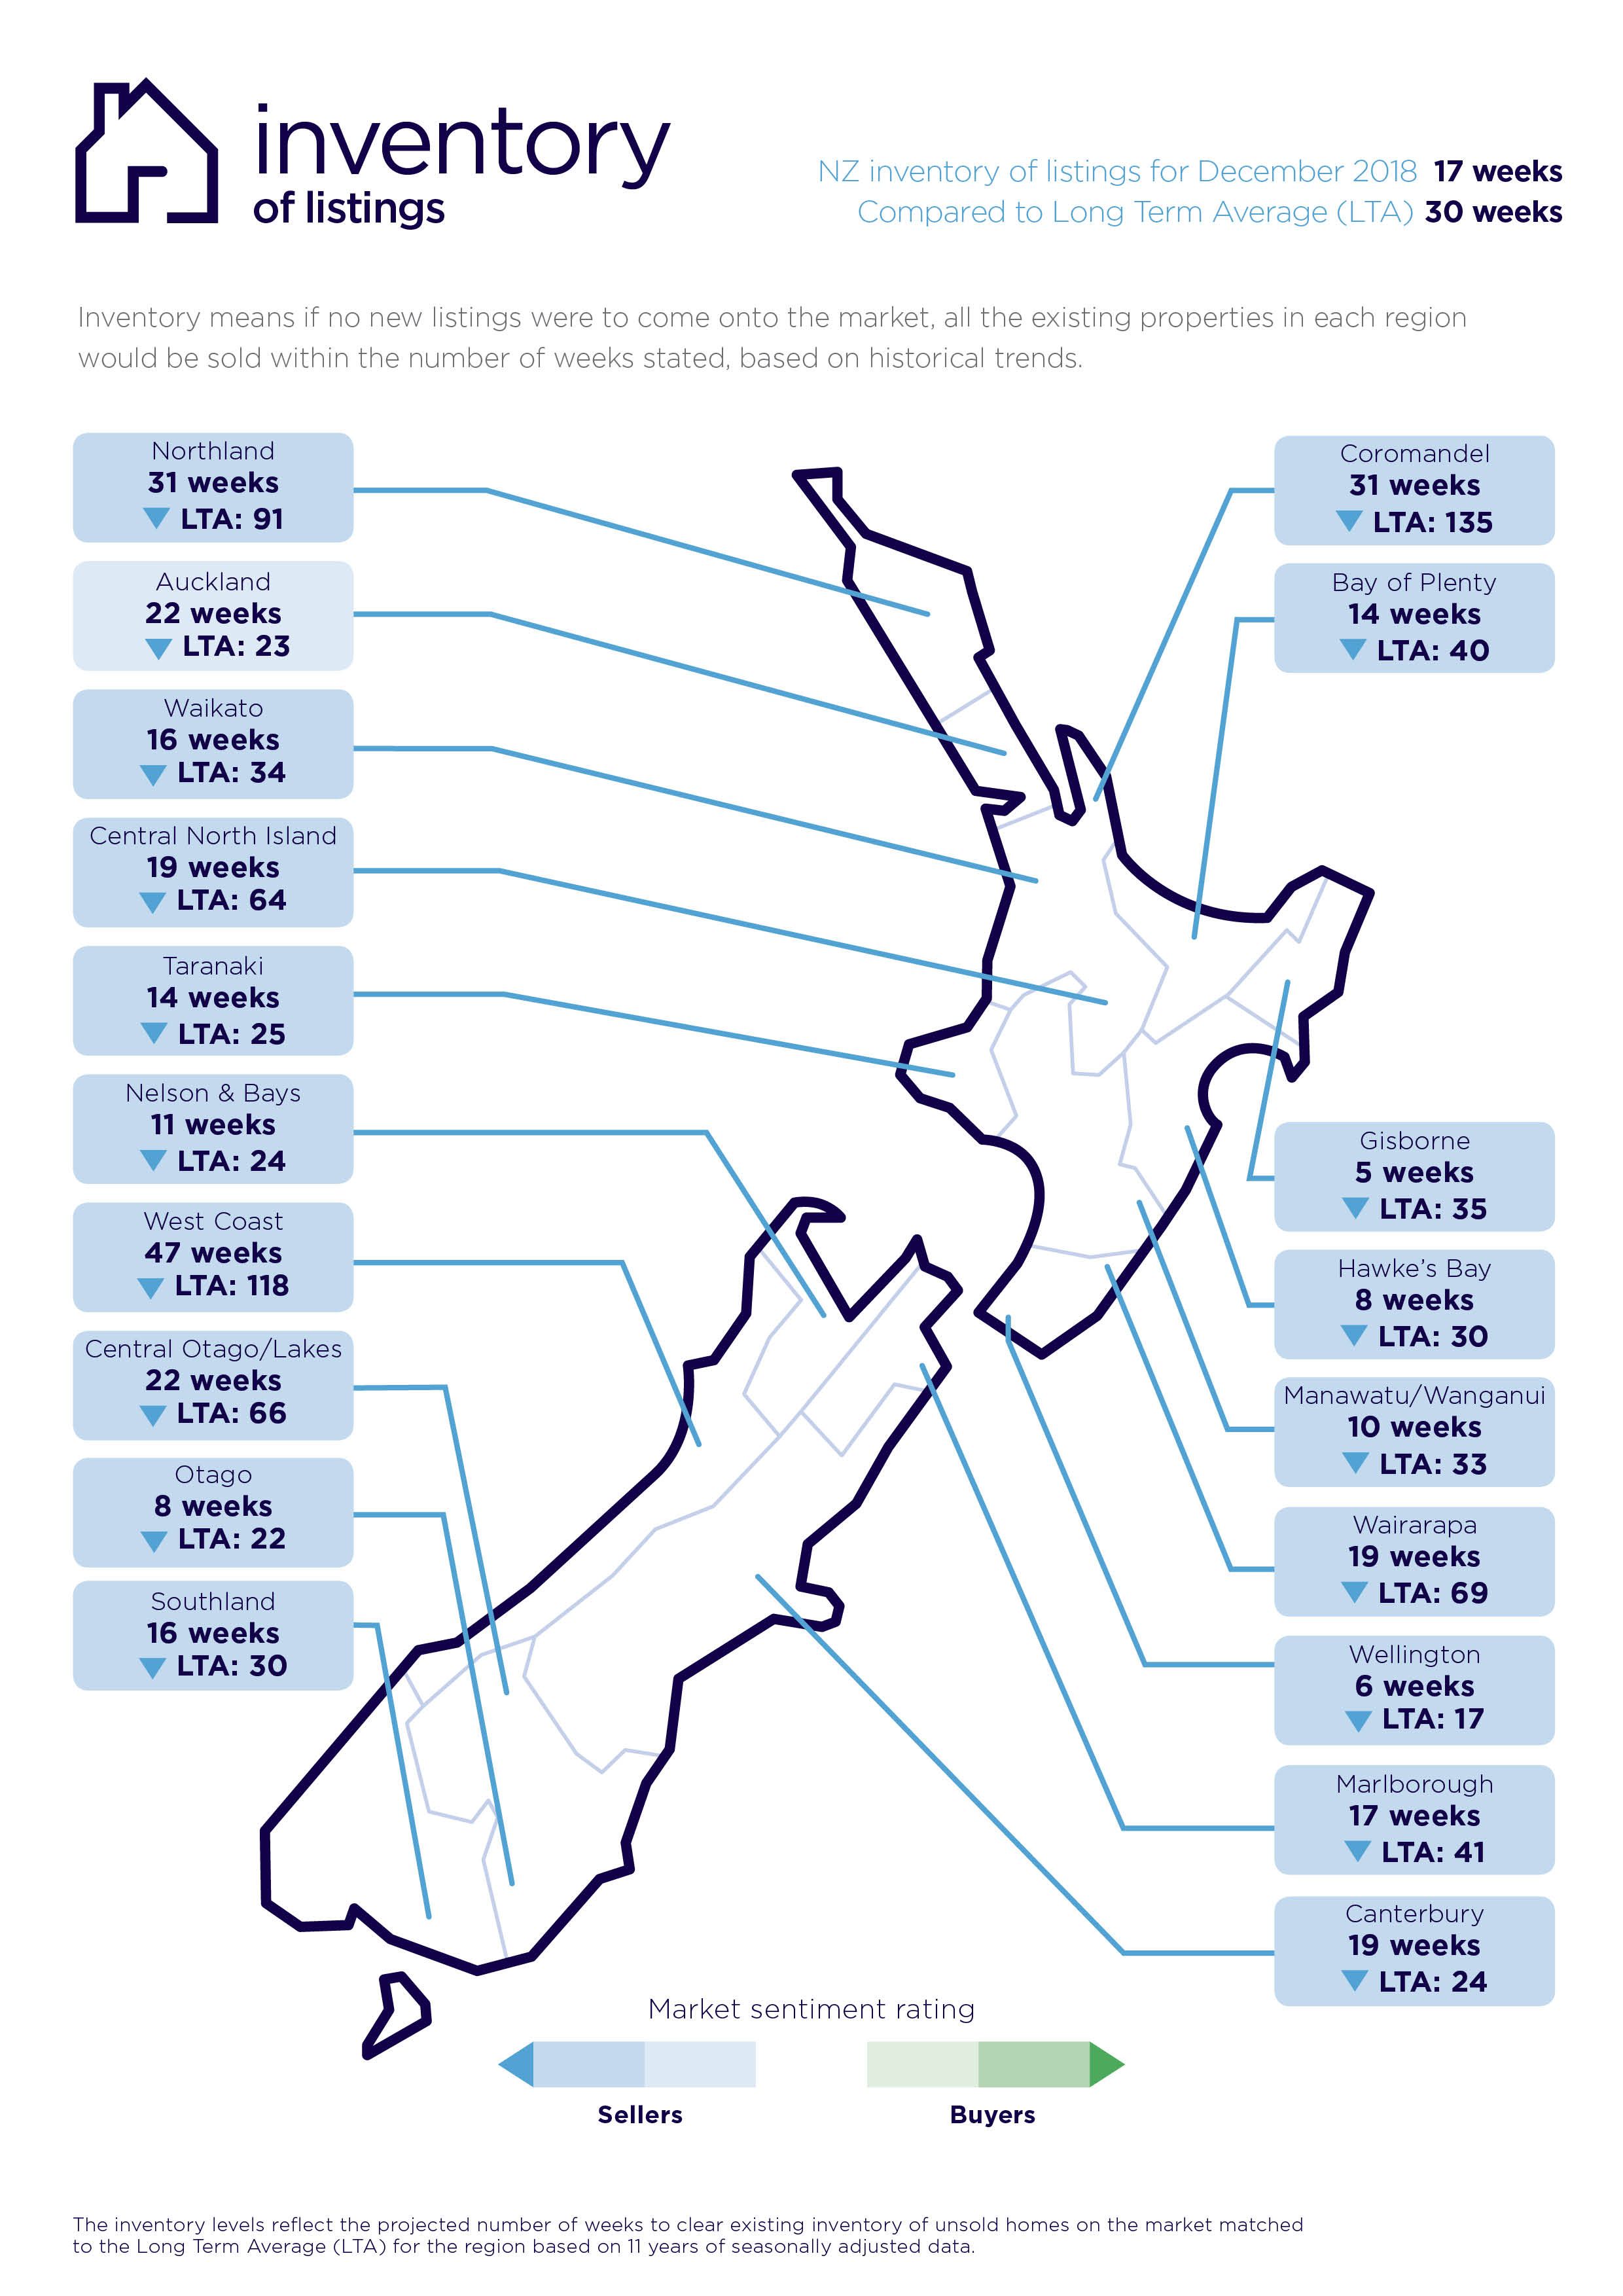
- Inventory is a measure of how long it would take, theoretically, to sell the current stock at current average rates of sale if no new properties were to be listed for sale. It provides a measure of the rate of turnover in the market.
- New listings are a record of all the new listings on realestate.co.nz for the relevant calendar month. As realestate.co.nz reflects 97% of all properties listed through registered estate agents in New Zealand, this gives a representative view of the New Zealand property market.
- Demand: the increase or decrease in the number of views per listing in that region, taken over a rolling three-month time frame, compared to the same three-month time frame the previous year – including the current month.
- Seasonal adjustment is a method realestate.co.nz uses to better represent the core underlying trend of the property market in New Zealand. This is done using methodology from the New Zealand Institute of Economic Research.
- Truncated mean is the method realestate.co.nz uses to provide statistically relevant asking prices. The top and bottom 10% of listings in each area are removed before the average is calculated, to prevent exceptional listings from providing false impressions.
Share
-
.svg)
.svg)
.svg)