
.svg)


Download the full New Zealand Property Report as a PDF.
Kiwi’s passion for property continues to soar. November marks the first full month of new legislation restricting foreign ownership, and Central Otago-Lakes loses its crown on asking prices to the Auckland region.
Real-time statistics from realestate.co.nz show New Zealander’s passion for property continues to soar, with 1,157,371 unique browsers active on the site during November.
“This is the highest level of visits to the site since March 2017,” says realestate.co.nz spokesperson Vanessa Taylor.
Two recent external property milestones did not appear to drive “more than usual” traffic to realestate.co.nz, she says.
“In the two days following last week’s Reserve Bank announcement, which gives the banks more flexibility around loan-to-value ratios (LVRs), traffic remained consistent with the rest of the month.”
The second milestone was the Overseas Investment Amendment Bill, which came into effect on 22 October, classifying residential land as “sensitive”. In general, it means that existing homes can only be bought by New Zealanders and residence-class visa holders who have spent the majority of their time in New Zealand. Australian and Singaporean citizens are also eligible.
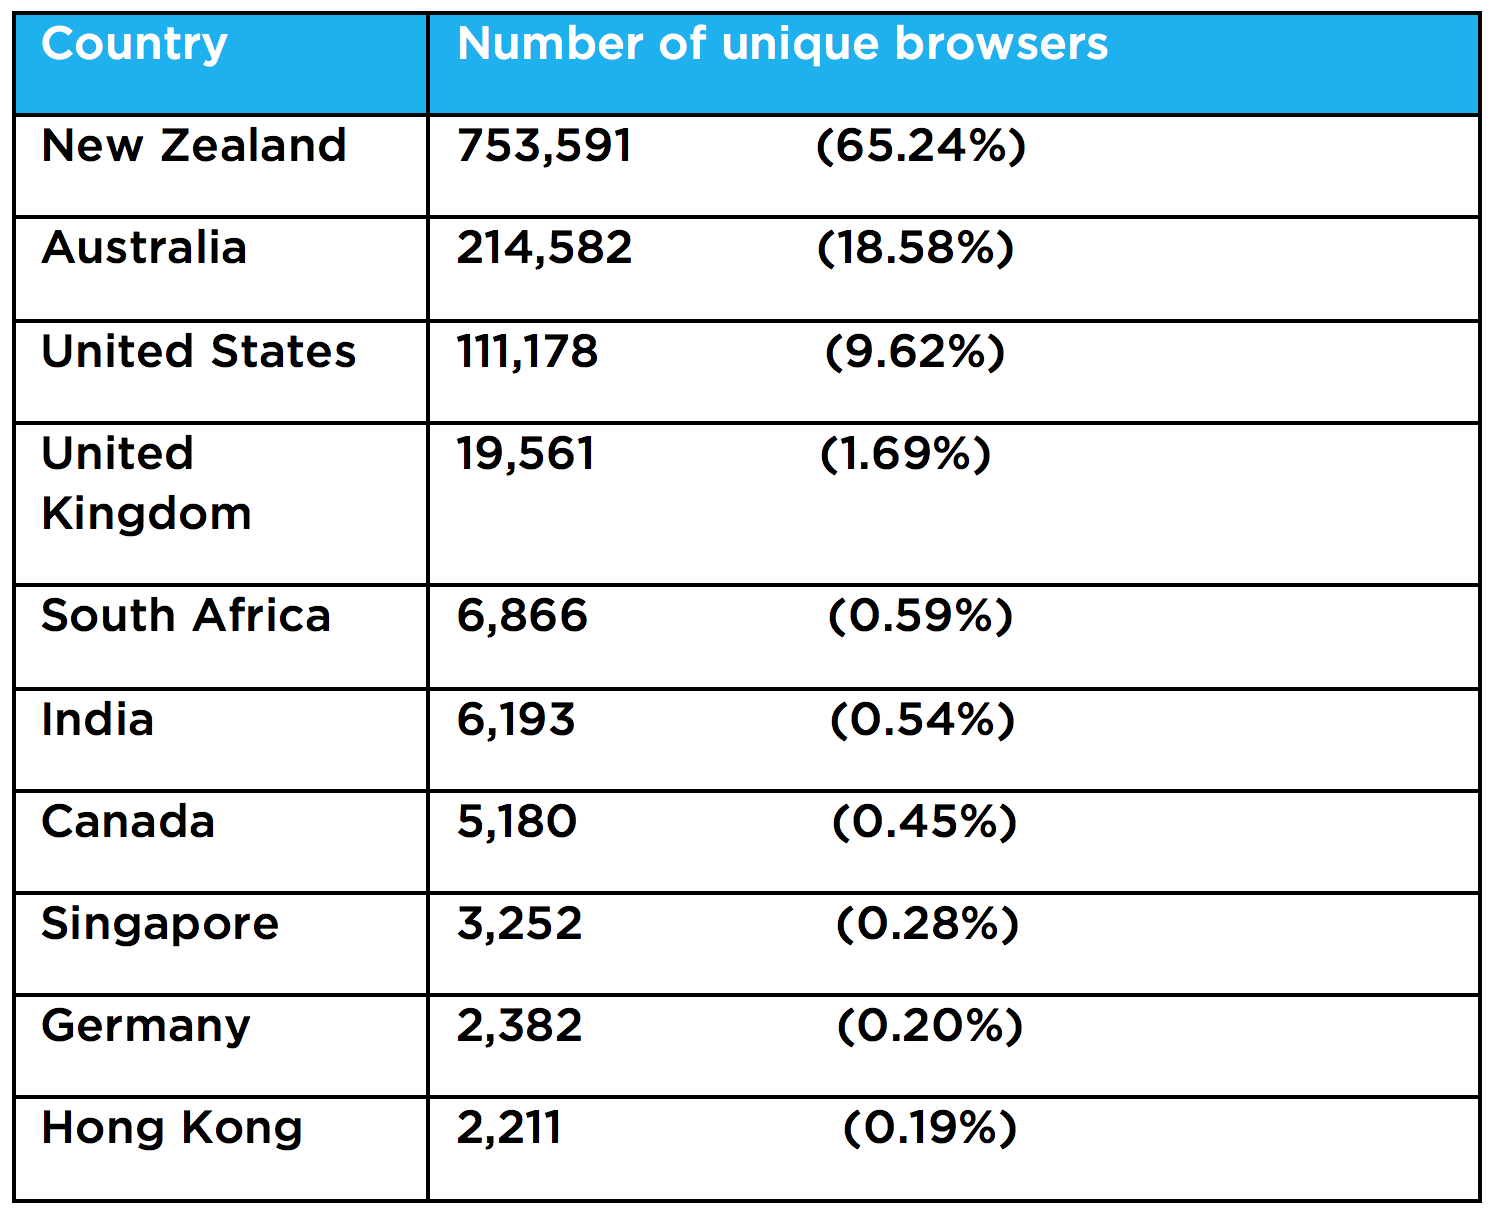
Users of the site who resided from within New Zealand accounted for 65.2% of traffic during November. In terms of international visitors, Australian browsers were the second largest group to search on realestate.co.nz (18.6%), followed by the US (9.6%). There is no evidence to suggest that interest has dropped or lifted specifically as a result of the Bill coming into effect.
“While Australia and the US account for 28.2% of all unique browsers to our site, there’s a relatively small of international visitors from all other countries (less than 7.0%) making up the balance,”* says Vanessa.
Central Otago-Lakes District loses top asking price position to Auckland region
The Central Otago-Lakes District may well be the first region to feel the impact of the Overseas Investment Amendment Bill, either directly or indirectly.
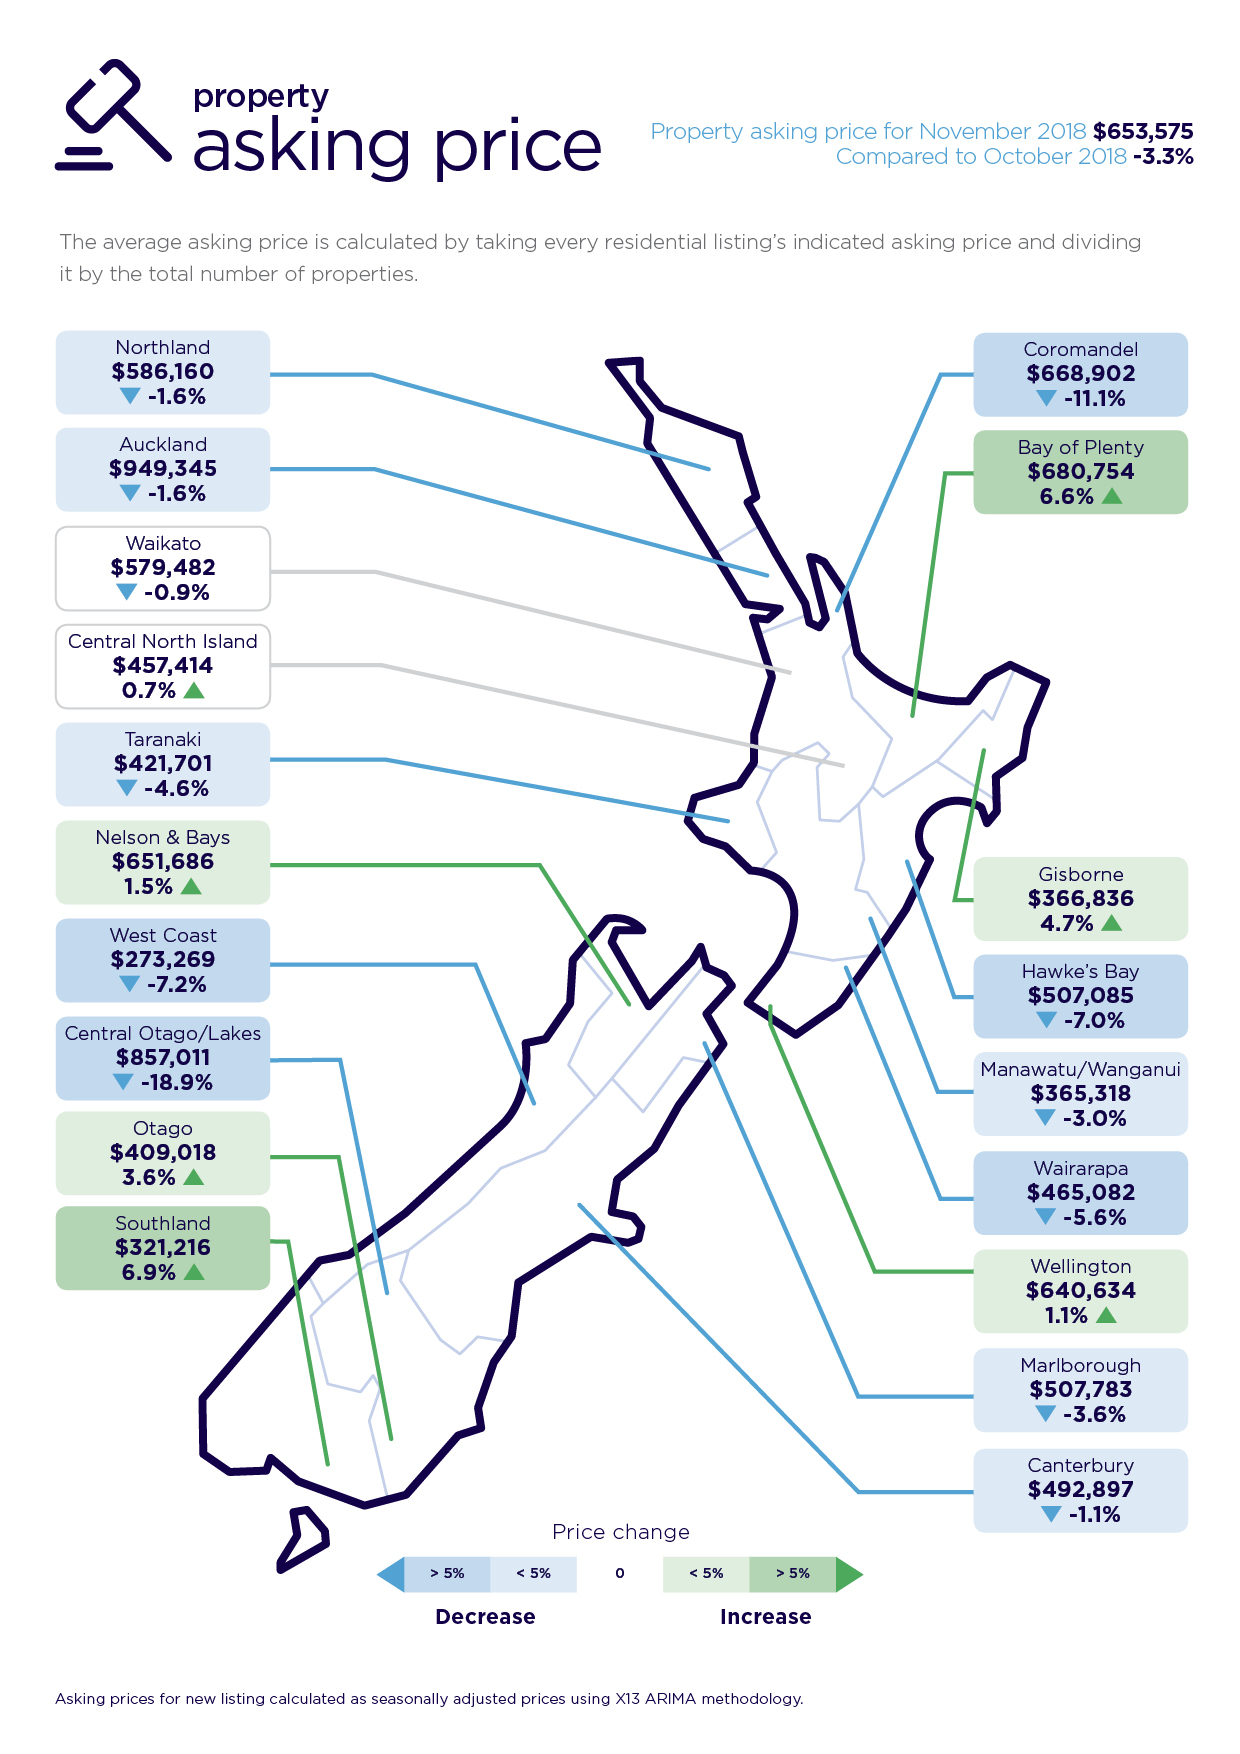
The region’s average asking price in November fell to $857,011, representing an 18.9% fall compared to the previous month.
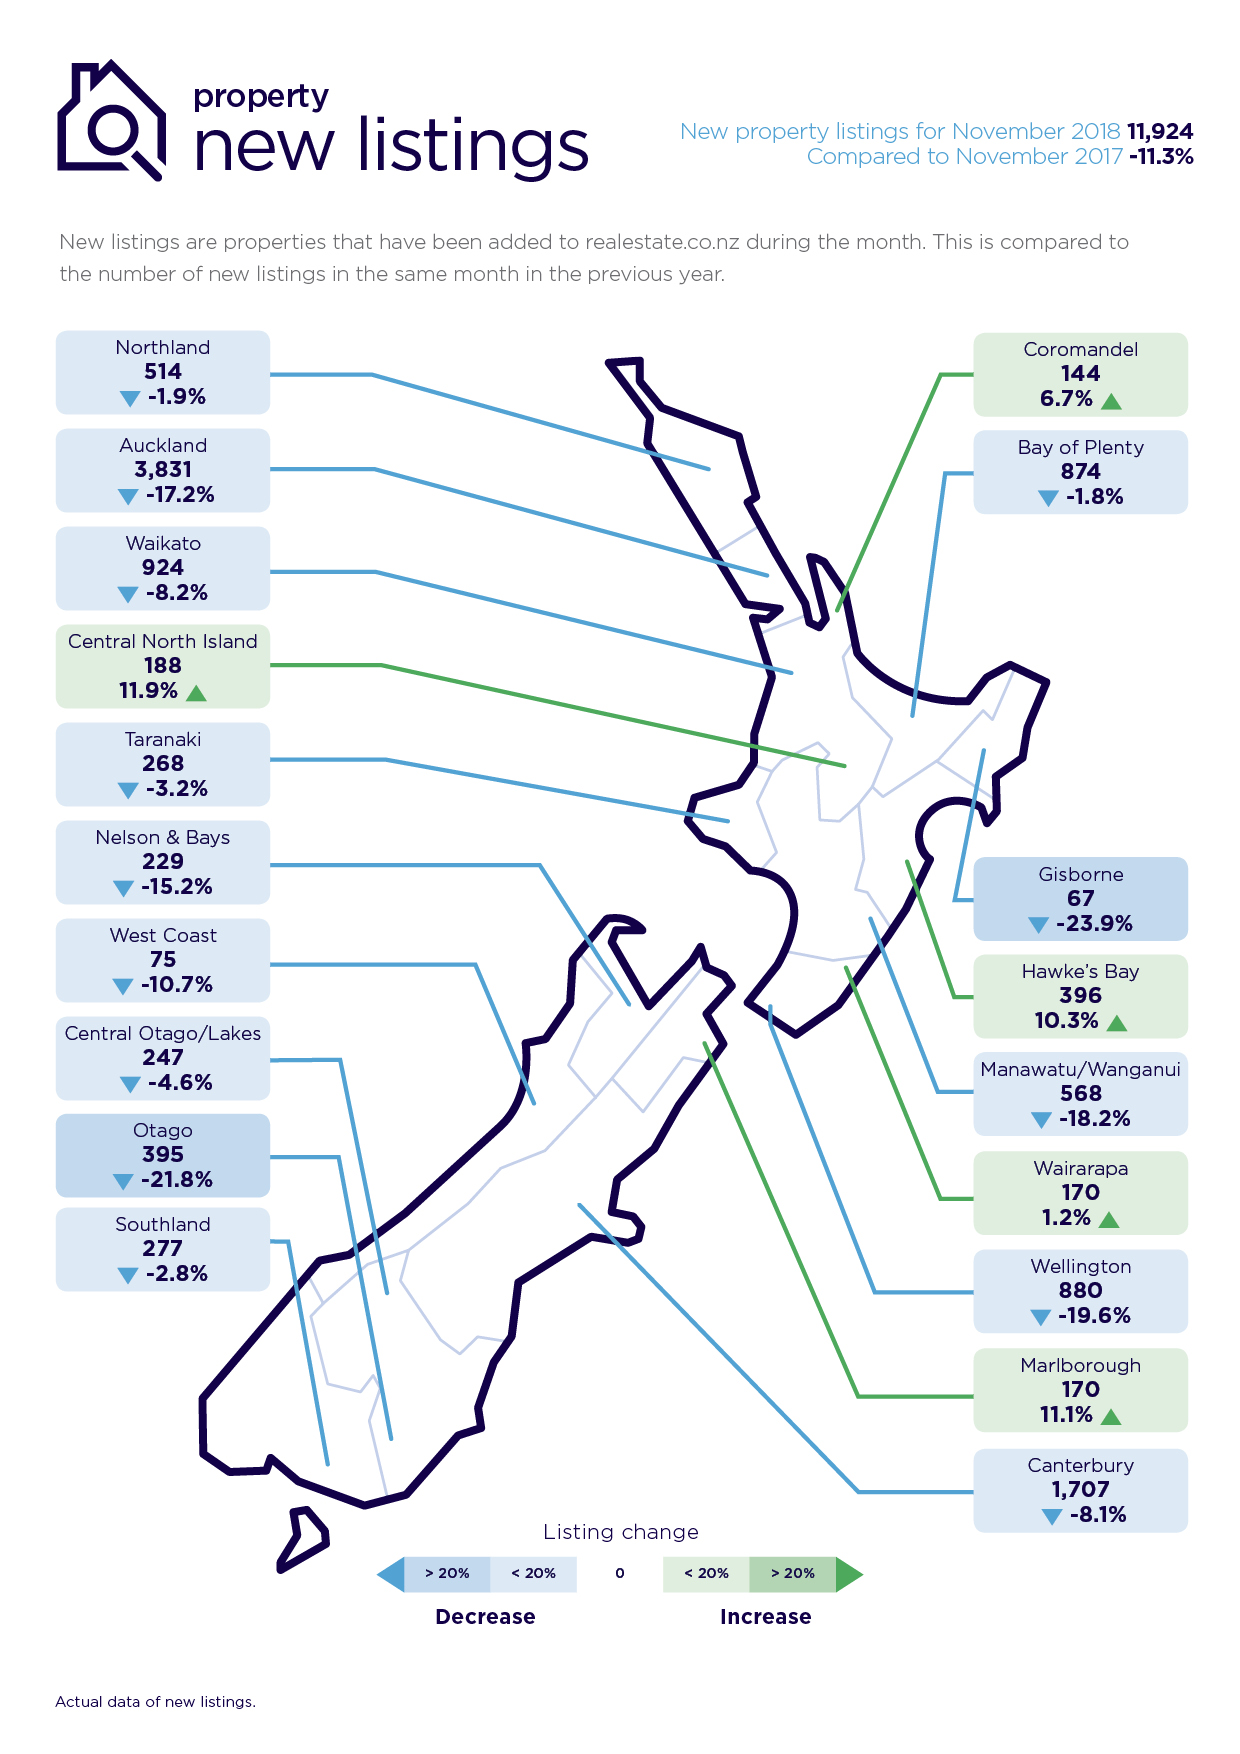
New listings fell by 4.6% in November (247 listings).
This is compared to 236 new property listings in October, which were at the much higher average asking price of $1,057,019.
“It was back in August this year that Central Otago-Lakes took the crown off Auckland as the region with the most expensive average asking price.
“It could be that in the run up to the new legislation there was an influx of top end properties that owners were eager to get across the sold line. Or they were testing the market and would have been open to a sale at the right price.
“Now that the foreign ownership window has largely been closed, they may well have sold the property or taken it off the market either to retain, or to consider other options in the future” says Vanessa.
“Time will tell what it means for the Central Otago-Lakes District.”
In the meantime, the Auckland region average asking price remains under the one million dollar mark, standing at $949,345 in November, which is 1.6% lower compared to the previous month.
“The Auckland average asking price has sat around the $950,000 mark all year and it’s positive to see the region remaining so stable,” she says.
Nationally, the average asking price in November stood at $653,575, which is a 3.3% decrease on the previous month.
“While there has been some regional variances this year, nationally we have seen a relatively stable asking price environment, with average asking prices sitting around the $650,000 mark during 2018.”
Spring the new summer for Auckland region
Following a massive lift in new listings in October (20.1% increase compared to October 2017), it’s no surprise that the Auckland region dominated property search terms on the site in November, says Vanessa.
“We had a really good start to spring and Aucklanders were making the most of it by putting their properties online early to maximise selling opportunities before the festive season,” says Vanessa.
“Effectively the Auckland region was a month ahead of the traditional start to the summer market and as a consequence this meant we saw fewer new listings in November.
“While the Auckland region registered a 17.2% drop in new listings in November compared to November 2017, the boost of new listings in October has resulted in a positive net effect when the two months are considered collectively.”
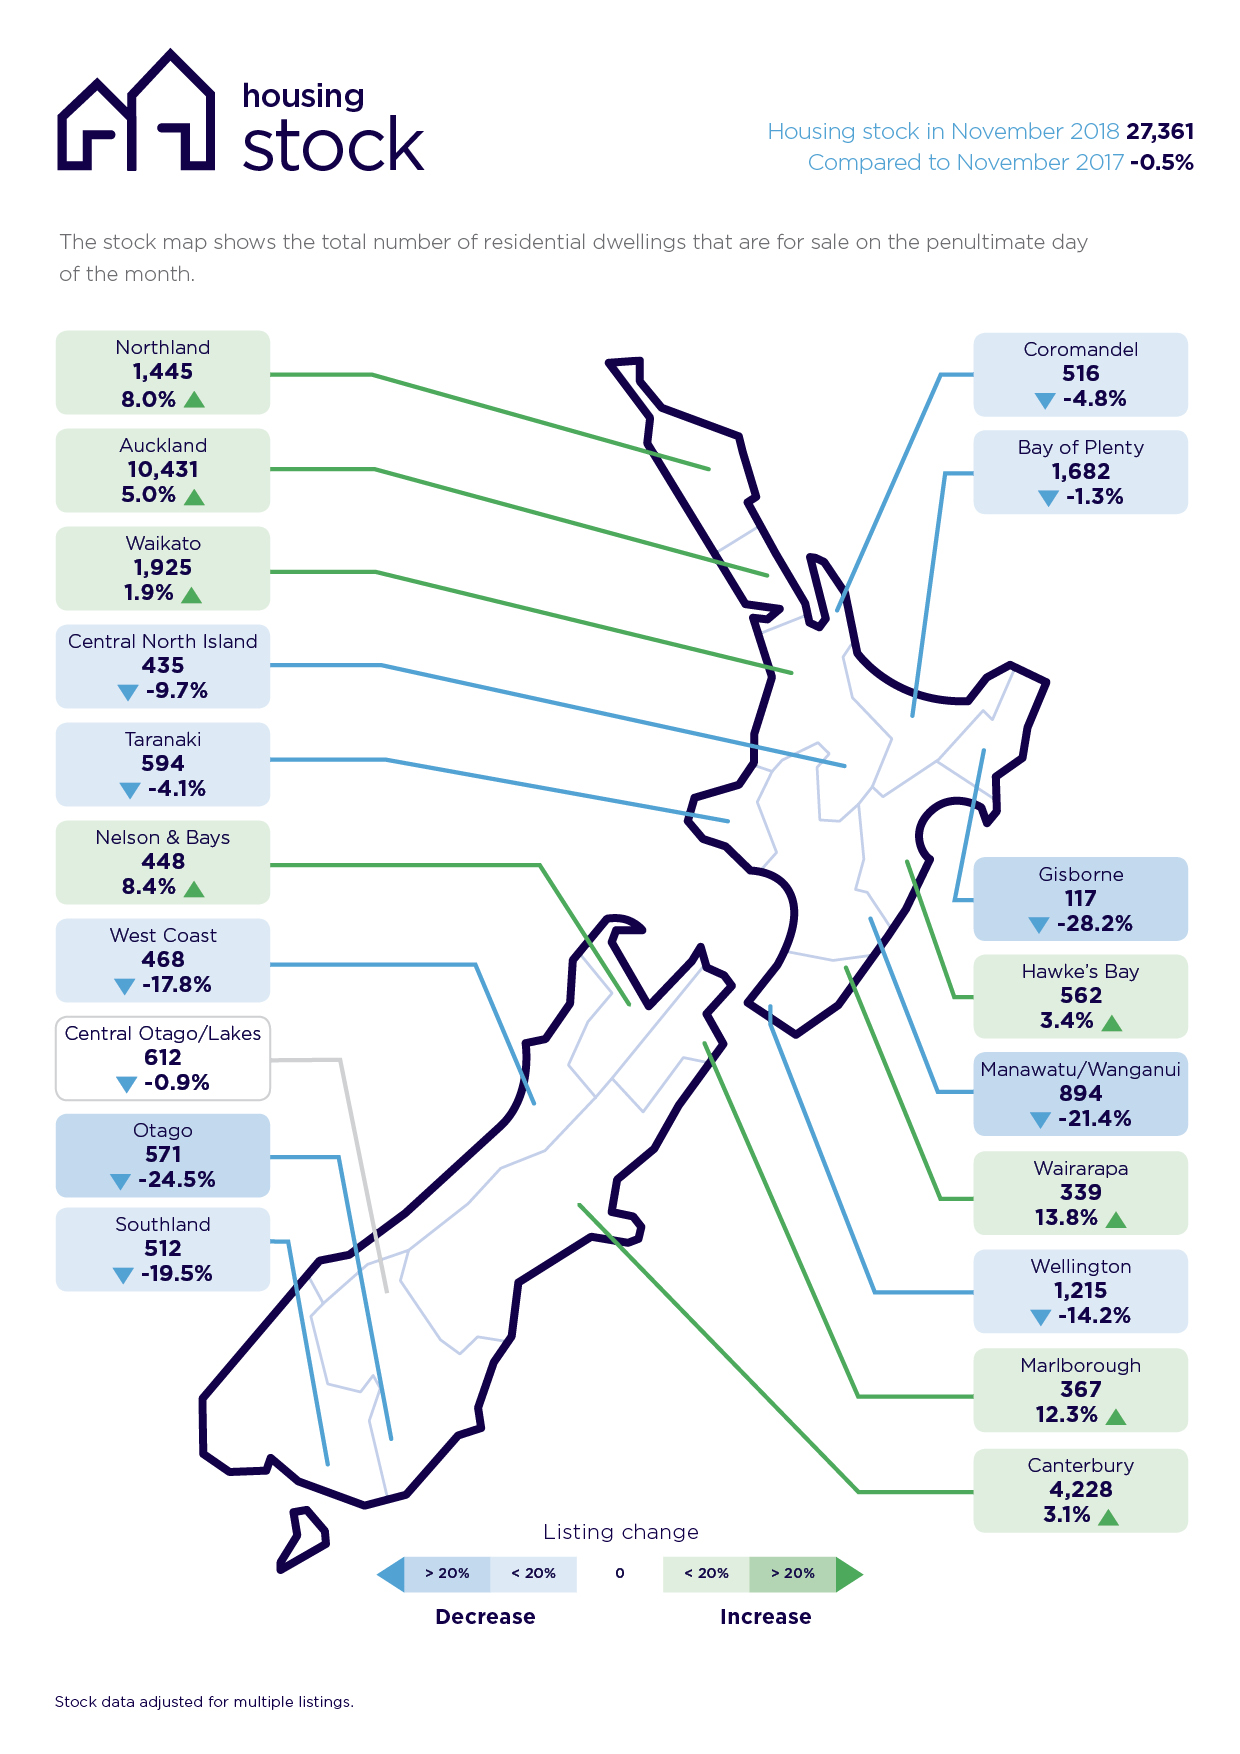
The total number of homes on the market in Auckland in November is up 5.0% compared to November 2017, representing 10,431 homes to choose from.
“Overall, when we look at the two months together, the net outcome is that there is more choice for property seekers,” says Vanessa.
All time asking price highs in Bay of Plenty, Nelson & Bays and Southland. Main regions relatively static.
While the main regions remained relatively static on average asking prices, three regional areas reached all-time asking price highs.
The Southland region led with a 6.9% increase in the average asking price compared to the prior month, to $321,216. This was followed by the Bay of Plenty (up 6.6% to $680,754) and Nelson & Bays (up 1.5% to $651,686).
Looking at the four main regions, property asking prices in the Auckland region fell in November by 1.6% to $949,345 compared to the prior month.
The Wellington and Canterbury regions were a mirror image, with Wellington’s average asking price rising 1.1% (to $640,634) while the Canterbury region fell by 1.1% (to $492,897).
The Waikato region, which registered a record asking price in October ($584,755), remained static in November, registering less than a one per cent fall in asking price (down 0.9%) to an average asking price of $579,482.
Asking price corrections in Hawke’s Bay, Marlborough and Manawatu/Wanganui regions
Three of the four regions which registered all-time asking price highs in October (Hawke’s Bay, Marlborough and Manawatu/Wanganui) came back to earth with asking price decreases in November.
“The Hawke’s Bay and Marlborough regions are known for their lifestyle benefits, particularly in summer and all three regions are coastal, but perhaps they went out early with an optimistic view in September,” says Vanessa Taylor.
The November average asking price in the Hawke’s Bay region fell 7.0% compared to the previous month to $507,085. In the Marlborough region, average asking prices fell 3.6% to $507,783 and the Manawatu/Wanganui region fell 3.0% to $365,318 compared to October.
For media enquiries, please contact:
Alex Dudley, PPR T: 027 5399 555 E: alex.dudley@ppr.co.nz
*Search by country of origin
Glossary of terms:
As the only provider of real estate data in real time, realestate.co.nz offers valuable property market information not available from other sources.
• Average asking price is not a valuation. It is an indication of current market sentiment. Statistically, asking prices tend to correlate closely with the sales prices recorded in future months when those properties are sold. As it looks at different data, average asking prices may differ from recorded sales data released at the same time.
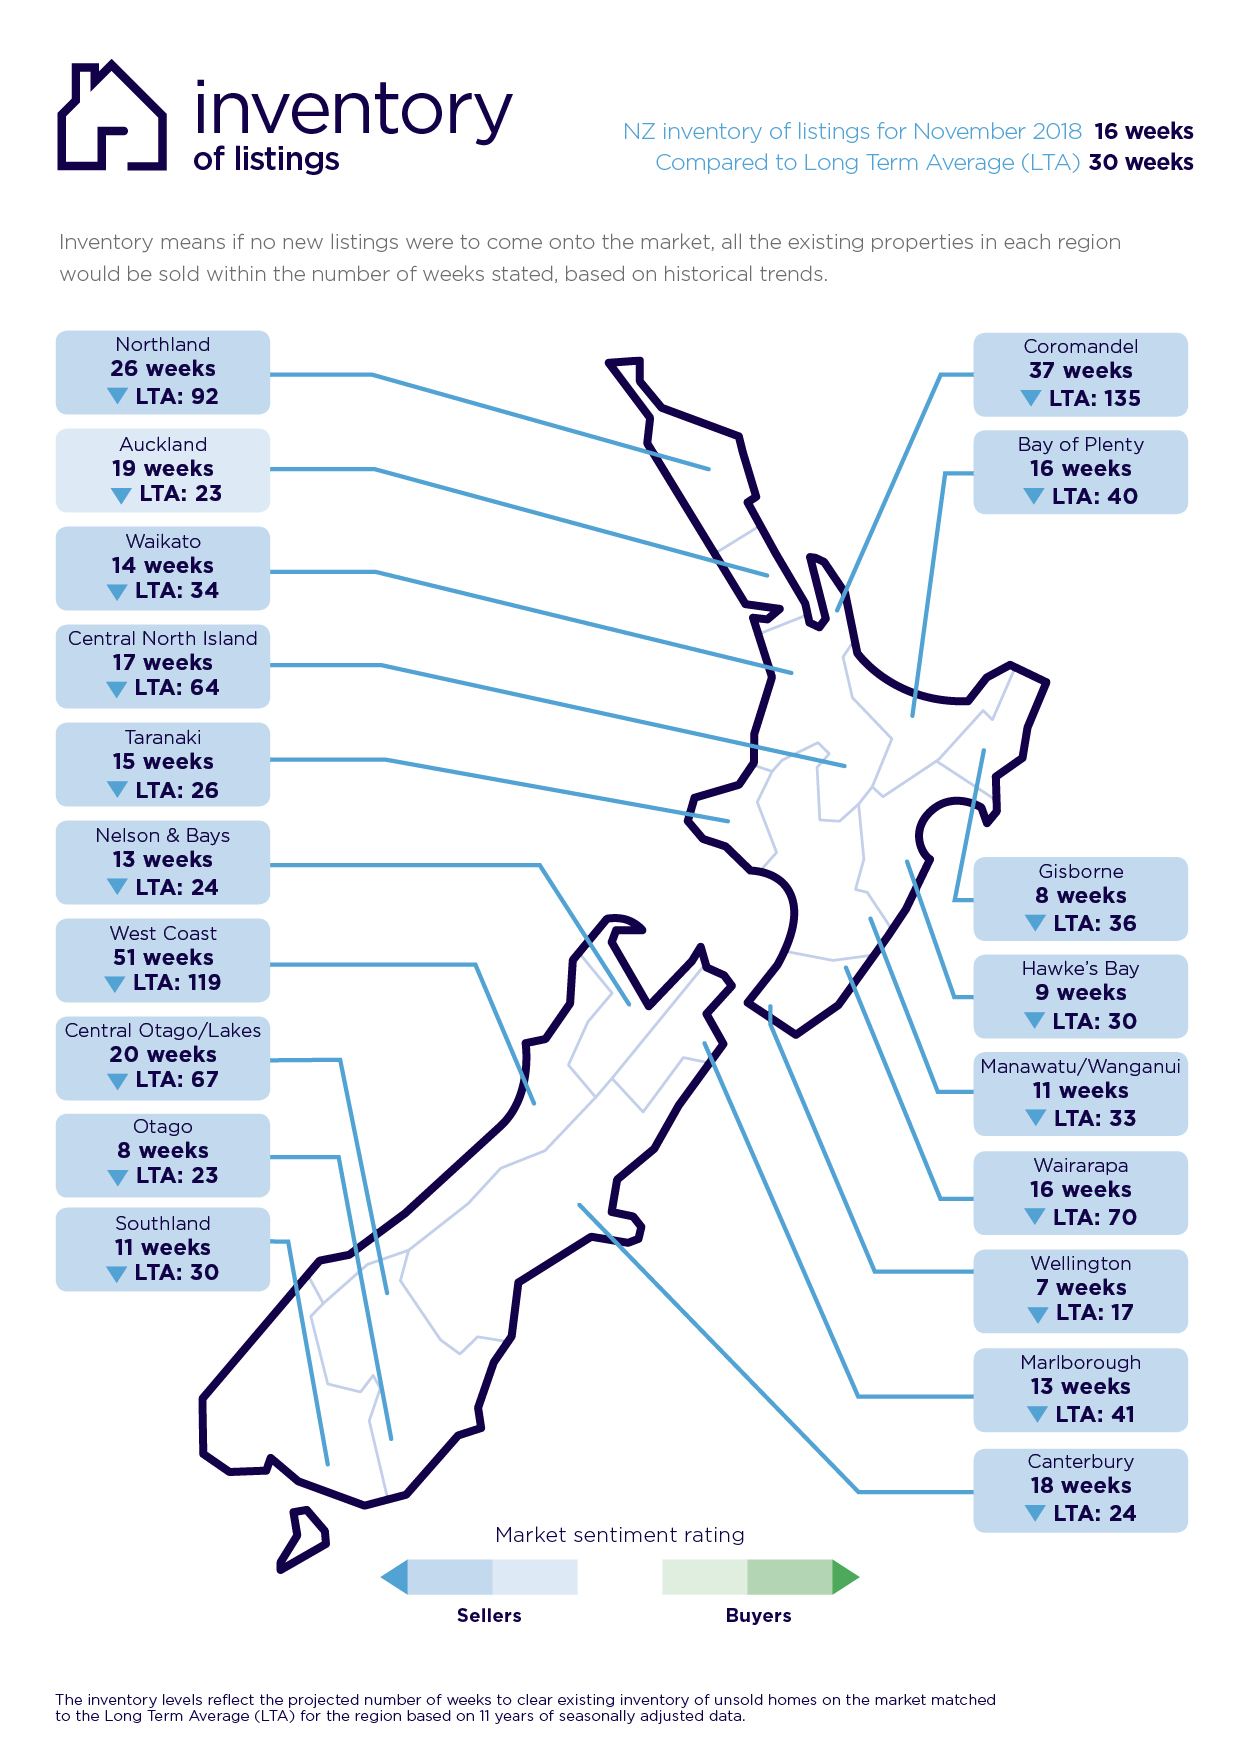
• Inventory is a measure of how long it would take, theoretically, to sell the current stock at current average rates of sale if no new properties were to be listed for sale. It provides a measure of the rate of turnover in the market.
• New listings are a record of all the new listings on realestate.co.nz for the relevant calendar month. As realestate.co.nz reflects 97% of all properties listed through registered real estate agents in New Zealand, this gives a representative view of the New Zealand property market.
• Demand: the increase or decrease in the number of views per listing in that region, taken over a rolling three-month time frame, compared to the same three-month time frame the previous year – including the current month.
• Seasonal adjustment is a method realestate.co.nz uses to better represent the core underlying trend of the property market in New Zealand. This is done using methodology from the New Zealand Institute of Economic Research.
• Truncated mean is the method realestate.co.nz uses to provide statistically relevant asking prices. The top and bottom 10% of listings in each area are removed before the average is calculated, to prevent exceptional listings from providing false impressions.
Share
-
.svg)
.svg)
.svg)