
.svg)


Download the full New Zealand Property Report as a PDF.
More certainty in the New Zealand property market compared to Australia this February. The smaller regions dominate new asking price highs across the country.
“The New Zealand property market is in a good place and there’s a sense of relative stability during the month of February”, says realestate.co.nz spokesperson Vanessa Taylor.
“Unlike the Australian situation, where there’s reportedly a long-term high in the number of properties sitting on the market, that’s not the case here in New Zealand,” she says.
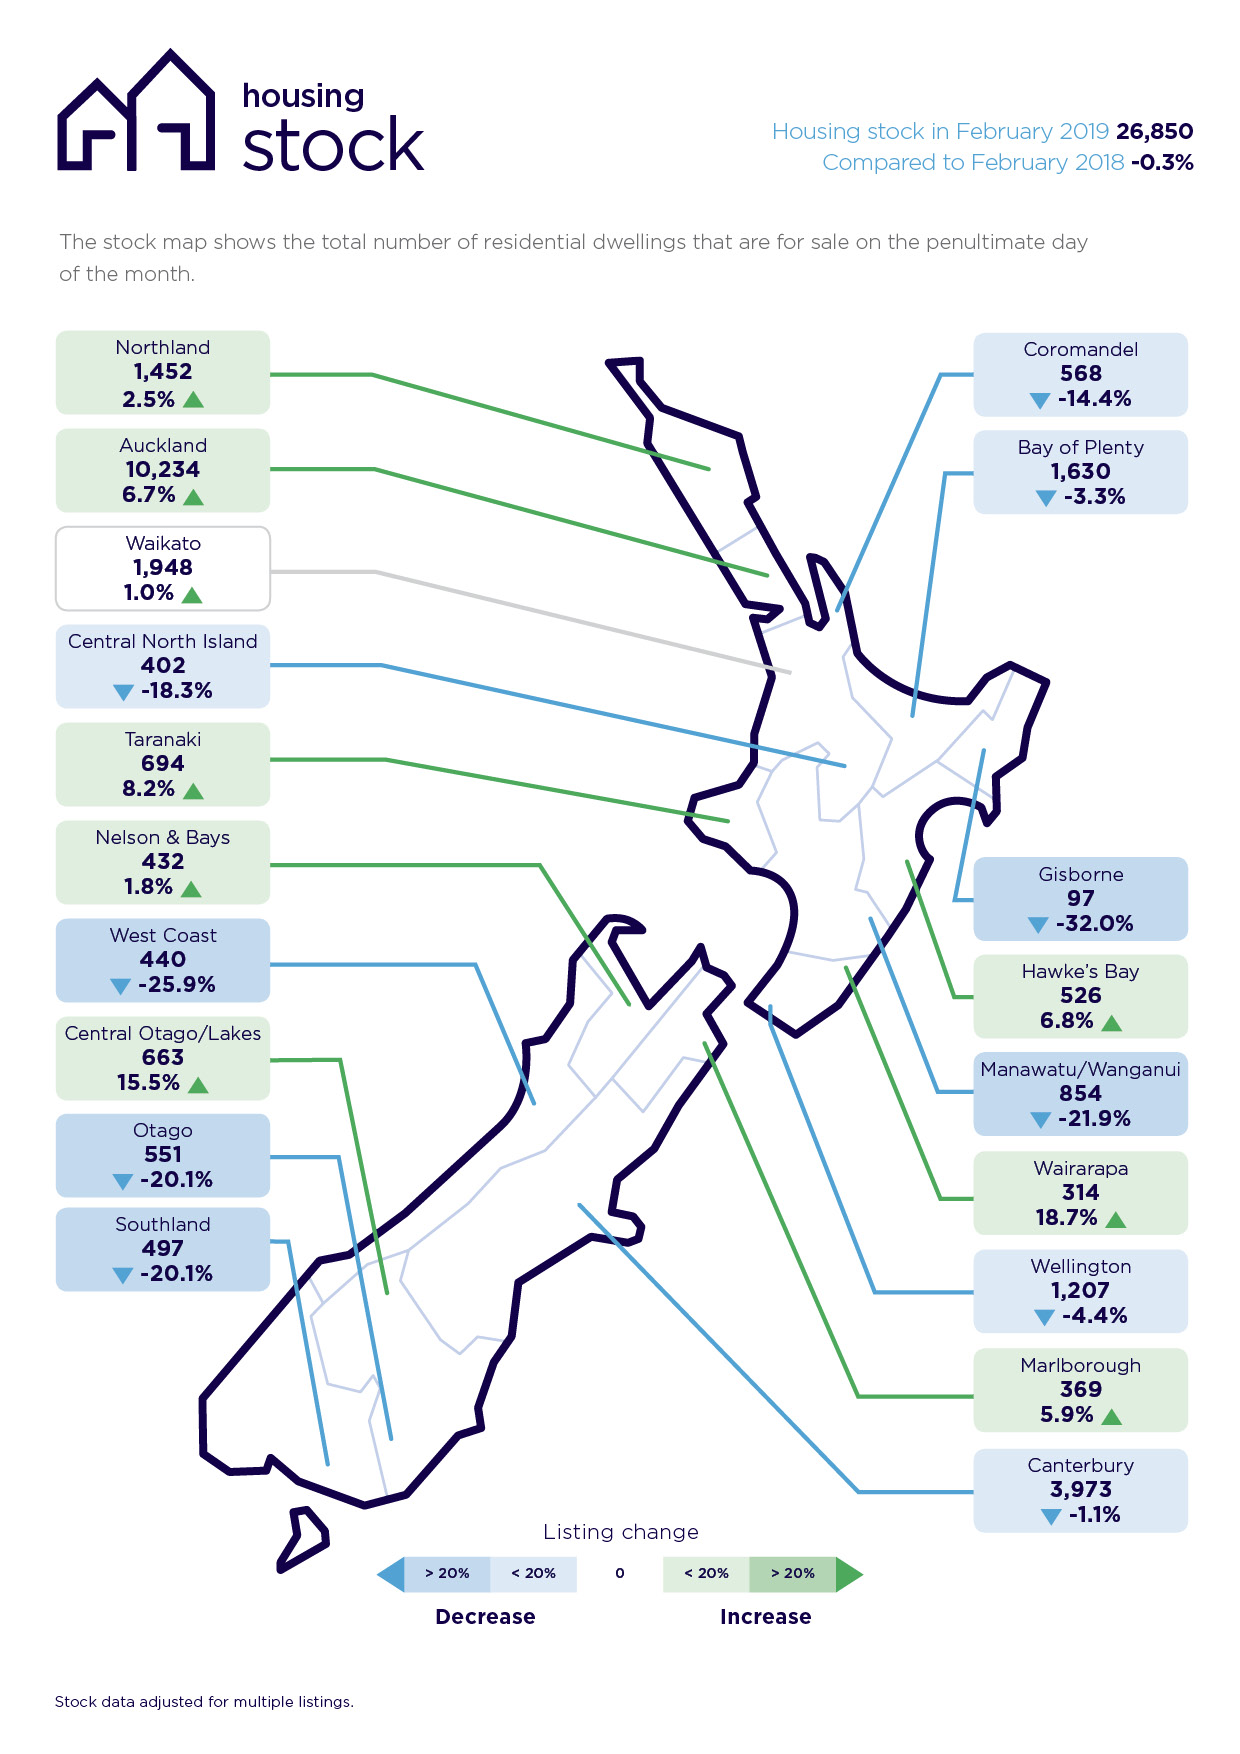
The total number of homes for sale nationally in February 2019 was 26,850, marginally down 0.3% compared to the previous year. Five years ago (February 2014) there were 41,731 homes listed for sale nationally as a comparison.
“We’ve been through the heady days of frantic activity and uncertainty and we have found our new normal,” says Vanessa.
“It’s characterised by a steady market, stable pricing and a pragmatic approach by buyers and sellers.”
“It’s a more stable environment where buyers and sellers can have more certainty and realistic expectations about what they can achieve in the current housing market,” says realestate.co.nz spokesperson Vanessa Taylor.
This level of stability and ongoing engagement in the New Zealand property market is reflected in the 1,067,871 unique browsers on realestate.co.nz during February, up 18.6% up on the same period last year.
“It’s business as usual,” says Vanessa. “These numbers are consistent with summertime browsing even though it’s a shorter month.”
National picture
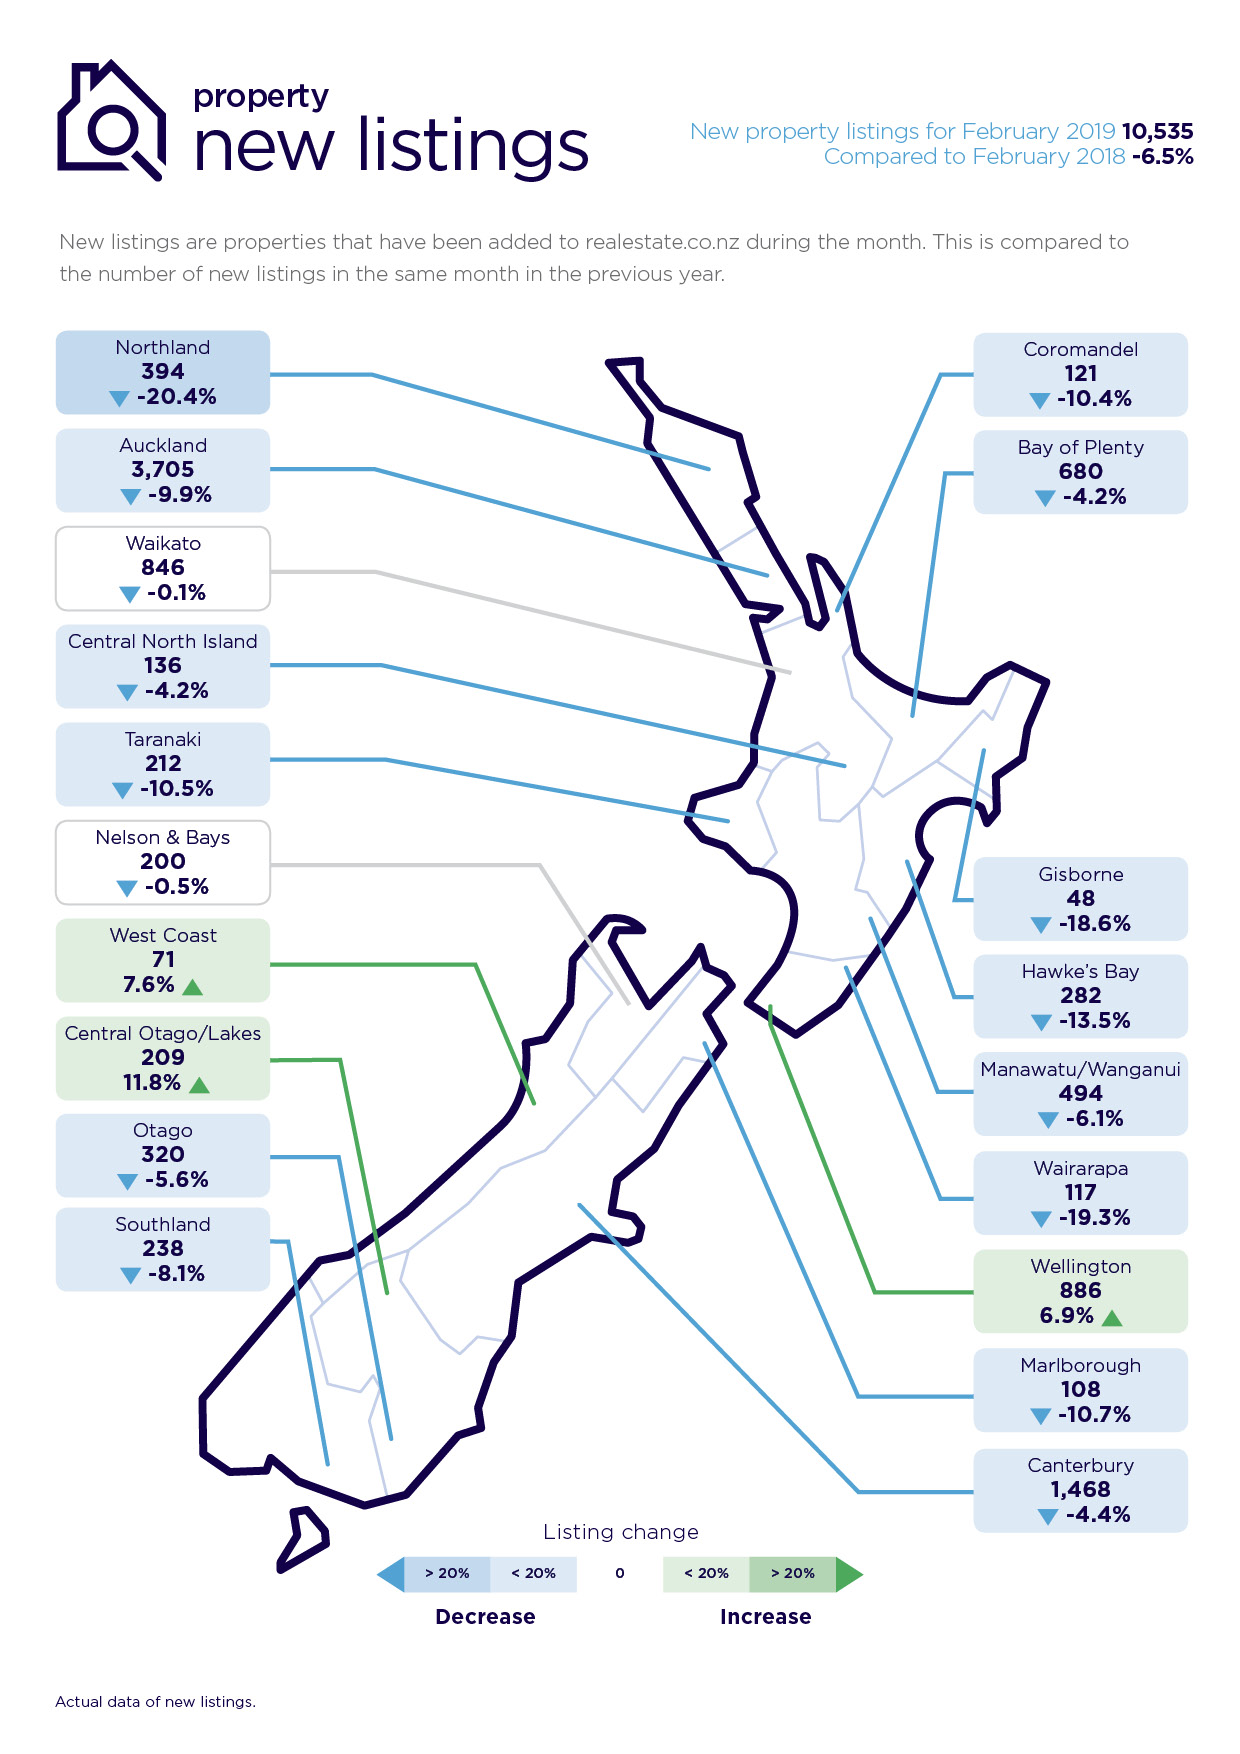
Nationally, real-time statistics from realestate.co.nz show that compared to February 2018, there was a 6.5% fall in new listings (to 10,535 listings) and a drop of only 0.3% in total listings (to 26,850 listings) in February 2019.
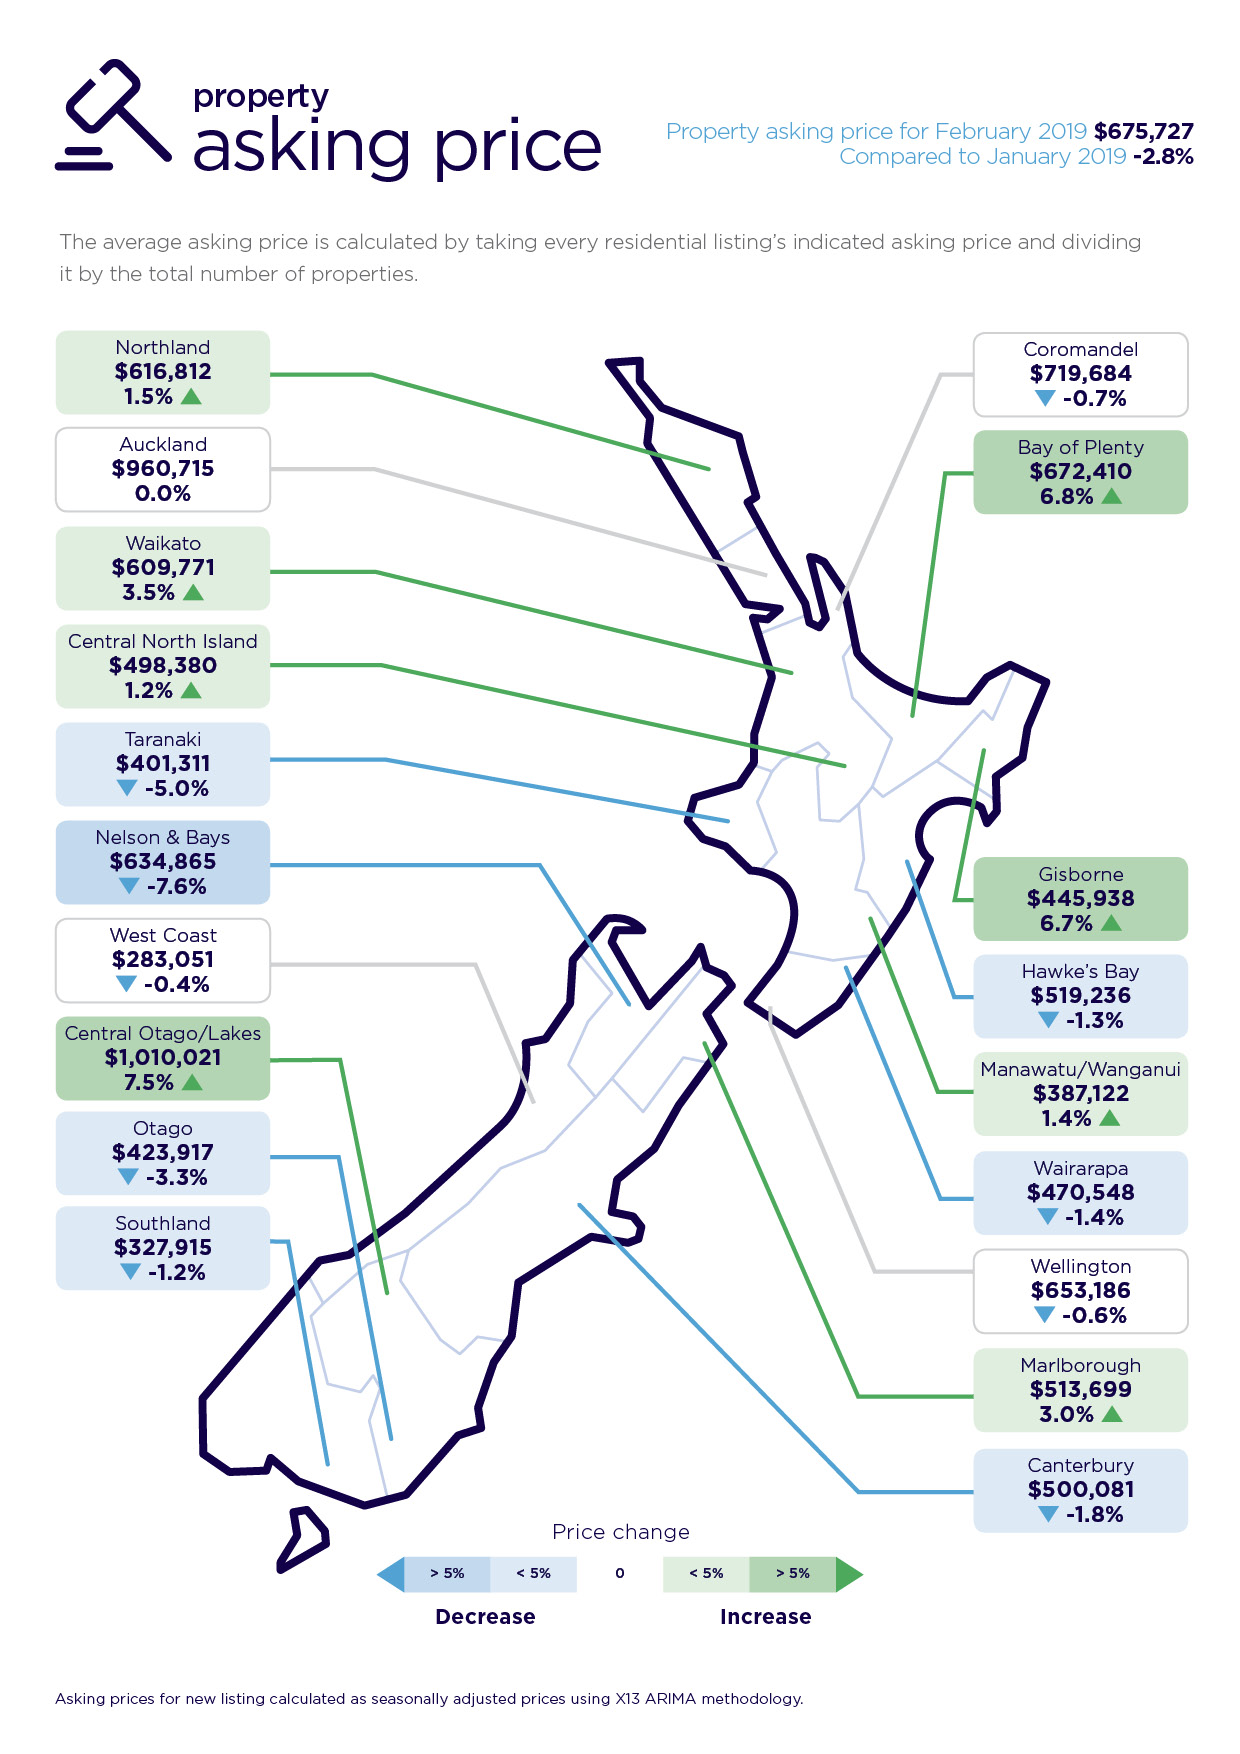
Asking prices fell 2.8% to $675,727 compared to last month (January 2019), however there were regions that were up and others down, which evened out the result across the country.
“This needs to be taken into context of a big January, when there was a record asking price, largely driven by increases in the smaller regions,” says Vanessa.
“As a result, we are seeing a slight adjustment in February, although four of the smaller regions still recorded all-time asking price highs in February (Waikato, Gisborne, Central North Island and Manawatu / Wanganui).”
Across the country is the ongoing see-saw for the top spot in average asking price between the Central-Otago Lakes region and the Auckland region.
“The Central Otago-Lakes area has climbed back up over the one million dollar plus mark in February, leapfrogging the Auckland region’s average asking prices once more,” says Vanessa.
This is mainly due to some top end properties hitting the market in the Queenstown district.
New property listings
Of the five main regions, only the Wellington region recorded an increase in new listings in February (up 6.9% compared to the previous year, representing 886 new listings).
In the smaller regions, new listings in Central-Otago Lakes were up 11.8% (to 209 listings) and the West Coast region was up 7.6% (totalling 71 new listings) compared to the same time last year.
Of the other smaller regions, 11 recorded decreases in new listings in February compared with February 2018.
All-time asking price highs in four regions
Once again, it was the smaller regions which dominated new records in average asking price highs.
The Gisborne region led the charge, with a 6.7% increase in average asking price to $445,938 compared to January 2019.
This was followed by the Waikato region (the only major region to hit a new record) with the average asking price reaching $609,771 in February, up 3.5% from the previous month.
The Manawatu-Wanganui region was up 1.4% to $387,122, while Central North Island was up 1.2% to $498,380 compared to the prior month.
Central Otago-Lakes takes the lead once more in average asking prices, while Auckland region average asking prices lift by a mere $233
Three months after the Auckland region took the crown off Central Otago-Lakes as the most expensive in terms of average asking prices, the South Island region has bounced back again.
The two regions were remarkable in their own right, says Vanessa.
“For the first time since April 2016, the Auckland region was so steady compared to the previous month, average asking prices lifted by a mere $233 in February,” she says.
“That’s equivalent to 46 coffees at $5 a pop.”
Auckland’s average asking price in February was $960,715 compared to $960,482 in January 2019.
By contrast, Central-Otago Lakes leapt 7.5% to an average asking price of $1,010,021.
“Back in November, we questioned whether the fall in average asking prices in this region could have been due to the impact of the Overseas Investment Act. Our thinking is that the drop is either directly or indirectly based on the significant number of high-end Queenstown properties on the market in the month leading up to the passing of the Bill.”
“It appears that the market has a life of its own, with a steady climb in asking prices over the past three months,” says Vanessa.
Sales results stable
Bindi Norwell, Chief Executive of the Real Estate Institute of New Zealand says: “The sales results we’ve seen over the past few months point to the industry being in a stable position, with a continued two-tiered market. Auckland has been relatively flat for some time now, whilst some of the regions across New Zealand have been experiencing strong growth.”
Glossary of terms:
As the only provider of real estate data in real time, realestate.co.nz offers valuable property market information not available from other sources.
- Average asking price gives an indication of current market sentiment. Statistically, asking prices tend to correlate closely with the sales prices recorded in future months when those properties are sold. As it looks at different data, average asking prices may differ from recorded sales data released at the same time.
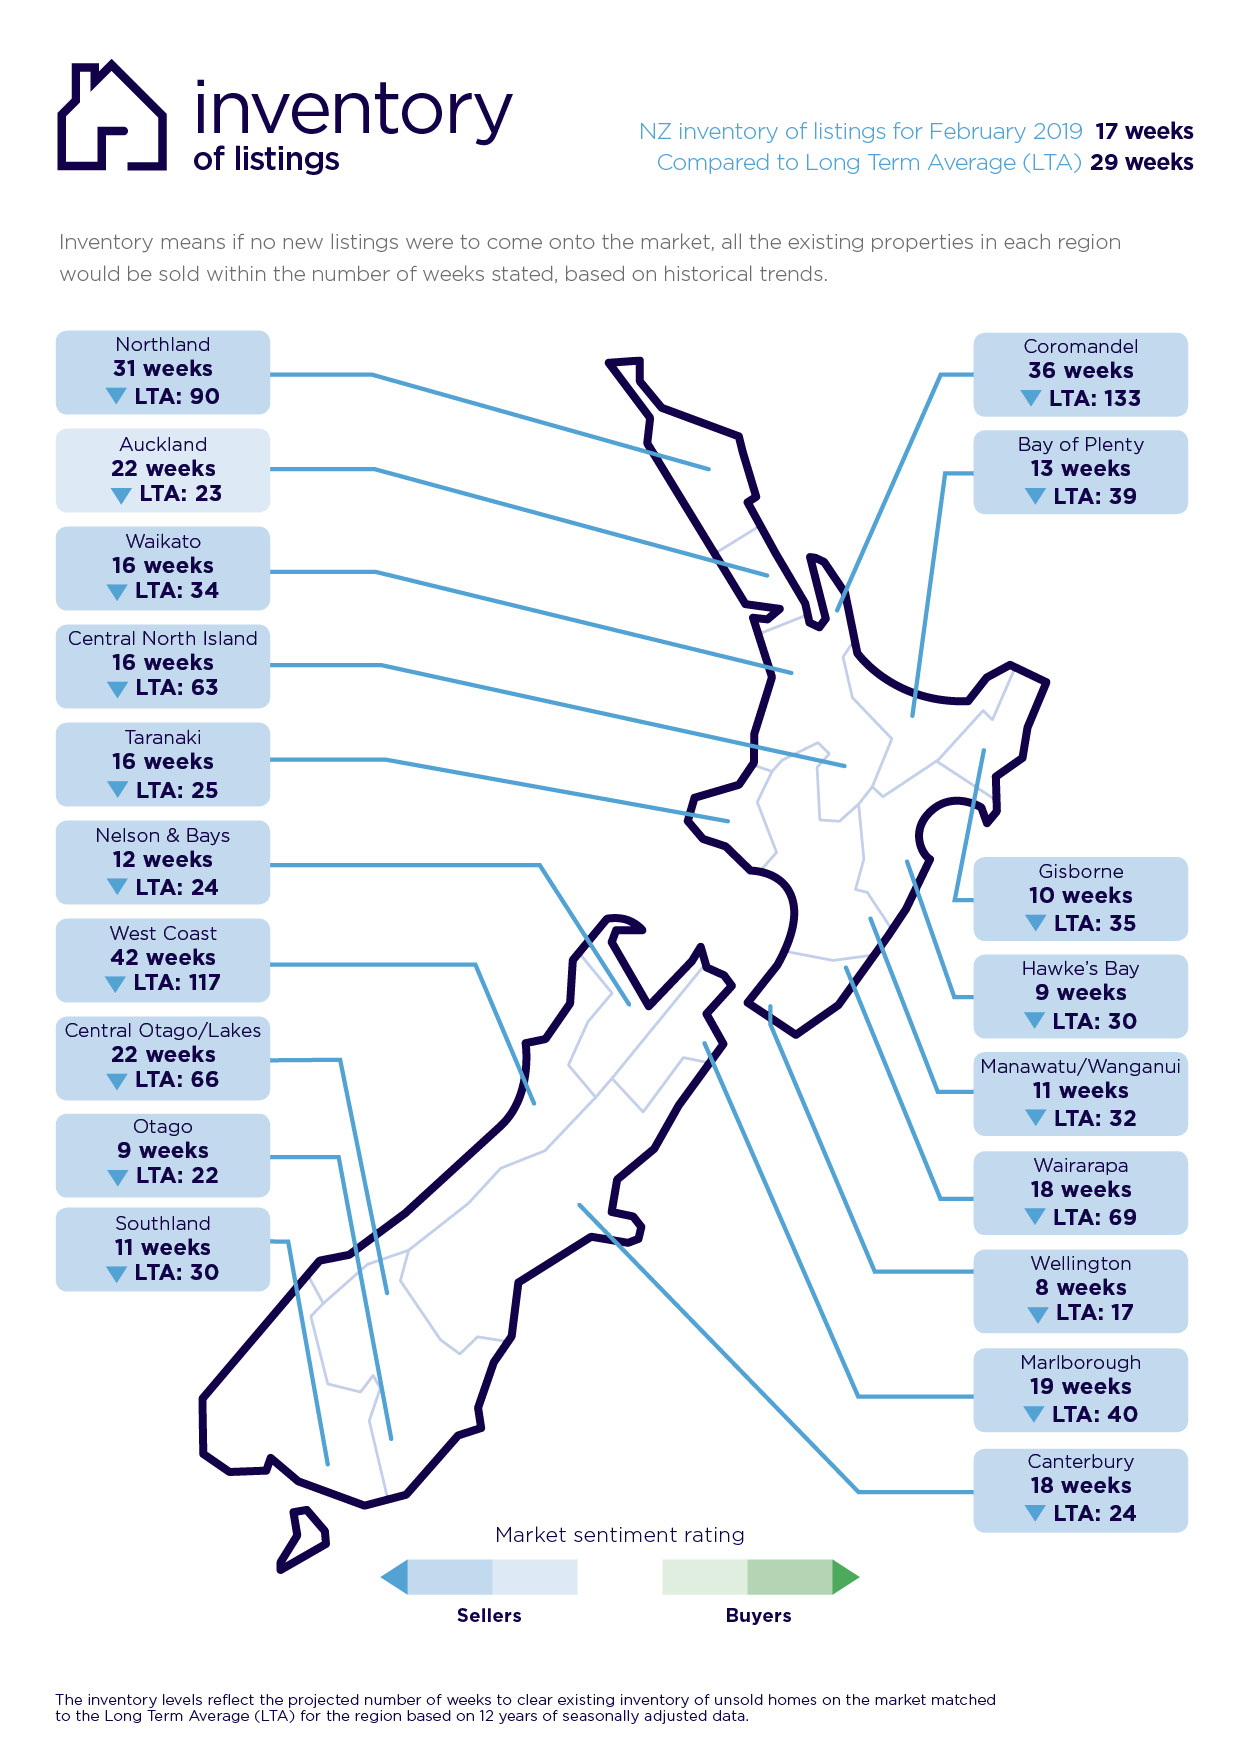
- Inventory is a measure of how long it would take, theoretically, to sell the current stock at current average rates of sale if no new properties were to be listed for sale. It provides a measure of the rate of turnover in the market.
- New listings are a record of all the new listings on realestate.co.nz for the relevant calendar month. As realestate.co.nz reflects 97% of all properties listed through registered estate agents in New Zealand, this gives a representative view of the New Zealand property market.
- Demand is the increase or decrease in the number of views per listing in that region, taken over a rolling three-month time frame, compared to the same three-month time frame the previous year – including the current month.
- Seasonal adjustment is a method realestate.co.nz uses to better represent the core underlying trend of the property market in New Zealand. This is done using methodology from the New Zealand Institute of Economic Research.
- Truncated mean is the method realestate.co.nz uses to provide statistically relevant asking prices.
- The top and bottom 10% of listings in each area are removed before the average is calculated, to prevent exceptional listings from providing false impressions.
For media enquiries, please contact:
Alex Dudley, PPR
T: +64 27 5399 555
E: alex.dudley@ppr.co.nz
Share
-
.svg)
.svg)
.svg)