
.svg)


Download the full report as a PDF now.
National average asking price hits a record high for the second month straight. While we saw more property choices for buyers than in December, the nationwide shortage remains. Potential market shift on the cards for the middle of the North Island.
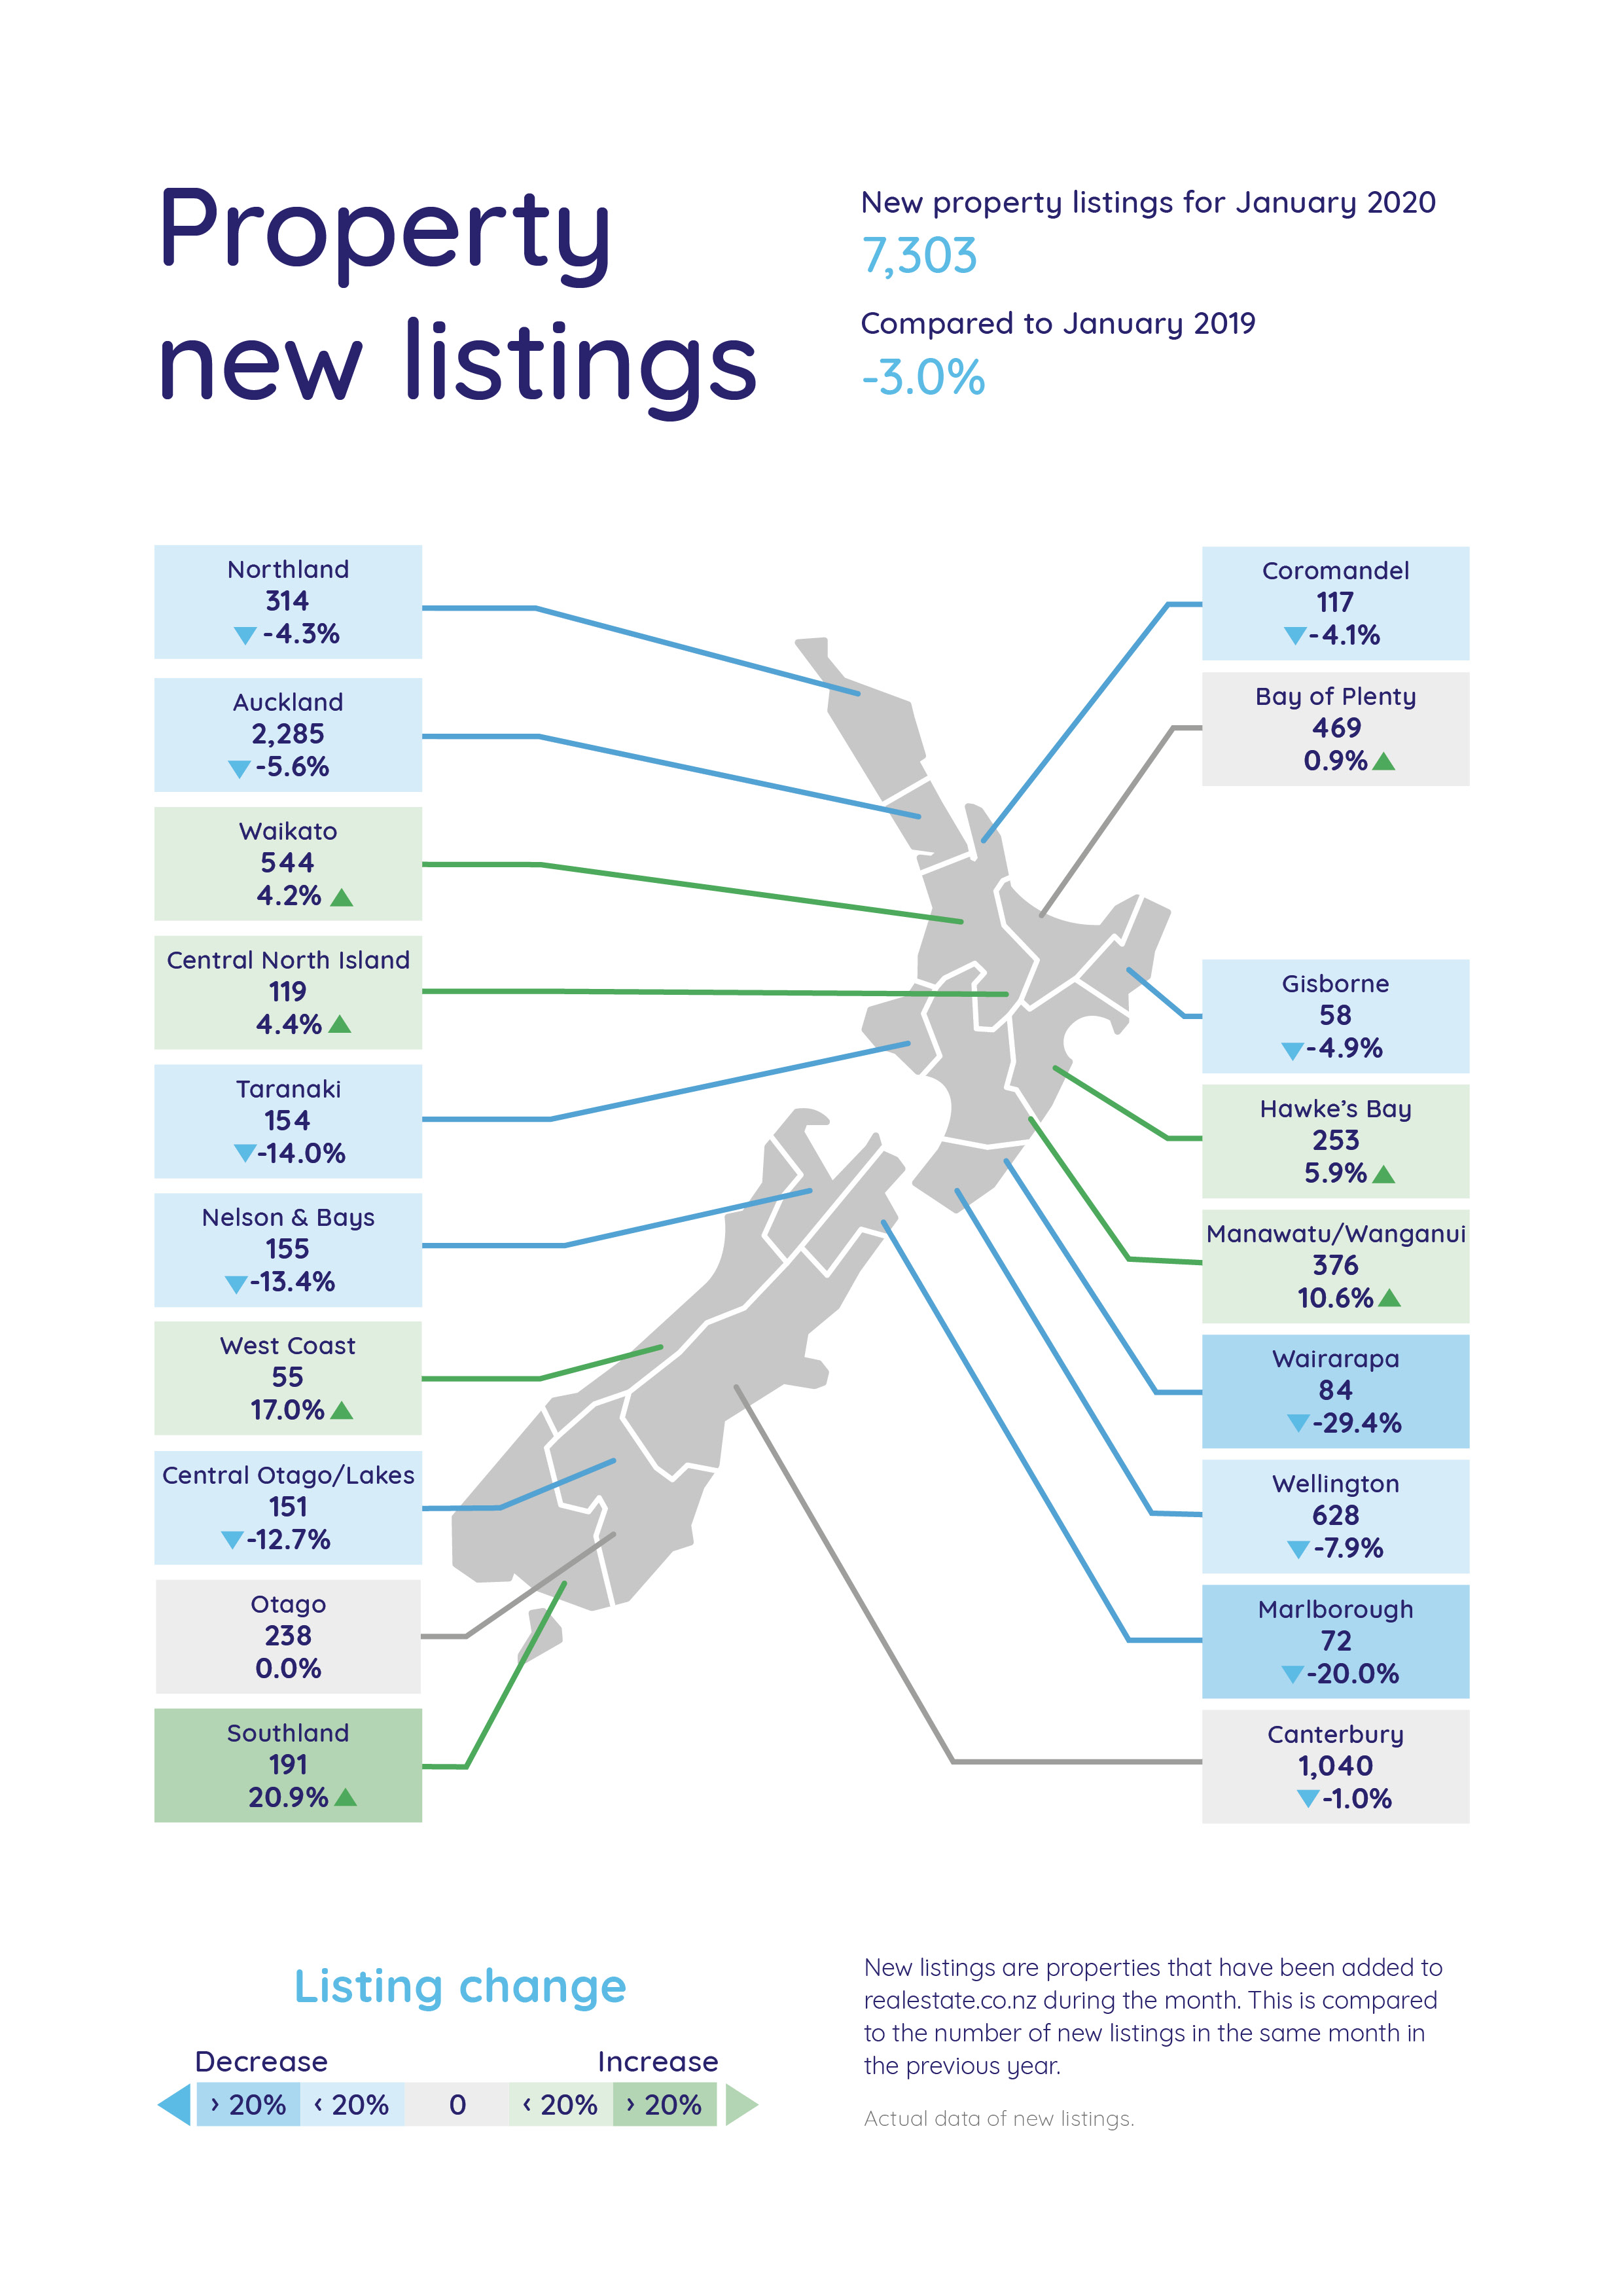
Real-time data from realestate.co.nz shows that while more people put their homes on the market in January 2020 than in December 2019, there is still a shortage across the country with total homes available for sale down by 21.7% when compared to the same time last year.
In the middle of the North Island, however, January was a busy time for sellers. Increases in new listings across four regions could be an early indication of a market shift.
Asking prices were also up nationally for the second consecutive month with highs in four regions.
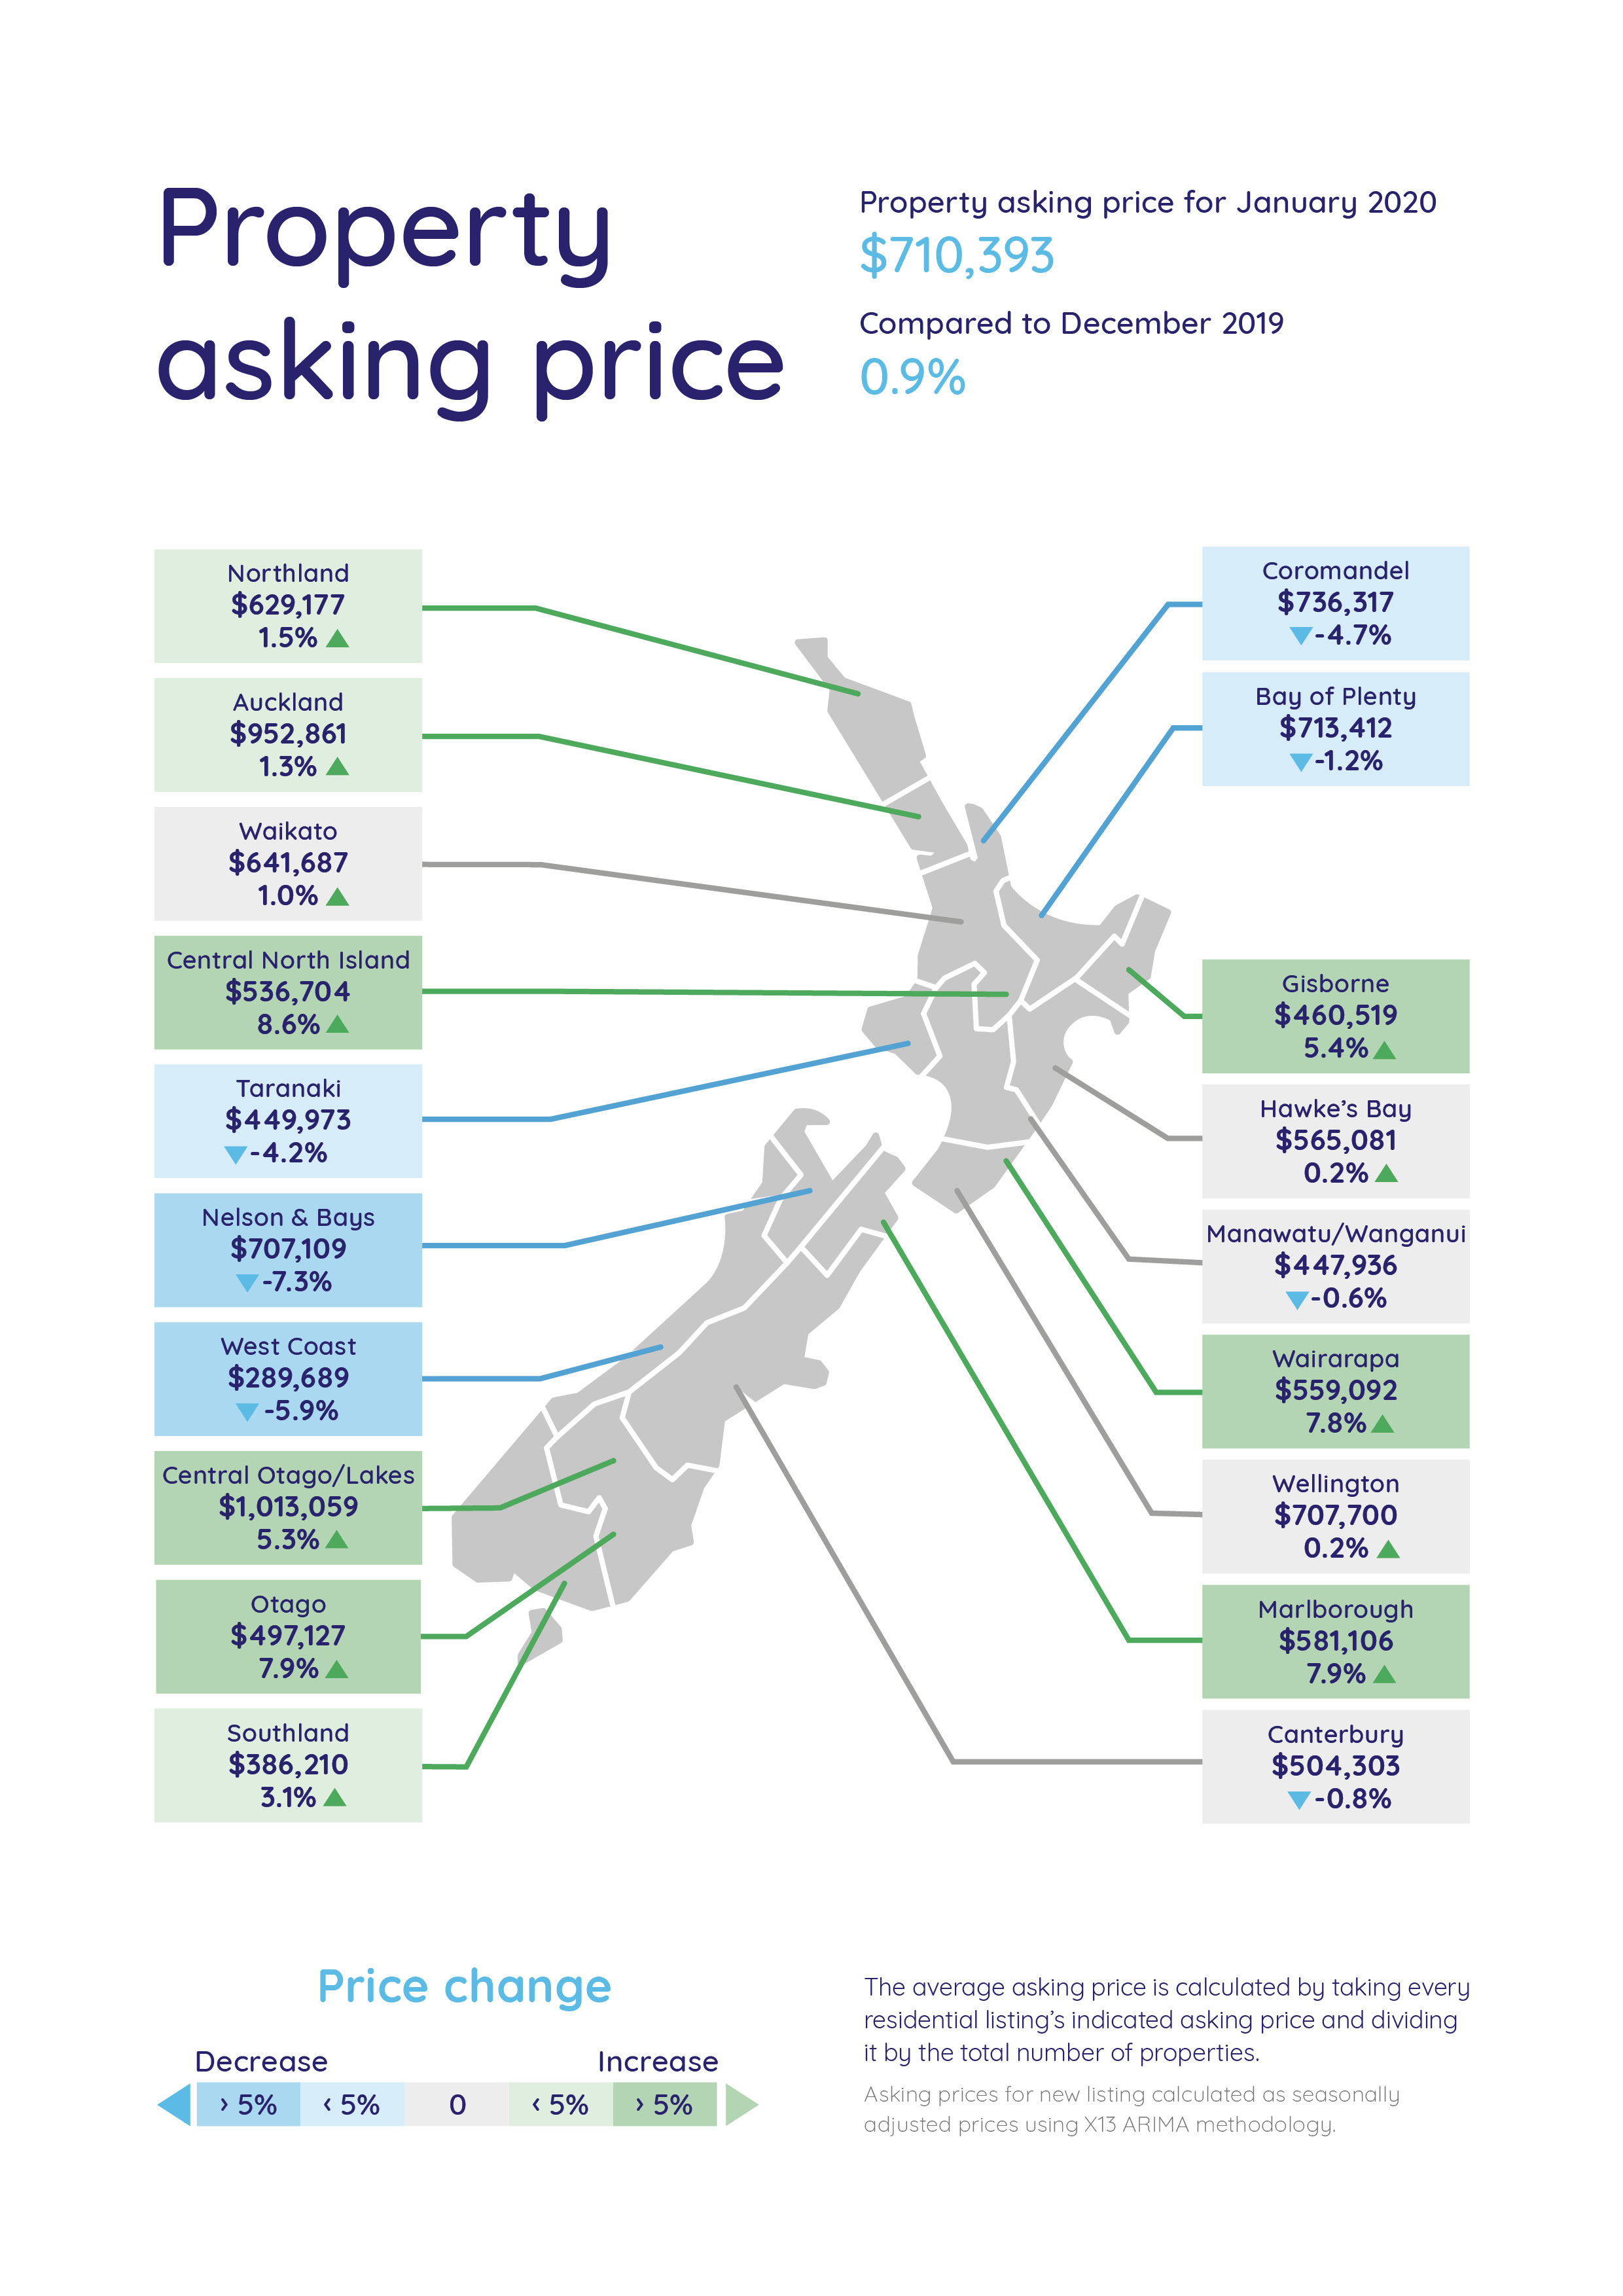
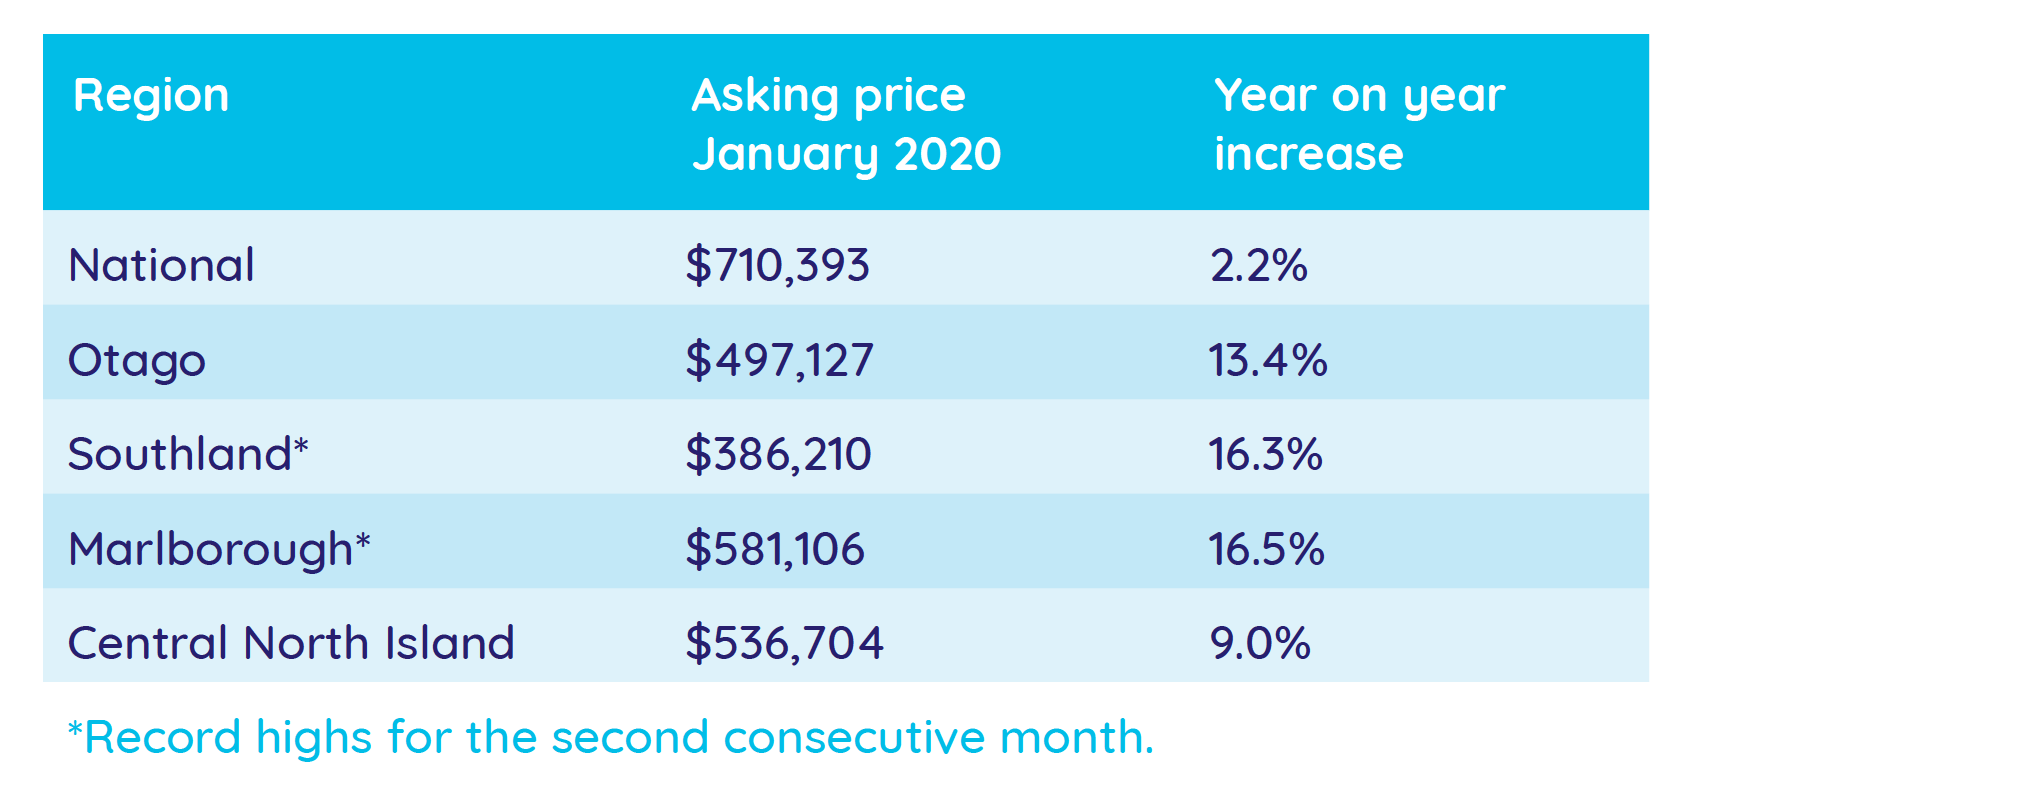
Five all-time asking price highs since records began 13 years ago
The average asking price bumped over $700,000 for the first time at the end of 2019 and it appears that prices are continuing to rise into the new decade. The national average asking price increased to $710,393 in January 2020, a marginal increase on December 2019’s high of $703,780.
Vanessa Taylor, spokesperson for realestate.co.nz, says it will be interesting to watch what happens to the national average asking price in 2020.
“We often see the national average fluctuating quite a bit in response to what is happening around the country, so we will be waiting to see if the price holds above $700,000 or drops back down to the mid to high $600,000s that we saw throughout 2019,” says Vanessa.
Otago, Southland, Marlborough and the Central North Island also hit record asking price highs in January 2020. These all-time highs were consecutive monthly records for both Southland and Marlborough who also hit record highs in December 2019.
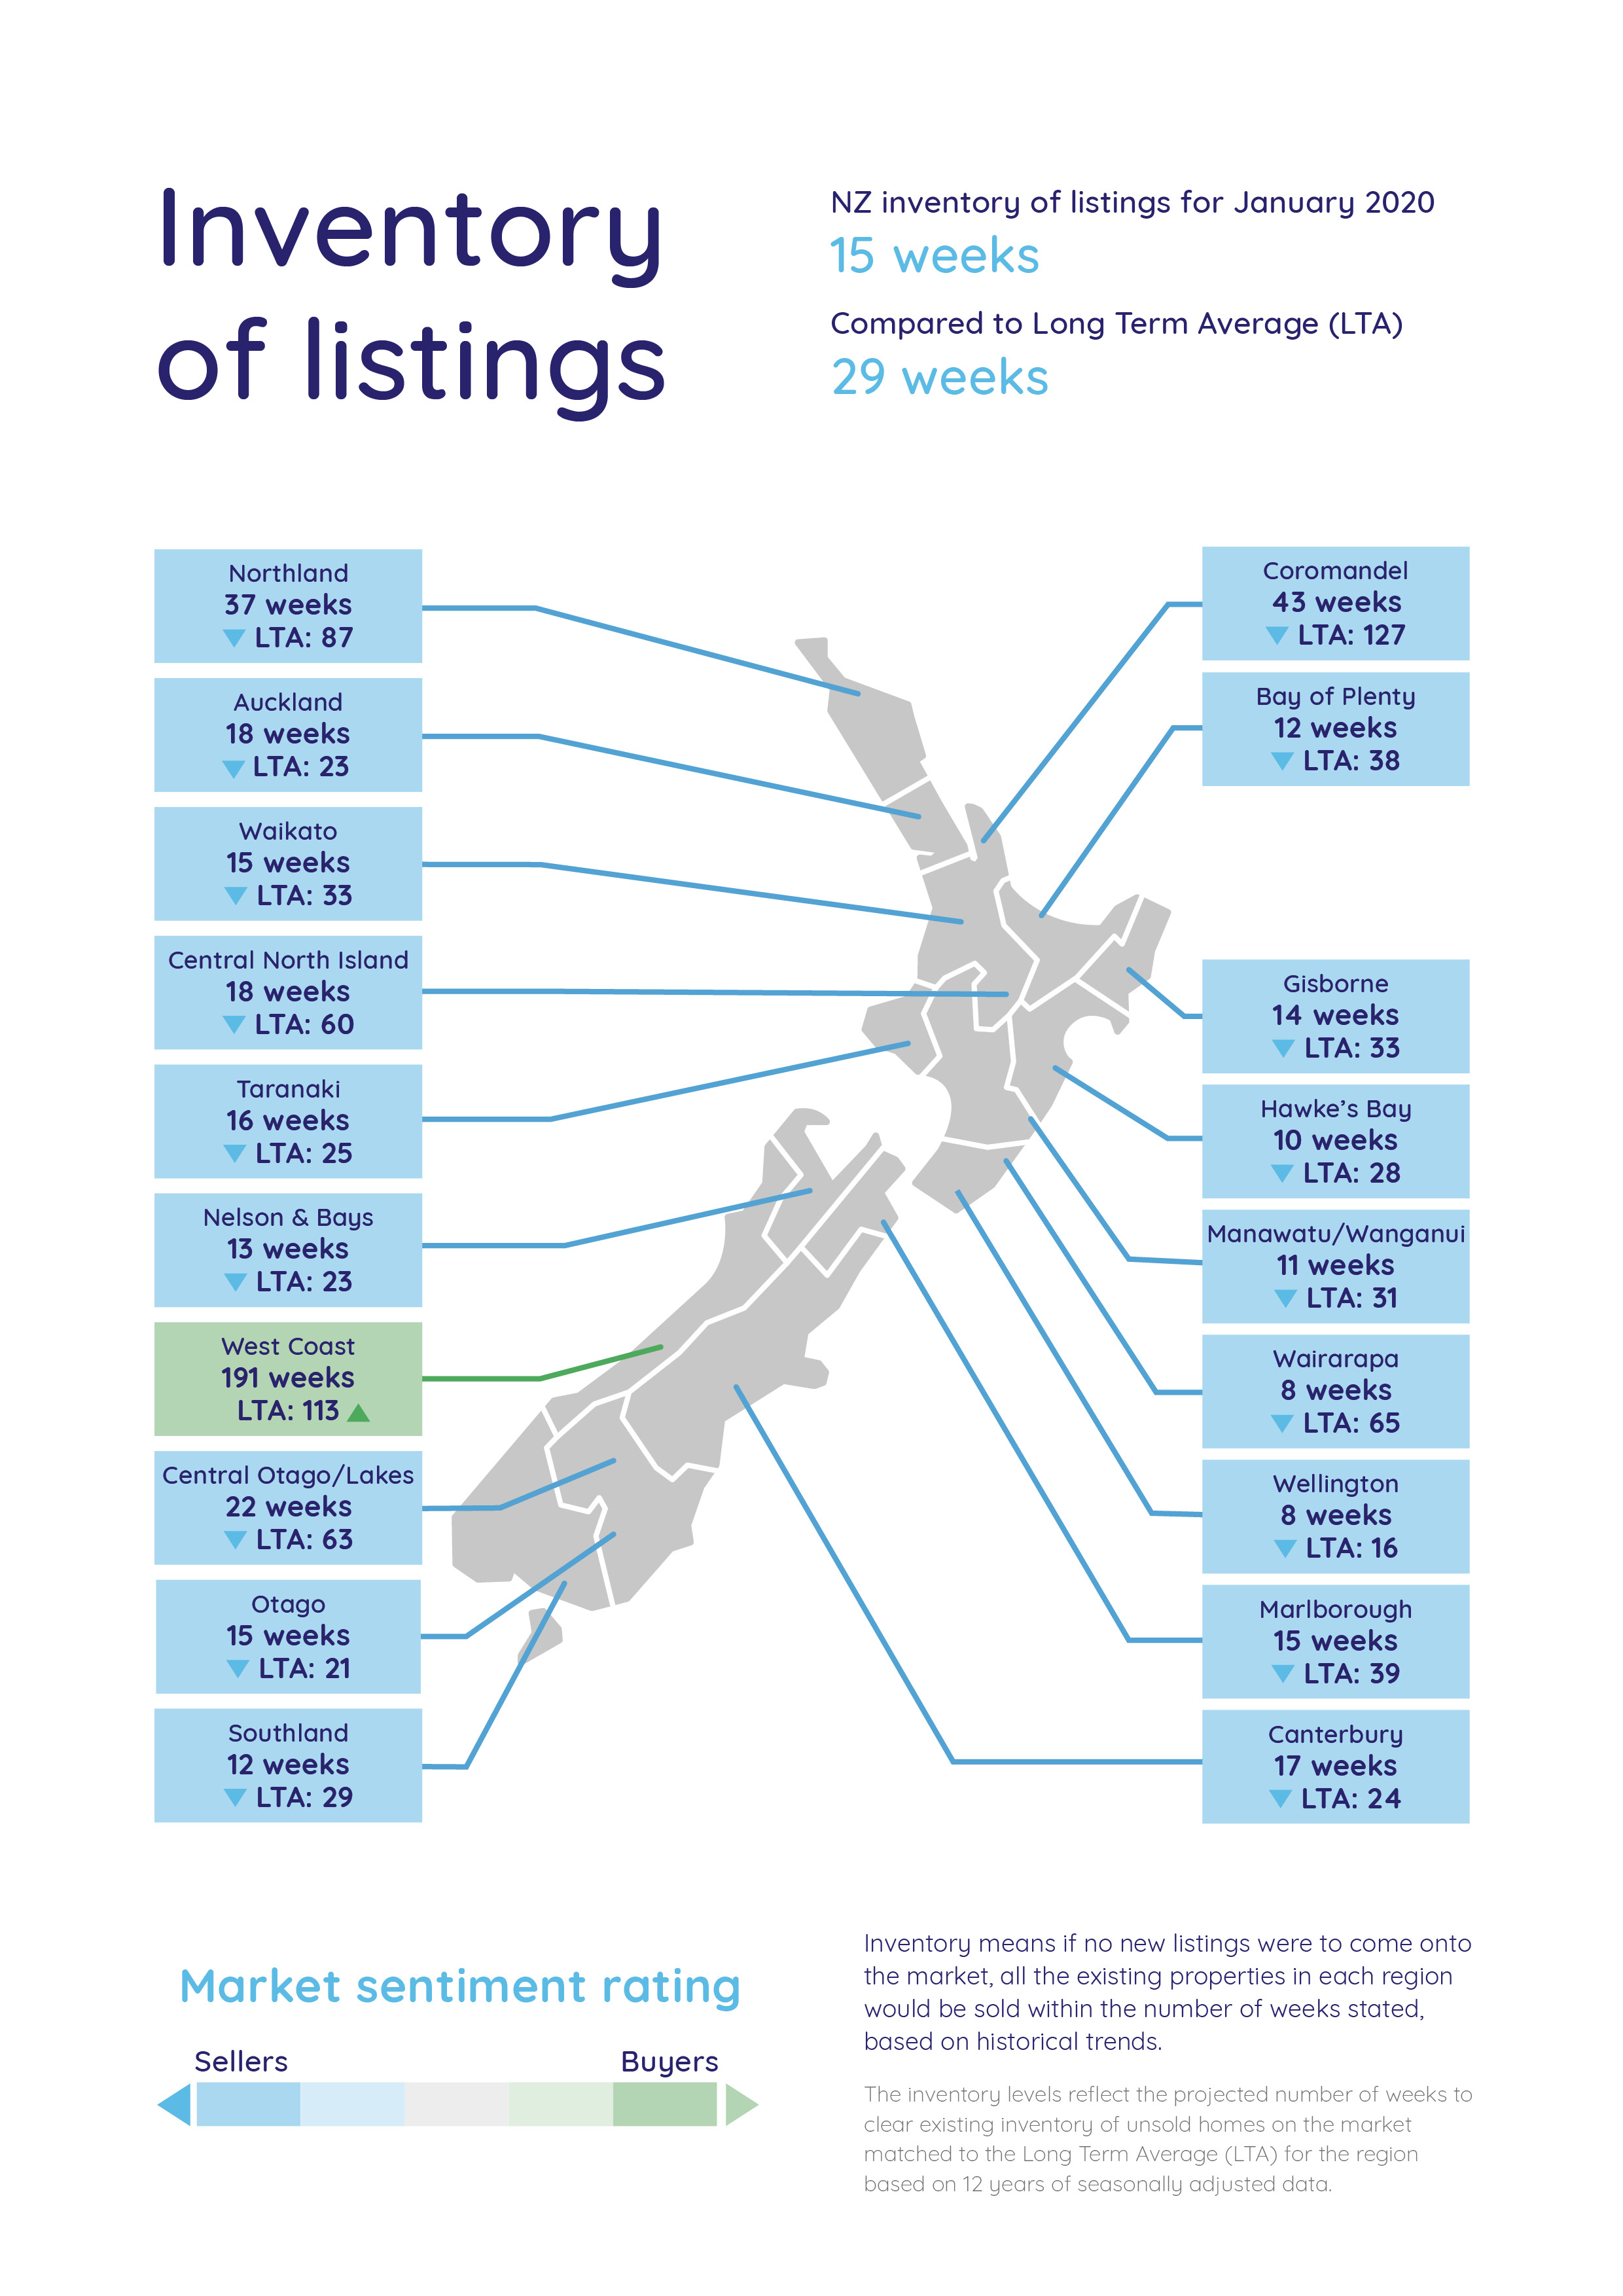
All-time low number of total homes available for sale in Wairarapa, Marlborough and the Bay of Plenty
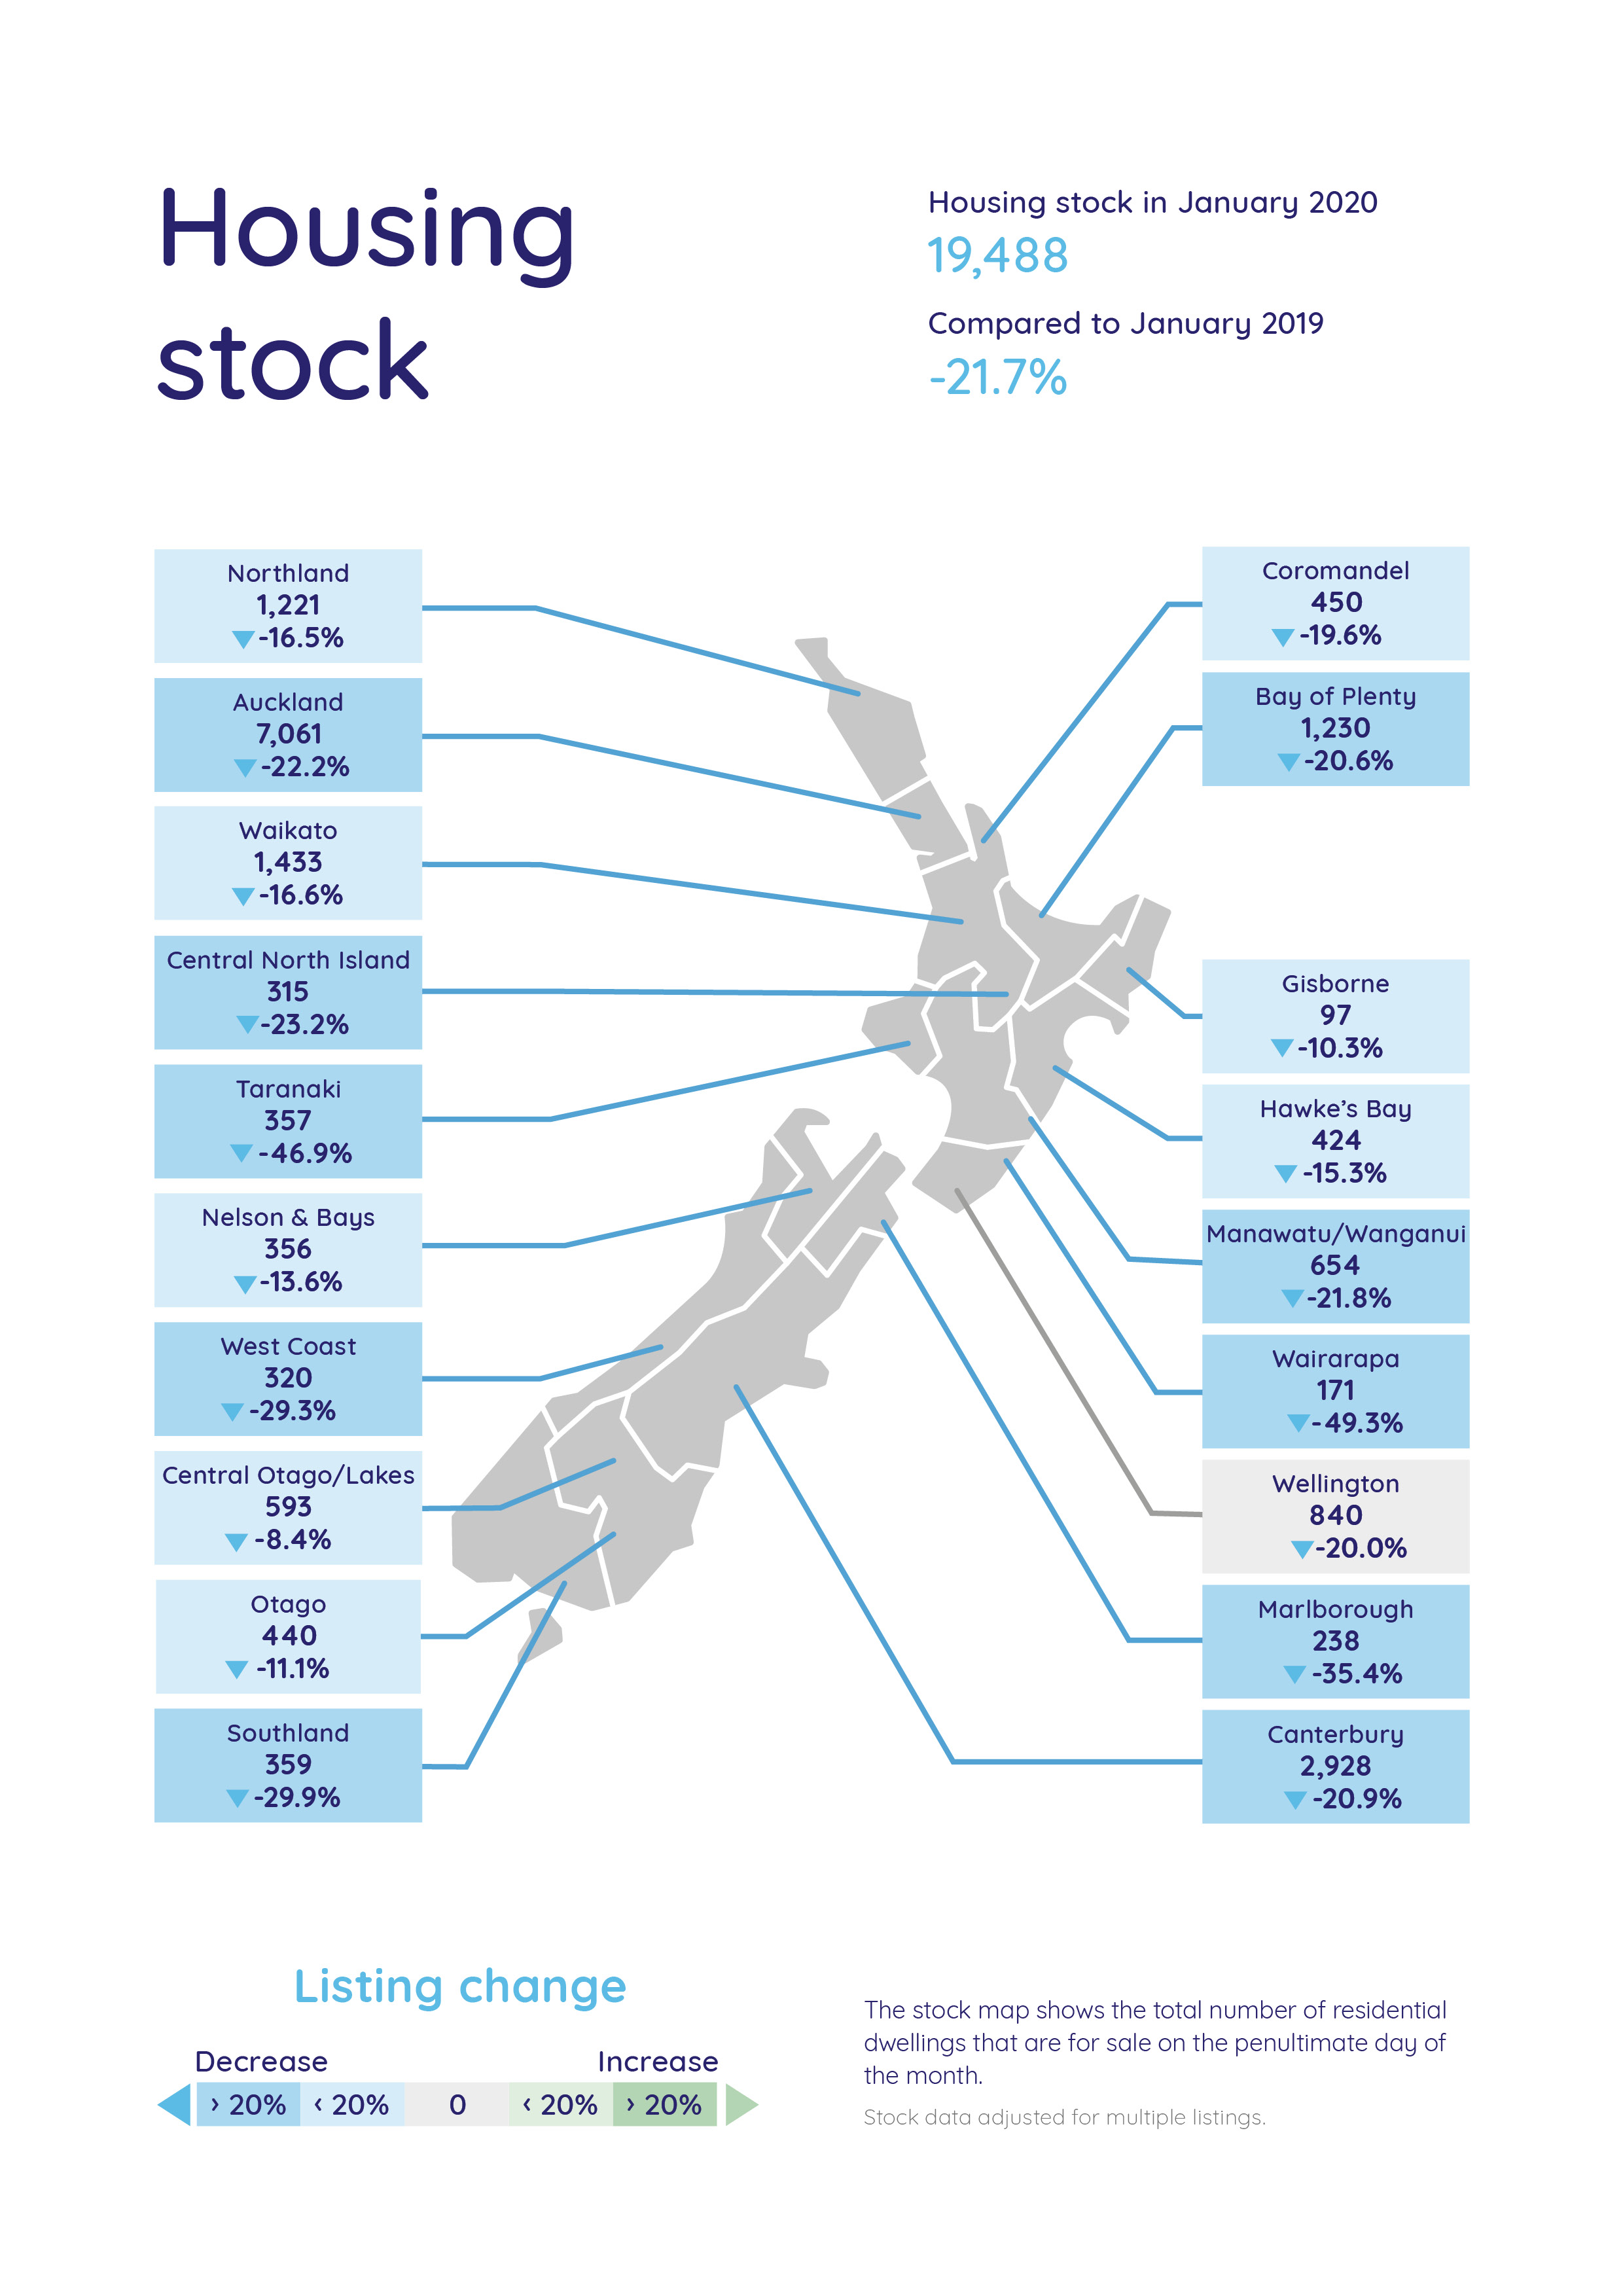
Following a record national low in December 2019, total homes available for sale nationwide increased by 6.9% from December to January. However, the total number of homes for sale in January 2020 was down 21.6% nationally compared to January 2019 - with only 19,488 homes for sale throughout the country.
Not one region in New Zealand saw an increase in the number of homes for sale in January 2020 when compared to the same month last year.
Wairarapa and Taranaki saw the biggest drops in the number of homes for sale, seeing decreases of 49.3% and 46.9% respectively when compared to January 2019.
In the Bay of Plenty, total homes available for sale hit an all-time low for the second month in a row, dropping 20.6% since January 2019.
Vanessa says Kiwis might be holding on for one last summer at the beach.
“We saw stock levels drop right down in December and they have stayed put ever since. New listings coming onto the market were also flat in the Bay of Plenty through January 2020.”
Could a property market shift be brewing in the North Island?
Despite low stock in all regions, increased activity in the middle of the North Island could be signalling a market shift, says Vanessa.
In the Waikato, Central North Island, Manawatu/Whanganui and the Hawke’s Bay, the number of new listings coming onto the market increased last month when compared to January 2019.
The proximity of these regions to one another, as well as flat average asking prices in the Waikato, Manawatu/Whanganui and the Hawke’s Bay, could be an early indicator that things are shifting, says Vanessa.
“When we see new listings increase, it tells us that there is more activity in those areas than there was a year ago – this could be a clue that the tides might turn on the current seller’s market.”
“Although it is too early to say whether this is a trend, we haven’t seen a lift in these regions for quite some time, so this is definitely something to watch over the next few months,” says Vanessa.
Bindi Norwell, Chief Executive at REINZ says: “With a number of parts of the Central North Island seeing record median prices throughout 2019, some vendors are seeking to take advantage of some of the high sale prices being achieved in the area – hence the uplift in new listings. It will be interesting to see if this starts to create a ripple effect in the coming months throughout the rest of the North Island.”
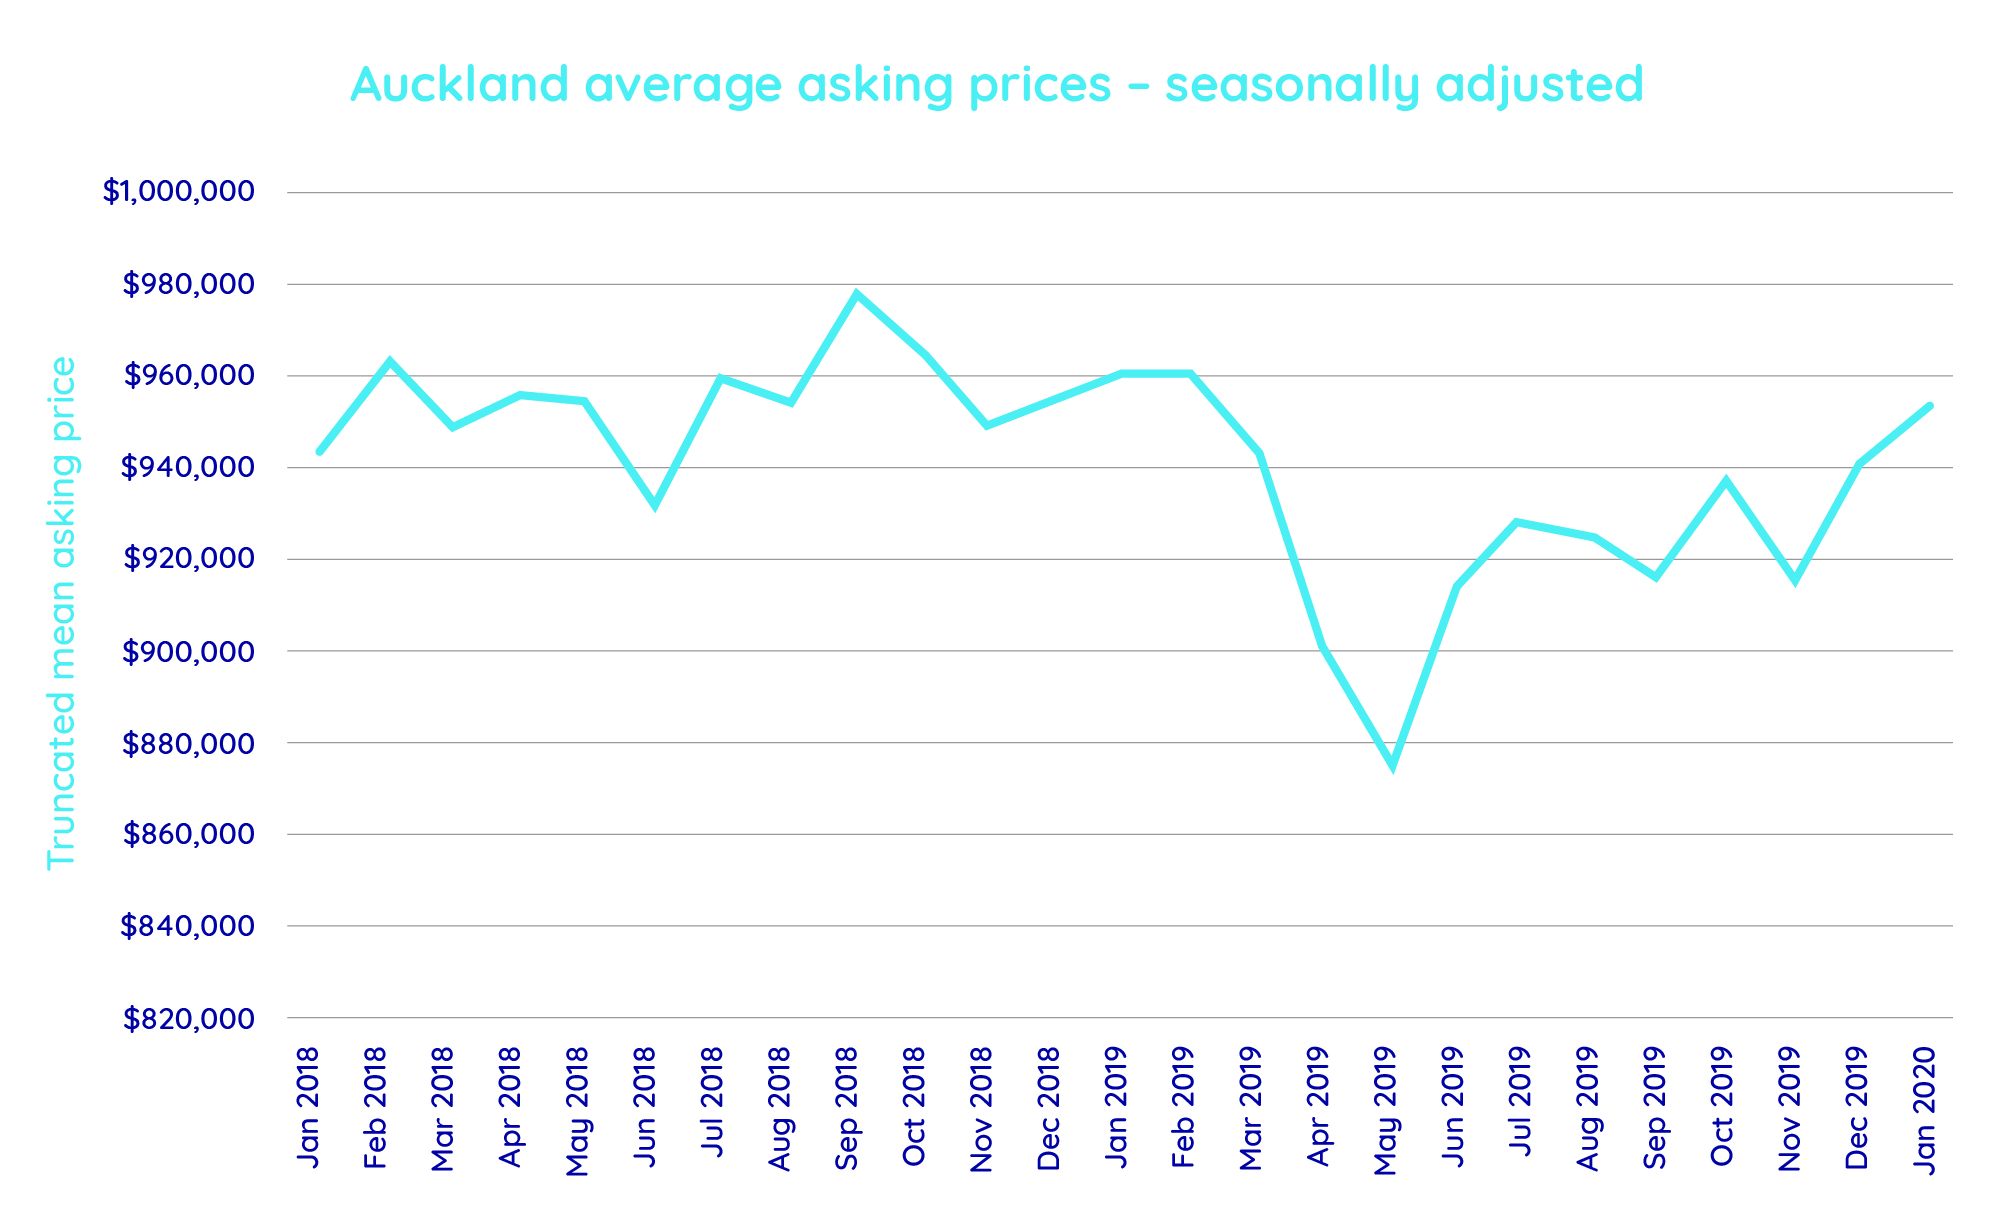
Auckland housing market remains tight, but prices down on the same time last year
Auckland remains a seller’s game with low stock. The average asking price in Auckland, which dipped back to $875,476 in May 2019, hovered between the low to mid $900,000s throughout last year. Last month we saw this trend of peaks and troughs continue, although prices are still marginally below what they were in January 2019.
The total number of homes available for sale has increased slightly on December but is still down by 22.2% on the same time last year.
New listings were also down on January 2019 with a 5.6% decrease in new properties entering the market in January 2020 than in the previous year.
For media enquiries, please contact:
Trish Fitzsimons | 021 022 96927 | trish@realestate.co.nz
Glossary of terms: As the only provider of real estate data in real-time, realestate.co.nz offers valuable property market information not available from other sources. Data from realestate.co.nz span 13 years with data records since 2007 available.
- Average asking price is not a valuation. It is an indication of current market sentiment. Statistically, asking prices tend to correlate closely with the sales prices recorded in future months when those properties are sold. As it looks at different data, average asking prices may differ from recorded sales data released at the same time.
- Inventory is a measure of how long it would take, theoretically, to sell the current stock at current average rates of sale if no new properties were to be listed for sale. It provides a measure of the rate of turnover in the market.
- New listings are a record of all the new listings on realestate.co.nz for the relevant calendar month. As realestate.co.nz reflects 97% of all properties listed through registered estate agents in New Zealand, this gives a representative view of the New Zealand property market.
- Demand: the increase or decrease in the number of views per listing in that region, taken over a rolling three-month time frame, compared to the same three-month time frame the previous year – including the current month.
- Seasonal adjustment is a method realestate.co.nz uses to better represent the core underlying trend of the property market in New Zealand. This is done using methodology from the New Zealand Institute of Economic Research.
- Truncated mean is the method realestate.co.nz uses to provide statistically relevant asking prices. The top and bottom 10% of listings in each area are removed before the average is calculated, to prevent exceptional listings from providing false impressions.
Share
-
.svg)
.svg)
.svg)