
.svg)


Download the full report as a PDF now.
November saw all-time asking price highs in eight regions since records began in 2007. Property seekers were still active with over one million users to the site in November, but little choice for houses nationwide.
Real-time data from realestate.co.nz shows that regional New Zealand is heating up for summer. All-time asking price highs since records began 13 years ago were reached in eight regions during November, reflecting the steady climb in asking prices throughout 2019.
While property seekers were still active with 1,084,611 unique users visiting realestate.co.nz, property sellers continued the trend from last month. The total number homes available for sale and new listings both down considerably on the same time last year, squeezing choice for those looking to buy.
Spokesperson from realestate.co.nz, Vanessa Taylor, says that Kiwis might be anticipating the busy Christmas period:
“Asking price highs have grown in many parts of New Zealand and for many of these regions it is not their first high for 2019.”
“The highs and the current low stock levels suggest that Kiwis are waiting to get through the busy Christmas and New Year period before thinking of selling in 2020,” says Vanessa.
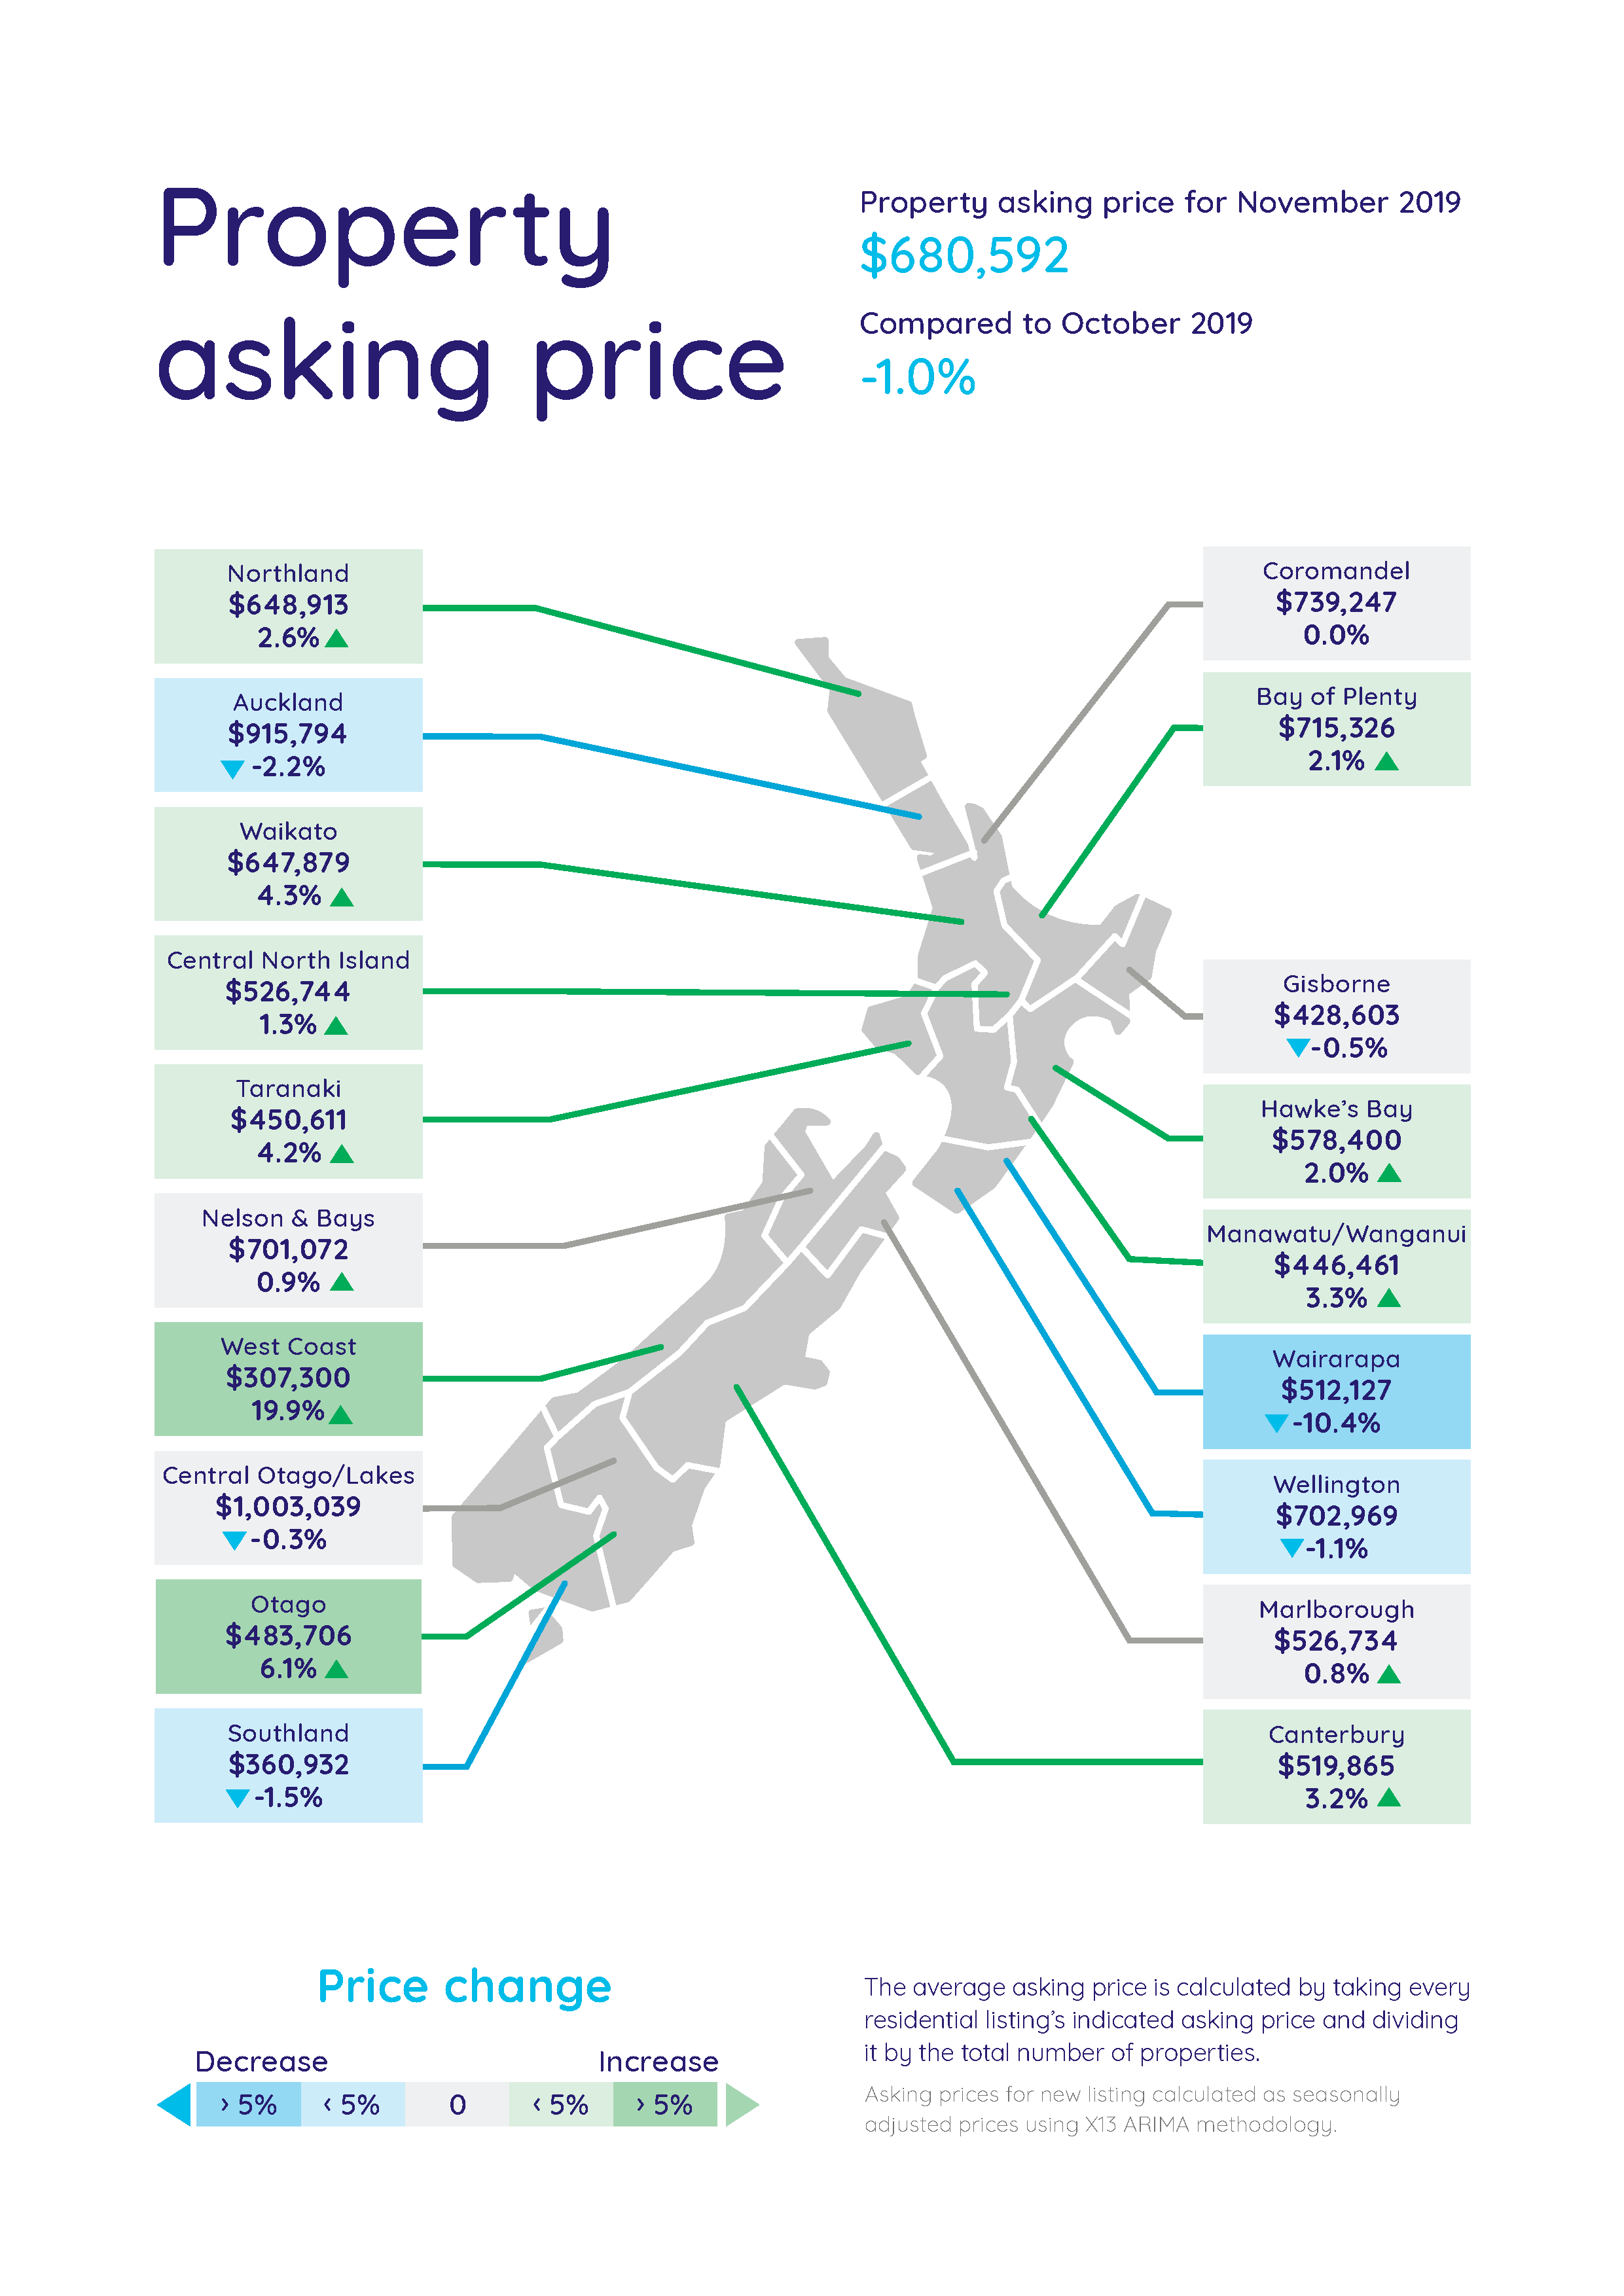
Record asking prices in eight regions
Northland, which has hit record highs three times this year, saw another record high of $648,913 in November. Waikato climbed just over 4%, when compared to last month, to $647,879 – which was over $21,000 more than the regions last recorded high of $626,776 in May this year.
In the Central North Island, average asking prices rose to $526,774, an increase of 1.3% on October 2019. The Manawatu-Wanganui region, which has seen prices swell considerably through 2019, hit $446,461, a 3.3% increase on the previous month. The region achieved all-time highs consecutively across the first four months of the year, followed by never-before-seen highs in June, August and September.
The Bay of Plenty crept up again in November to $715,326, while another summer hot spot Nelson & Bays also saw a marginal increase in asking price to $701,072. Another region to tip into the $700,000 bracket.
In Canterbury and Otago, asking prices rose to $519,865 and $483,706 respectively. In Otago, the increase was an impressive 6.1% on October 2019
Aucklanders continuing to seek property outside the city
Real-time data from realestate.co.nz site users show that many of those looking at property in regional New Zealand are based in Auckland. Northland, Bay of Plenty and the Central North Island appear to be crowd favourites for Aucklanders, with more Aucklanders searching online for property in those regions than those already living there.
However, in Manawatu-Wanganui, Canterbury and Otago, the majority of property seekers were based in those regions themselves.
“It looks like a number of Aucklanders are still looking for property outside of the city. This could suggest Aucklanders are looking for a permanent lifestyle change or are seeking holiday homes in the North Island this summer,” says Vanessa.
Wairarapa asking price drops, but remains a seller’s market
Last month we saw Wairarapa lead the charge with a 15.4% increase in average asking price to an unprecedented $571,621. Dropping back 10.4% this month to $512,127, the average asking price in November is just below the region’s last recorded high of $520,127 in August 2018.
Vanessa says that although a 10% decrease sounds significant, it is important to consider that last month was a steep spike:
“The average asking price in the Wairarapa region is still looking healthy, sitting 10.1% higher compared to the same time last year.”
“It will be interesting to watch this region over the next quarter to see whether the asking price remains high or whether it drops back to below $500,000 again as it has been for most of 2019,” says Vanessa.
Average asking prices in Auckland continue to fluctuate
Auckland’s average asking price dropped back 2.2% to $915,794, after a lift last month to $936,850.
“Following sharp drops in April and May which saw the average asking price dip below $900,000, the region has seen prices hover around the low 900s for most of this year,” says Vanessa.
Being New Zealand’s largest market, the Auckland region has the tendency to sway the national results, which is perhaps why we saw the national average asking price drop back 1.0% to $680,592 despite all the regional highs.
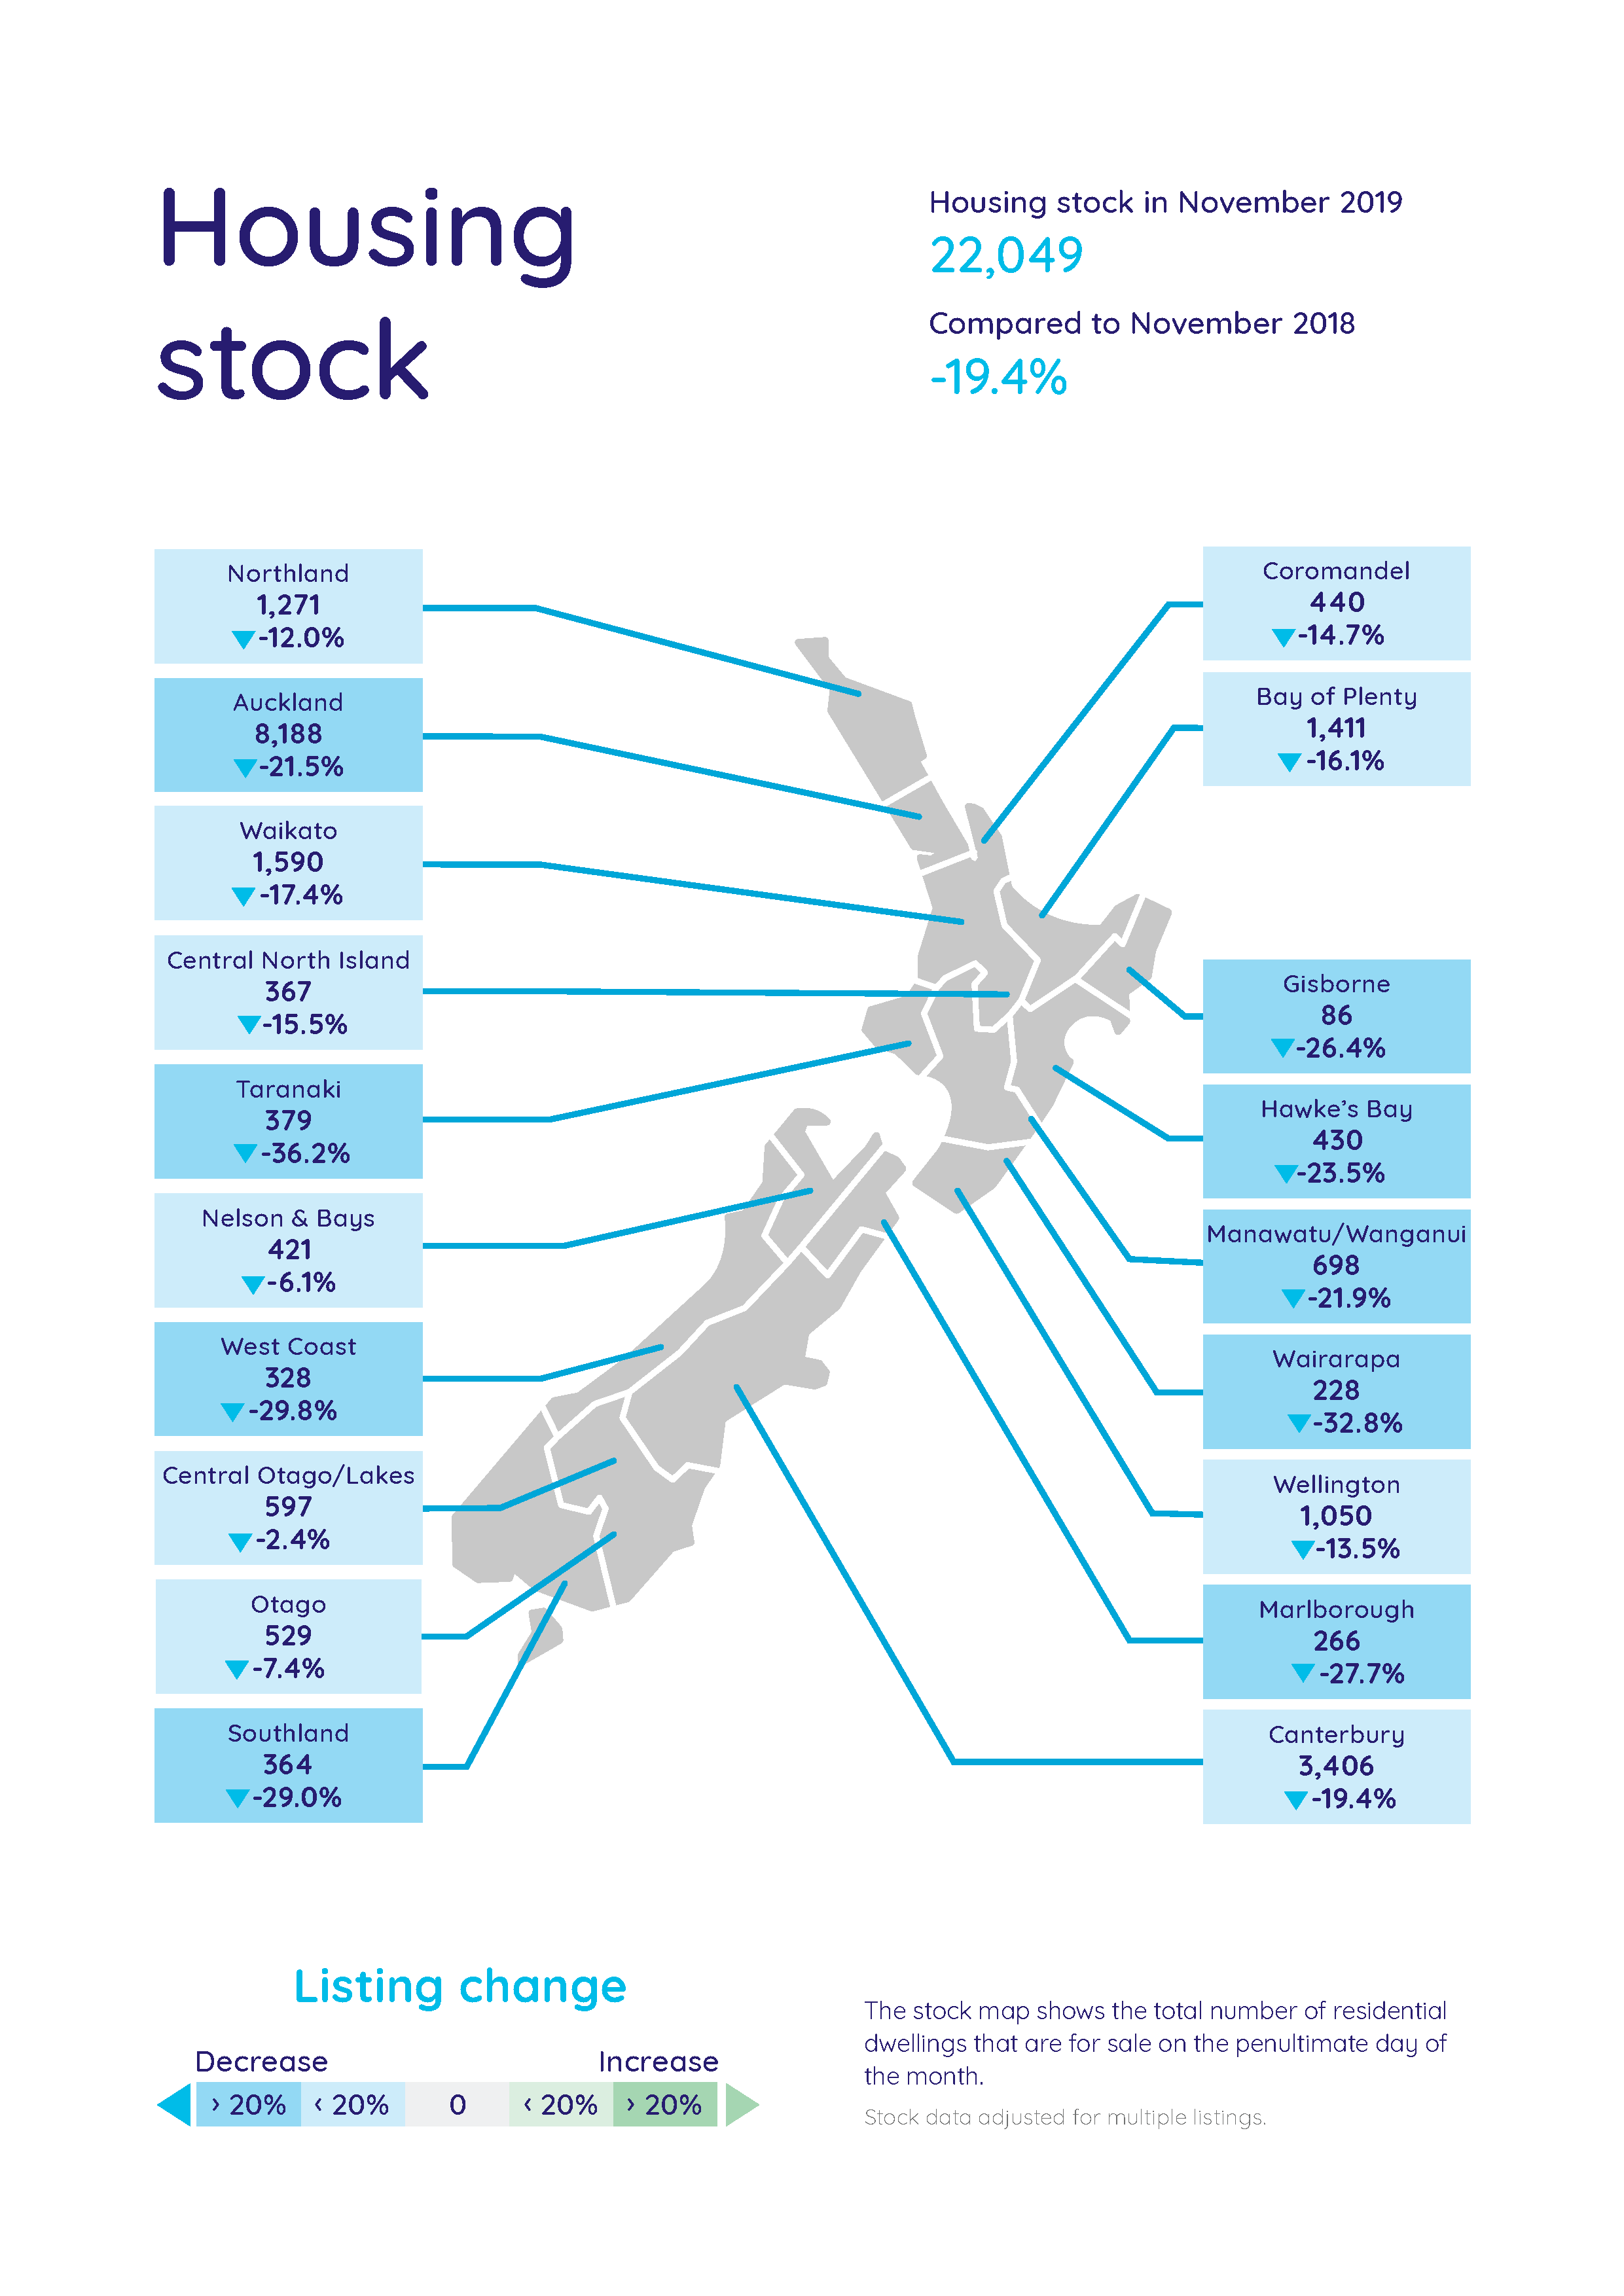
Minimal choice for home buyers with a near 20% decrease in total homes available for sale
Nationally, home buyers were limited for choice in November with a 19.4% decrease in the total homes available for sale compared to November 2018. None of realestate.co.nz’s 19 regions saw an increase in homes available for sale, which Vanessa says could be contributing to the asking price highs seen in eight regions during November.
“When there are fewer homes available for sale, there is usually increased competition between home buyers. People are often willing to pay a little bit more to make sure they get what they want.”
Vanessa says this looks to be true in the Taranaki region which saw an all-time low in total homes for sale for the first time in 13 years in November, with only 379 places available for sale – a 36.2% decrease compared to November 2018.
“The last time we saw a low in the region was in September 2018 when total homes available for sale was 525, so November’s drop was significant.”
“This might be a good time for homeowners in the region who are considering selling. Average asking prices in the region are sitting at healthy $450,611, up 4.2% from last month and 6.9% up from November 2018.”
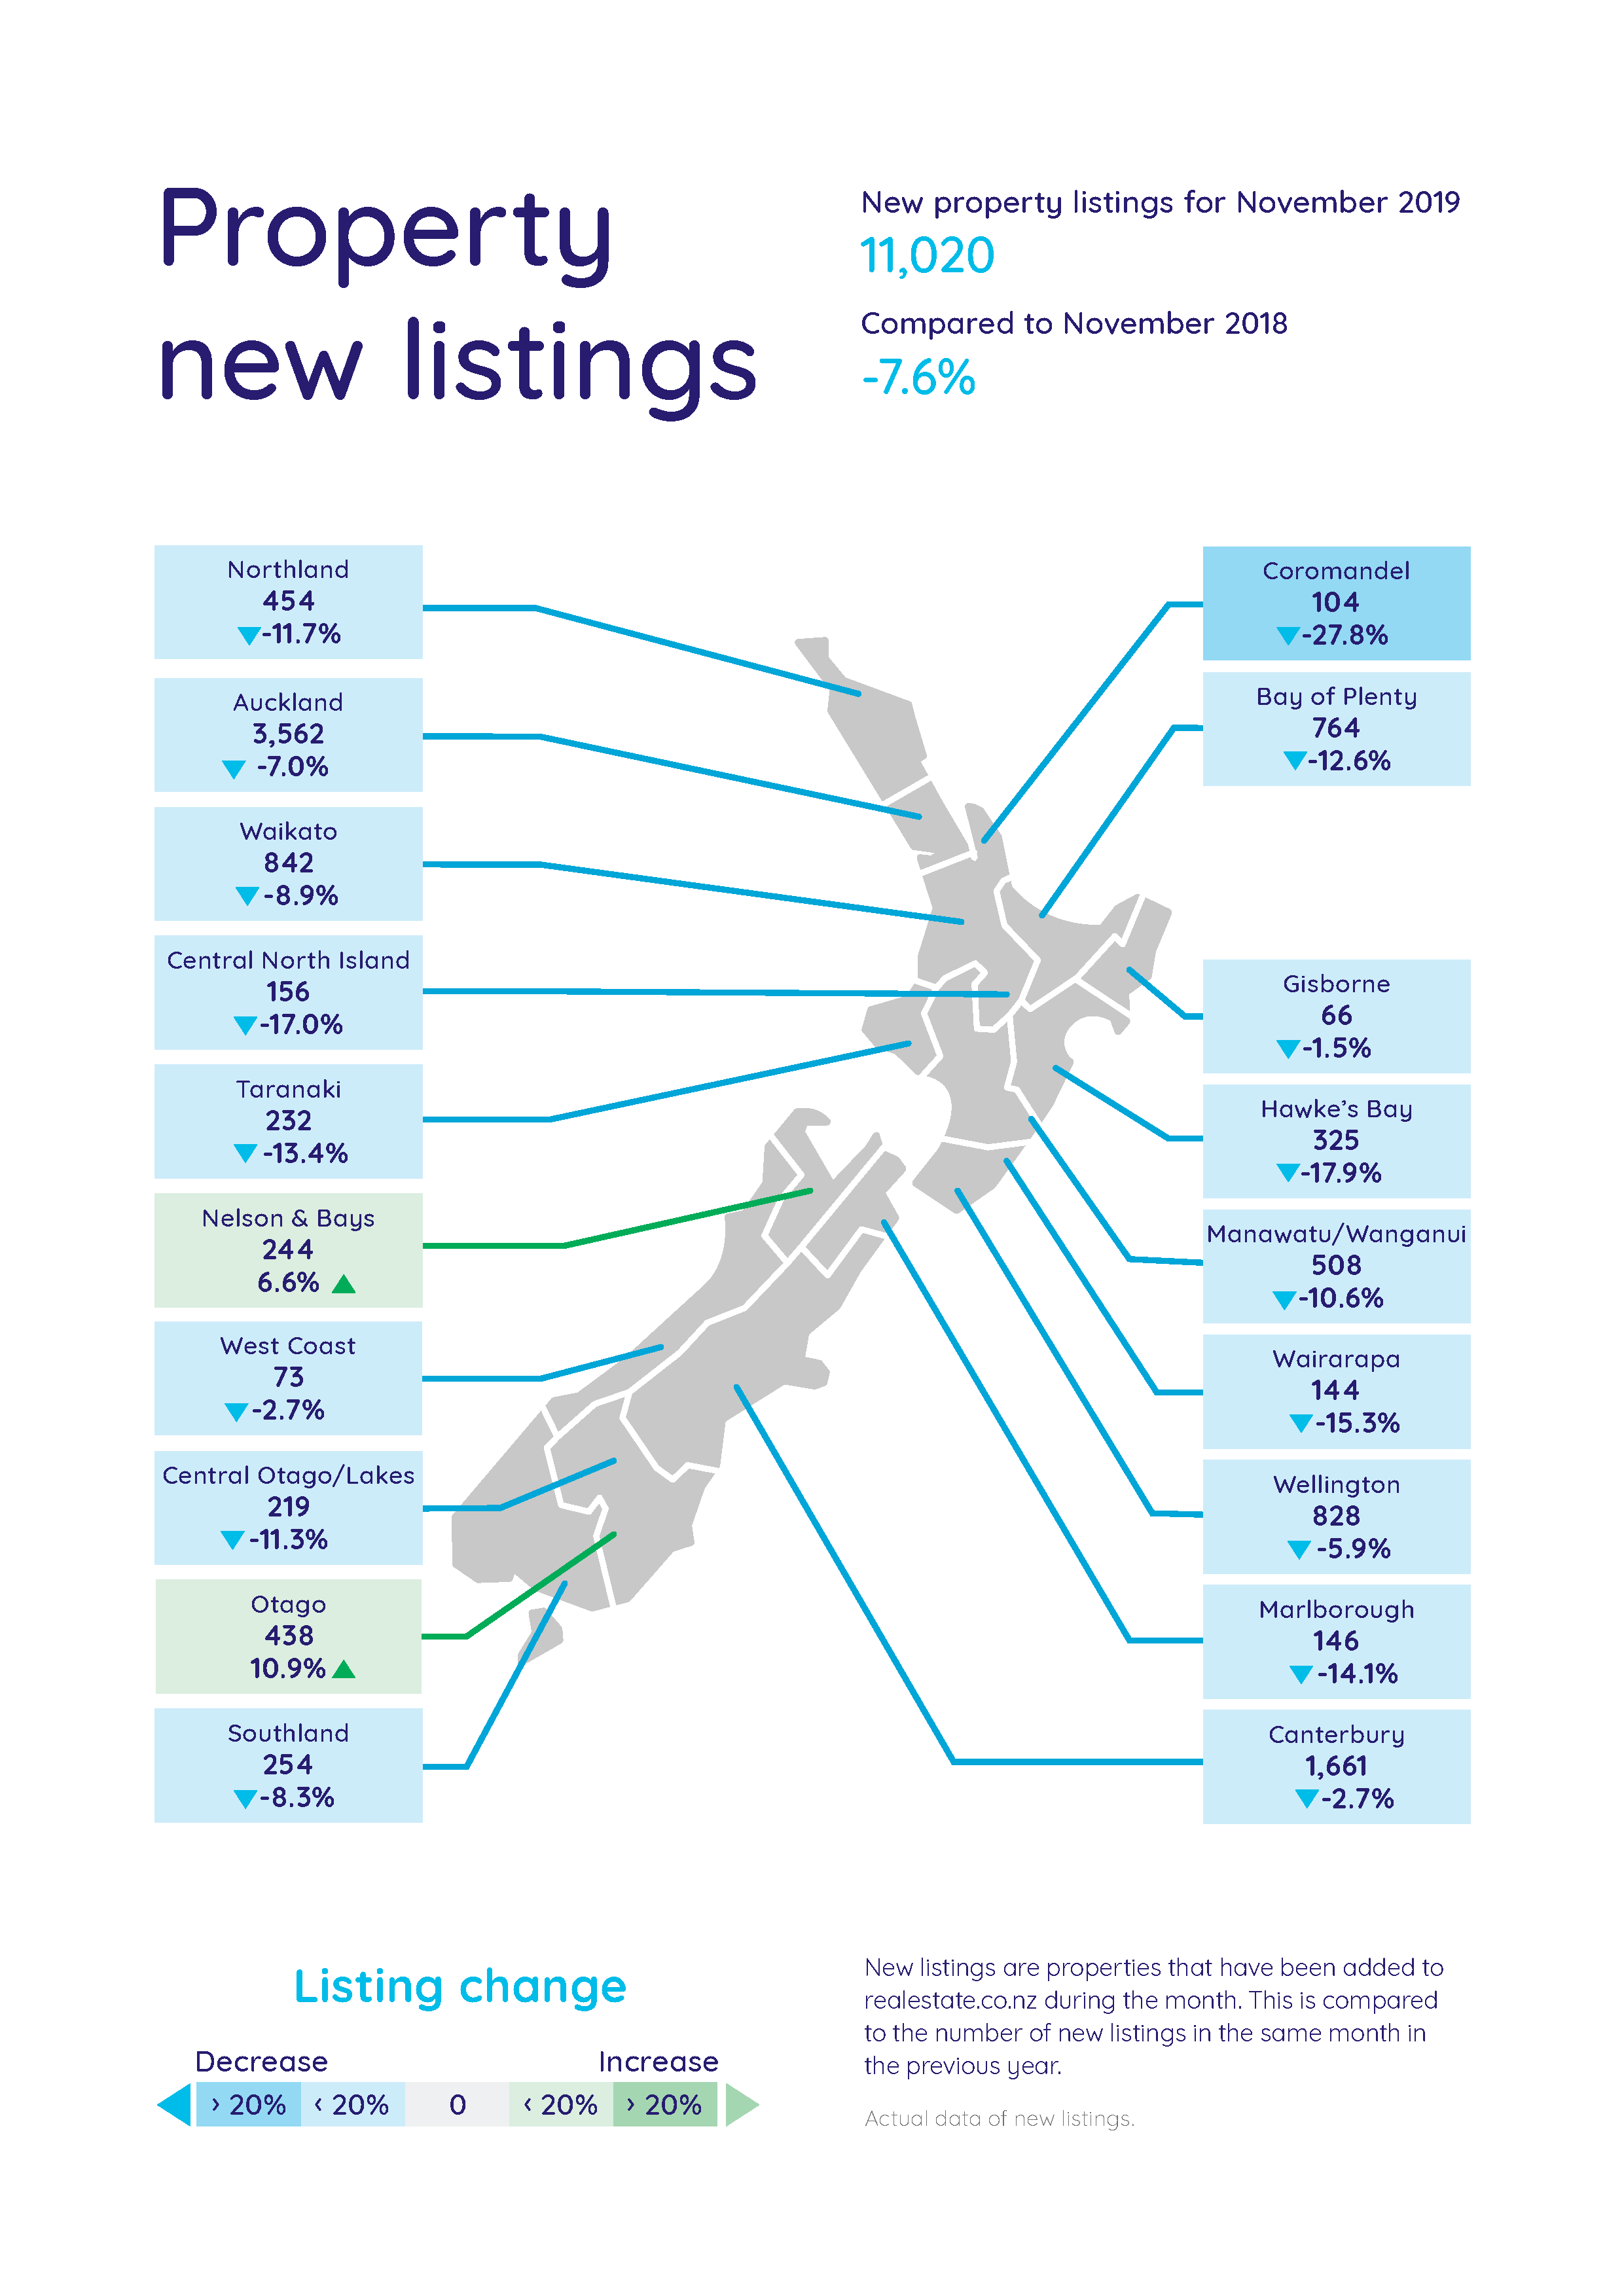
Kiwis appeared to be holding off on listing their homes during November
New listings followed a similar trend to the total homes available in November, with new listings down across the country. The only exceptions were Nelson & Bays and Otago, who saw increases compared to last year of 6.6% and 10.9% respectively.
Nationally new listings were down 7.6% suggesting that Kiwis were generally holding off on putting their homes on the market during November. This was a trend reflected in our major centres with Auckland, Wellington and Canterbury dropping 7.0%, 5.9% and 2.7% respectively compared to November 2018.
“It is fair to say that those who are looking to buy over the summer break may need to do a bit of digging and be patient with the small number of homes on the market at the moment. It will be very interesting to see what happens over December and into early 2020,” says Vanessa.
For media enquiries, please contact:
Trish Fitzsimons | 021 022 96927 | trish@realestate.co.nz
Glossary of terms:
As the only provider of real estate data in real-time, realestate.co.nz offers valuable property market information not available from other sources.
- Average asking price is not a valuation. It is an indication of current market sentiment. Statistically, asking prices tend to correlate closely with the sales prices recorded in future months when those properties are sold. As it looks at different data, average asking prices may differ from recorded sales data released at the same time.
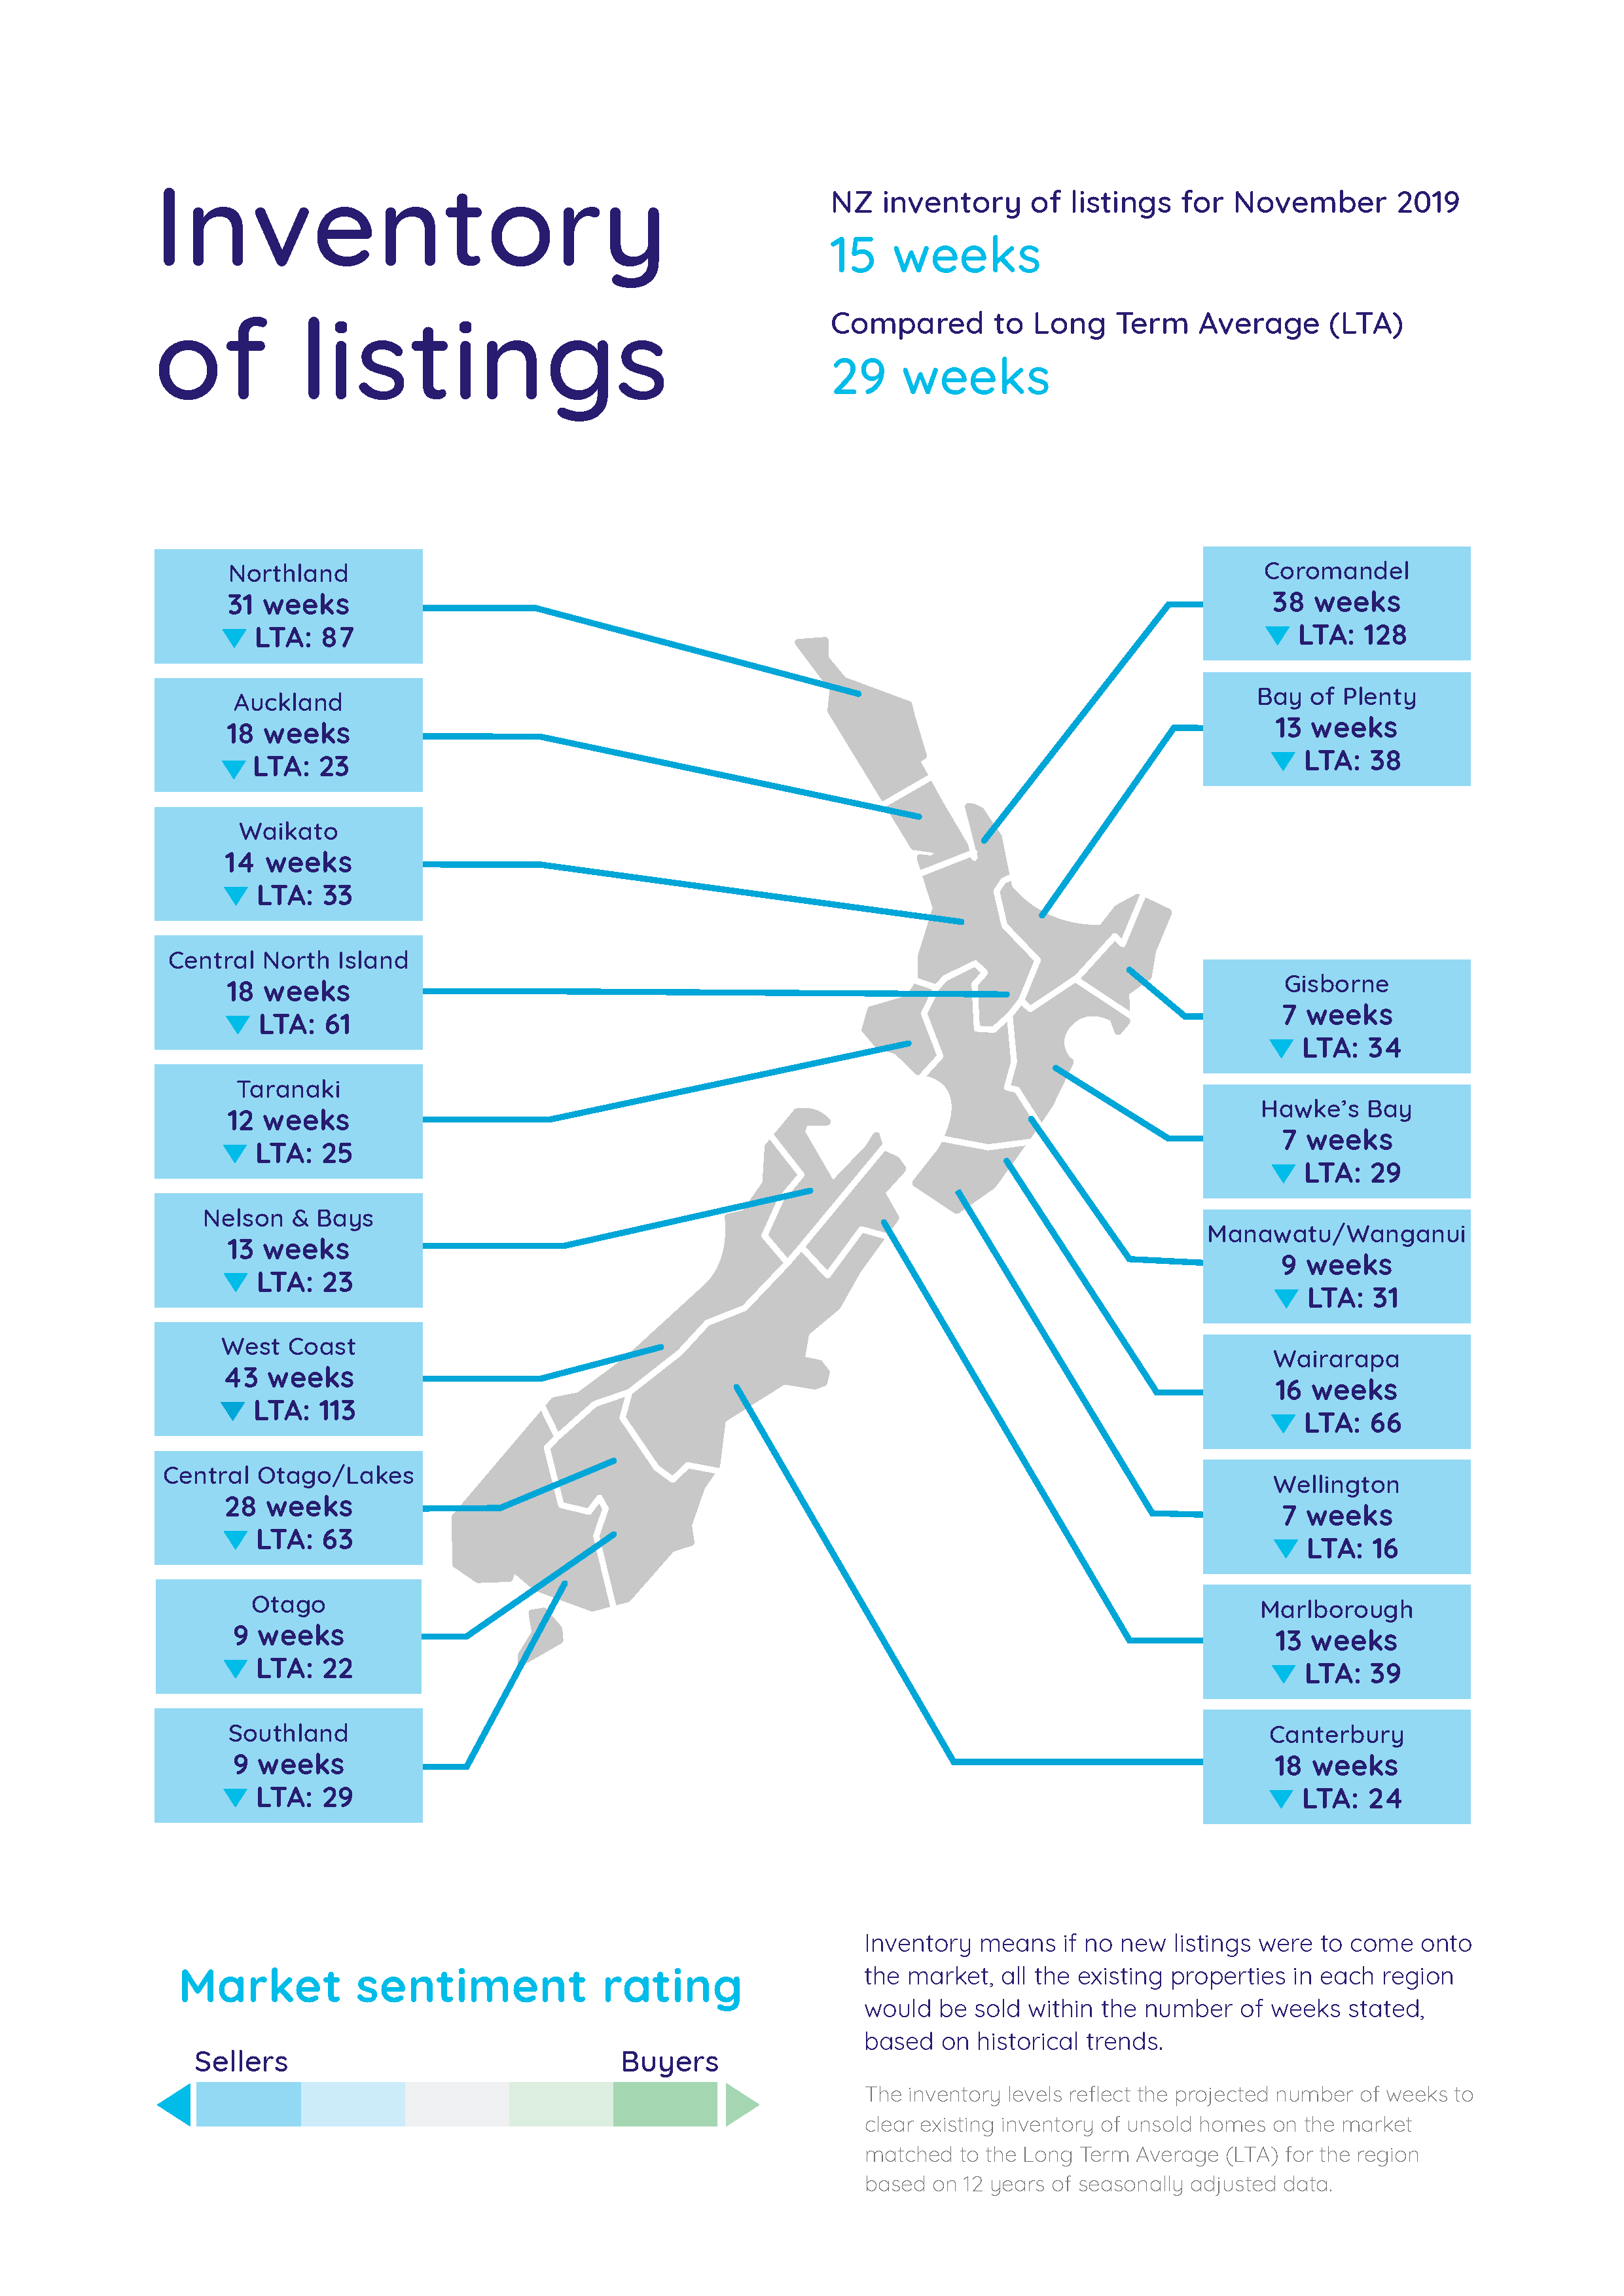
- Inventory is a measure of how long it would take, theoretically, to sell the current stock at current average rates of sale if no new properties were to be listed for sale. It provides a measure of the rate of turnover in the market.
- New listings are a record of all the new listings on realestate.co.nz for the relevant calendar month. As realestate.co.nz reflects 97% of all properties listed through registered estate agents in New Zealand, this gives a representative view of the New Zealand property market.
- Demand: the increase or decrease in the number of views per listing in that region, taken over a rolling three-month time frame, compared to the same three-month time frame the previous year – including the current month.
- Seasonal adjustment is a method realestate.co.nz uses to better represent the core underlying trend of the property market in New Zealand. This is done using methodology from the New Zealand Institute of Economic Research.
- Truncated mean is the method realestate.co.nz uses to provide statistically relevant asking prices. The top and bottom 10% of listings in each area are removed before the average is calculated, to prevent exceptional listings from providing false impressions.
Share
-
.svg)
.svg)
.svg)