
.svg)


We’ve seen stable prices nationally, with new ‘buyers’ markets’ in four regions across the country. New property listings have also risen in all but four regions, which is good news for property seekers.
With four new buyers’ markets emerging and the national average asking price stable in June 2020, real-time data from realestate.co.nz suggests that the New Zealand property market has remained buoyant post-COVID-19.
Vanessa Taylor, spokesperson for realestate.co.nz, says that with new property listings up in nearly all regions last month, it looks like Kiwis aren’t shying away from selling property.
“Often in times of uncertainty, those who can hold off on selling will, as they wait to see what the future holds.”
“But with new listings up and prices stable – it looks like Kiwis are still selling and, in most regions, that they have not significantly lowered their price expectations,” says Vanessa.
New property listings through the roof in all but four regions
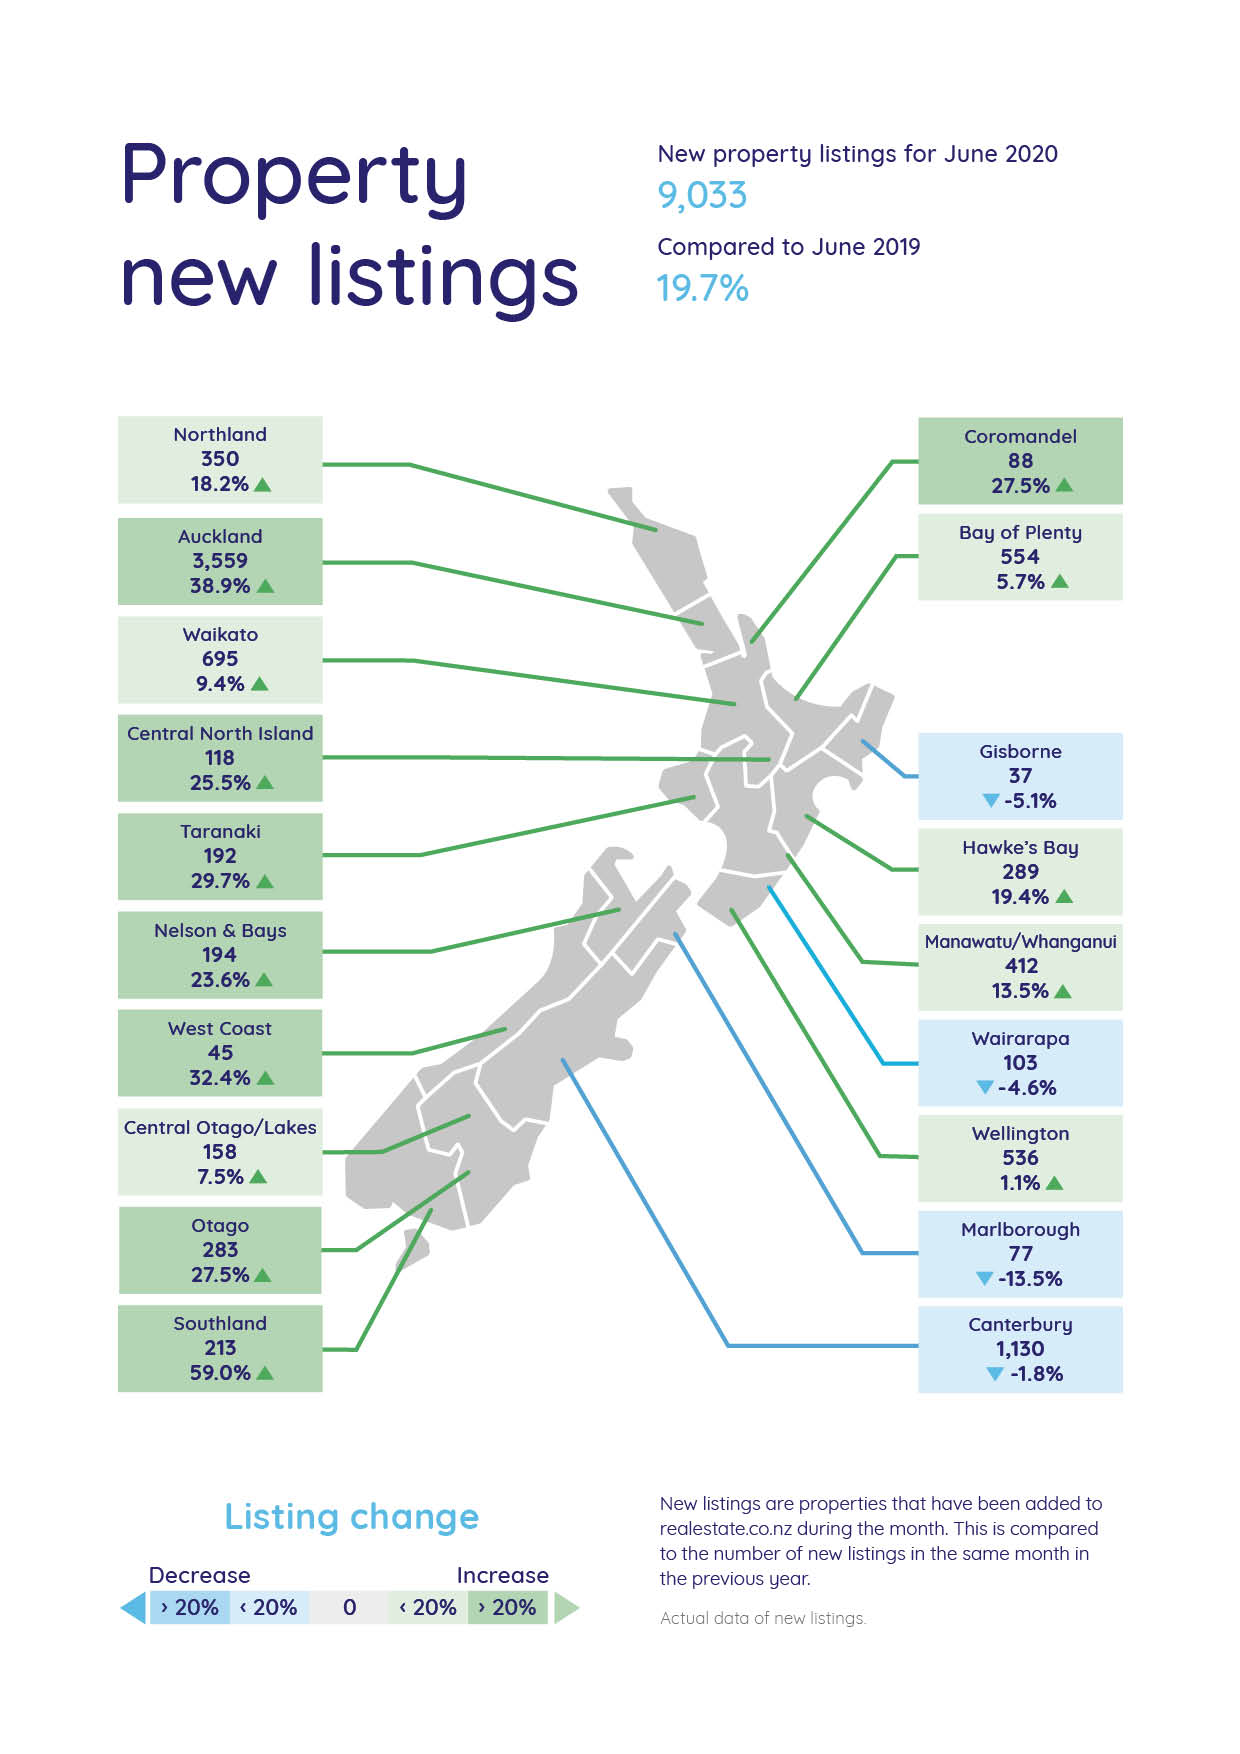
Despite an unavoidable decline in new listings coming onto the market during the lockdown, new property listings bounced back right across the country in June – up 19.7% on the same time last year.
Southland, Auckland, and the West Coast saw the biggest increases to new listings by 59.0%, 38.9% and 32.4% respectively, when compared to June 2019.
The only regions to see new listings decrease were Gisborne, Wairarapa, Marlborough and Canterbury. However, when we look at the numbers, these decreases were relatively small, says Vanessa.
“In Gisborne, there were just two fewer properties listed last month than in June 2019 and in the Wairarapa, just five fewer new listings.”
“Overall, what the national increase in new listings tells us is that the market is not slowing down. Vendors have been busy preparing their properties and have wasted no time in getting their homes on the market,” says Vanessa.
Property prices remain stable – with 13-year highs in three regions
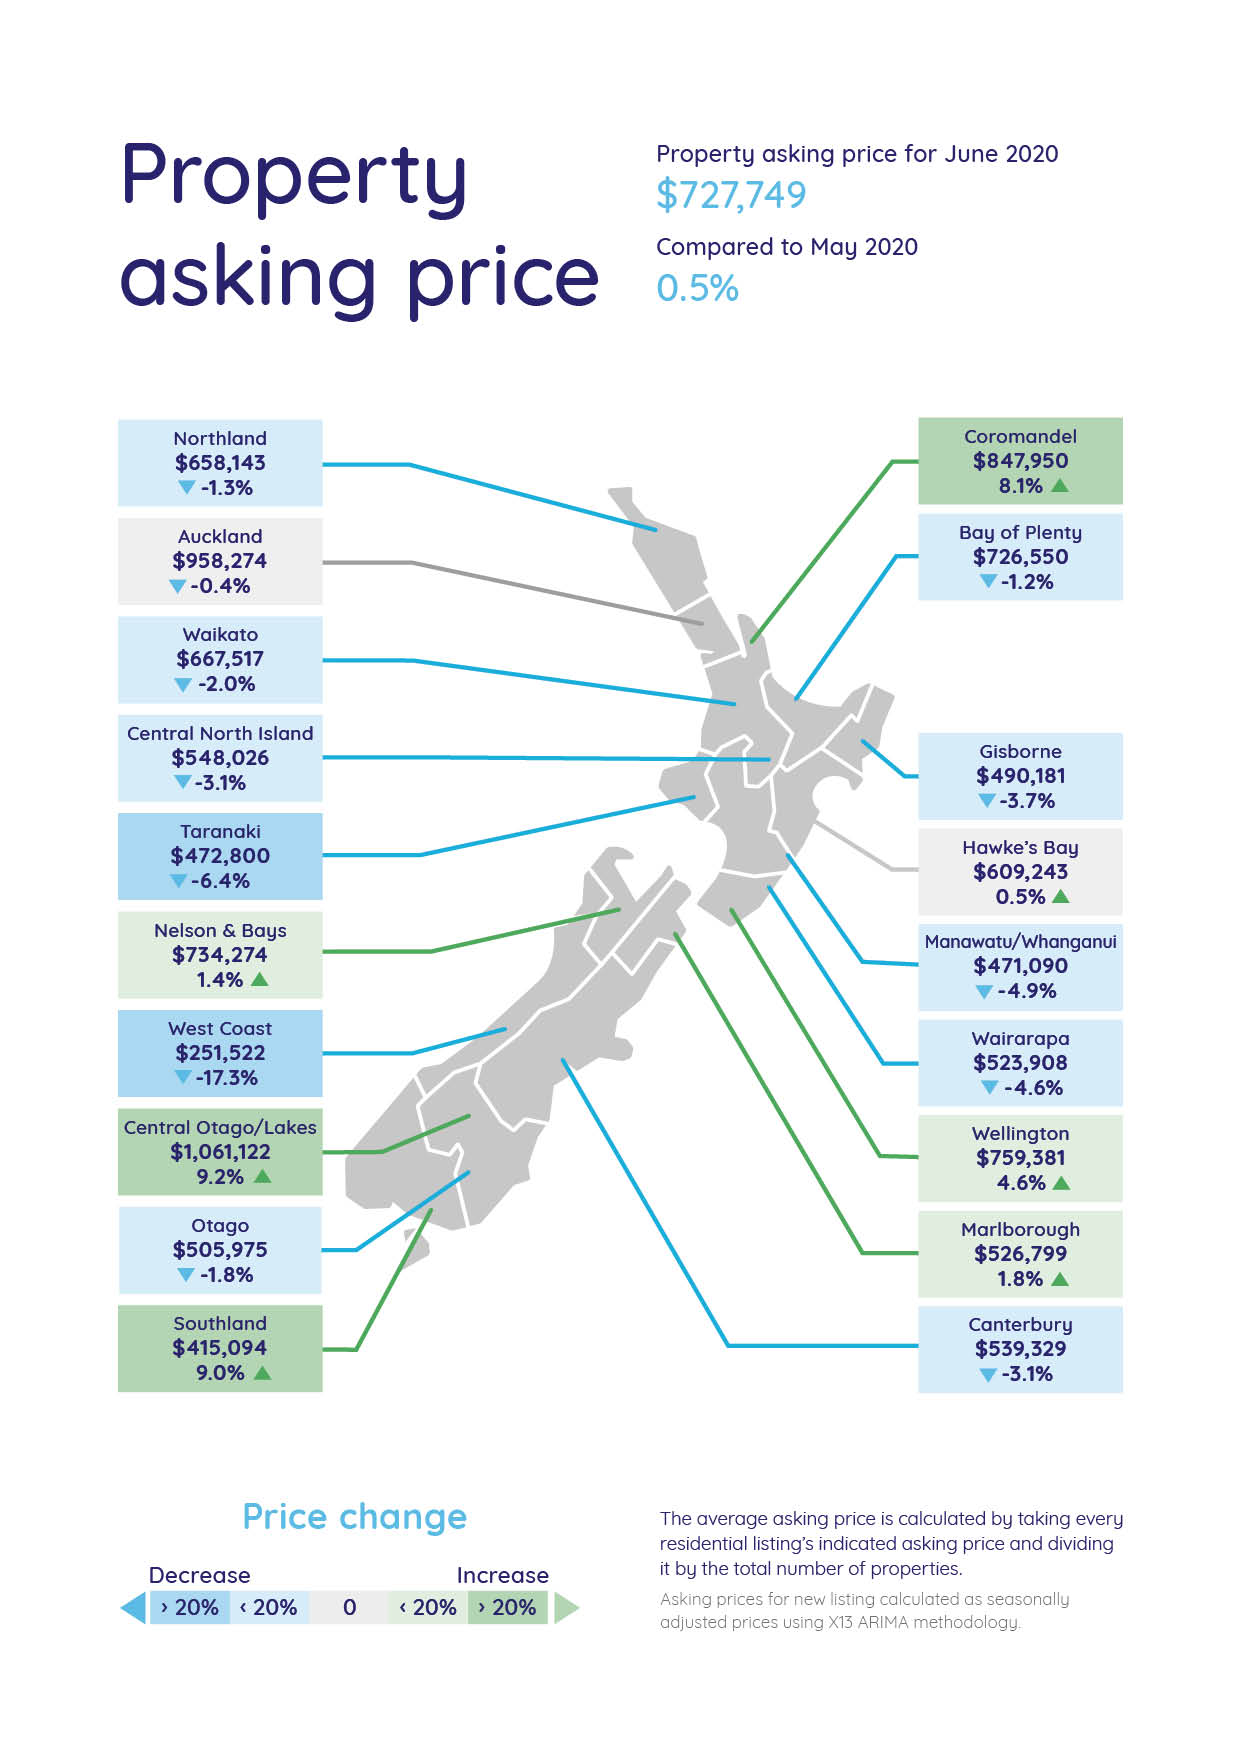
Property prices remained stable in June with the national average asking price sitting at $727,749 – a marginal increase of 0.5% compared to May 2020 and 10.4% higher than in June 2019.
Bucking the national trend, however, all-time asking price highs were reached in the Coromandel, Southland, and the Hawke’s Bay.
The average asking price rose above $800,000 for the first time in the Coromandel, to $847,950 – a 14.3% increase on the same time last year and a significant jump on the region’s last recorded high of $786,037 in April 2019.
In Southland, the average asking price was up 18.4% on the same time last year to $415,094 – tipping over $400,000 for the first time since records began in 2007.
In the Hawke’s Bay, the average asking price hit an all-time high of $609,243 – a marginal increase on last month’s high of $606,136 but a reasonable 12.3% increase on June 2019.
“It is promising to see that despite the challenges many Kiwis are facing in 2020, we didn’t see price expectations drop in too many of our regions during June.”
“All-time asking price highs and year on year increases in 17 of our 19 regions will be encouraging for those thinking of selling,” says Vanessa.
Buyers’ markets emerge in four of 19 regions
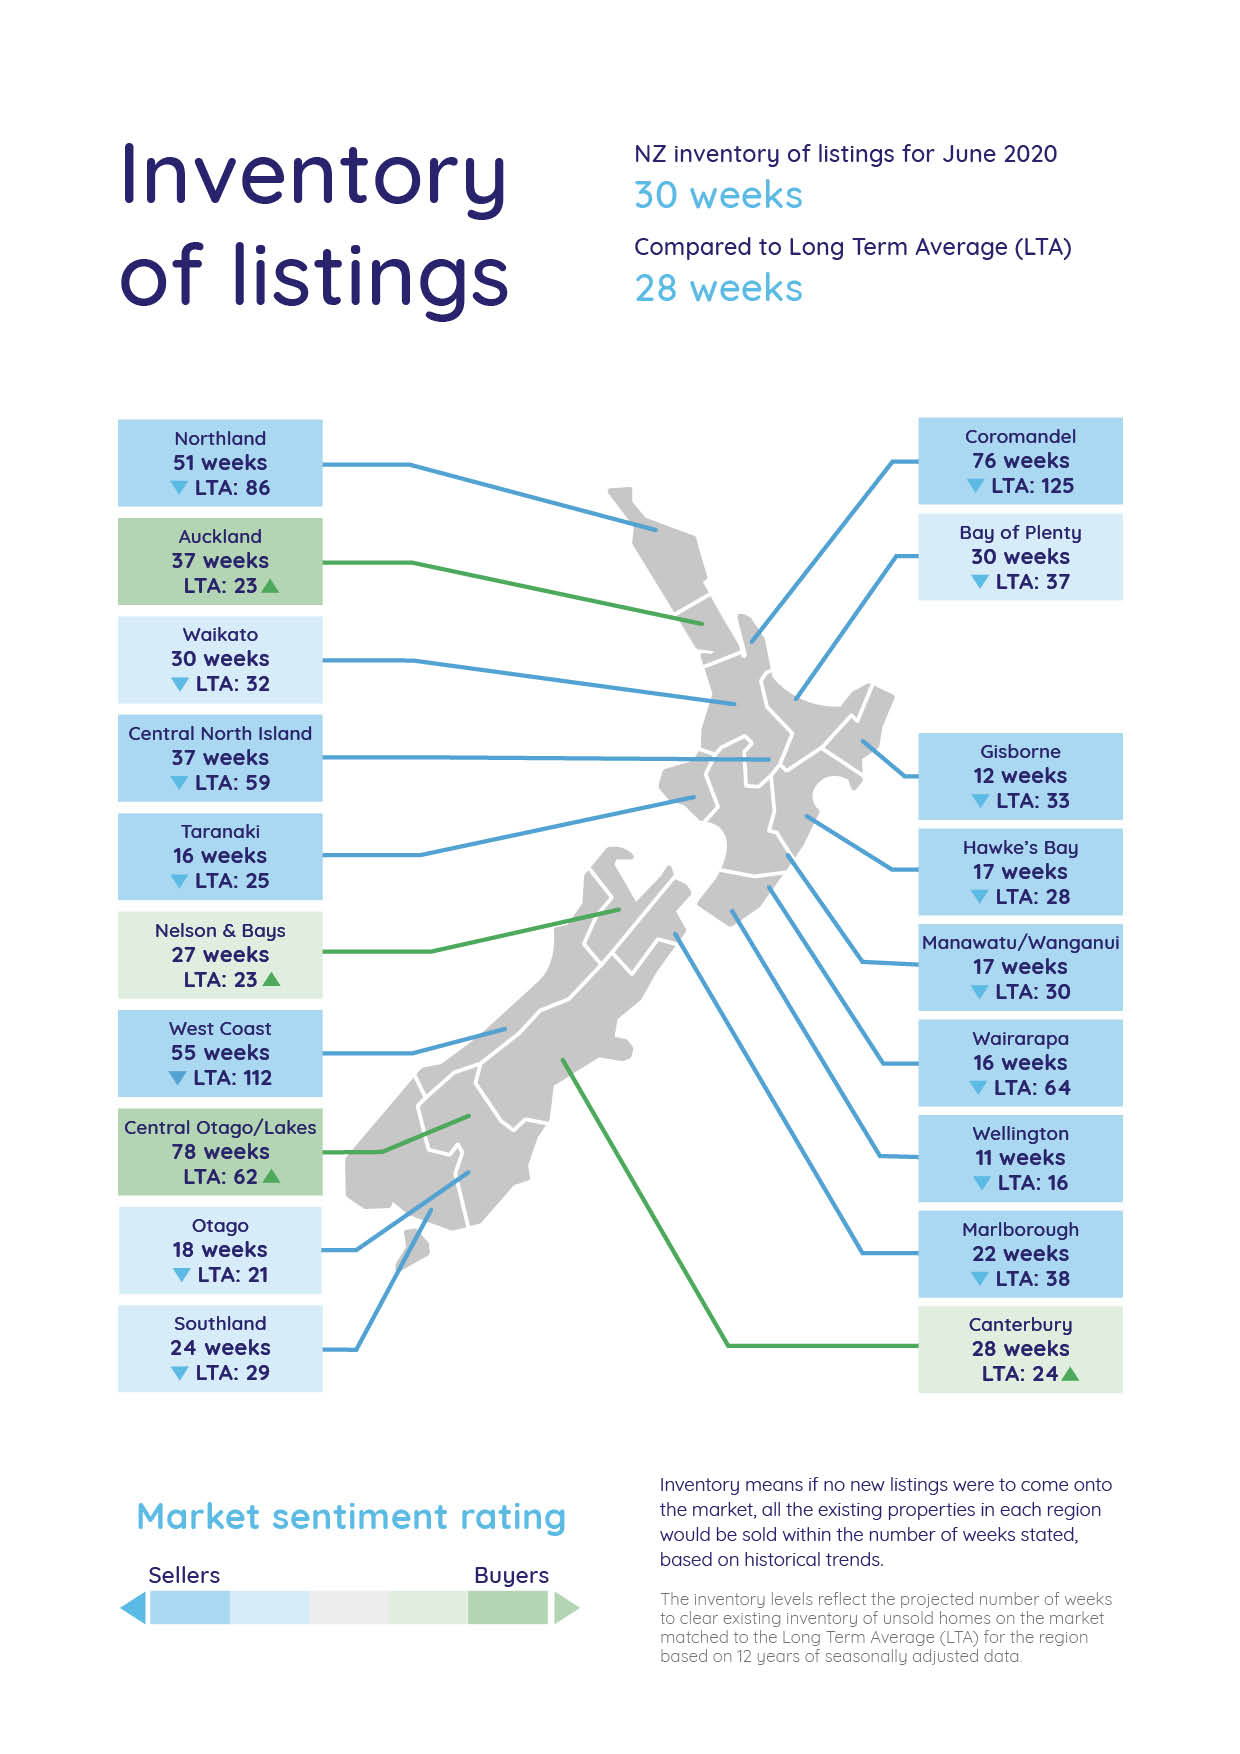
Inventory data from realestate.co.nz shows that buyers’ markets have emerged in Auckland, Nelson & Bays, Canterbury, and Central Otago/Lakes during June.
Vanessa says that inventory is a measure of how long it would take, theoretically, to sell all current stock at the current rate of sale if no new properties were to be listed on the market.
“Inventory data indicates the turnover in the market. When inventory is higher than the 13-year long-term-average, it tells us that there is more stock available than people buying property, and this signals a buyers’ market.”
Vanessa says that theoretically, if no new listings came onto the market in Auckland and all existing stock that was listed on realestate.co.nz was sold, there would be no houses for sale in 37 weeks which has overtaken the long-term average (of 23 weeks) – making it a buyers’ market.
This is the first time many of these regions have experienced buyers’ markets in several years. The last time we saw a buyers’ market in Auckland was July 2019, in Nelson & Bays October 2014, in Canterbury July 2011*, and the last time that Central Otago/Lakes saw a buyers’ market was January 2012.
Vanessa says that a slowdown in sales is typically good news for buyers and, in these regions, might spell a move away from the competitive, multi-offer sales we have often seen in recent years.
“This might be a good time for potential buyers in these regions to start seriously looking,” says Vanessa.
*Canterbury earthquakes may have been a factor here, however, data shows that the region was in a buyers’ market in the lead up to the earthquakes.
Spotlight on the Hawke’s Bay
The average asking price in the Hawke’s Bay has been steadily rising over the last two years, with the average asking price increasing by almost $100,000 from $516,524 in June 2018 to $609,243 in June 2020. With the average asking price sitting above $600,000 for the third consecutive month, Vanessa says it will be interesting to see if prices can be maintained in the region or if they drop back to the mid-high $500,000’s.
“Inventory in the region is low – just 17 weeks compared to the 13-year long-term average of 28 weeks - which indicates the region is currently a strong sellers’ market,” says Vanessa.
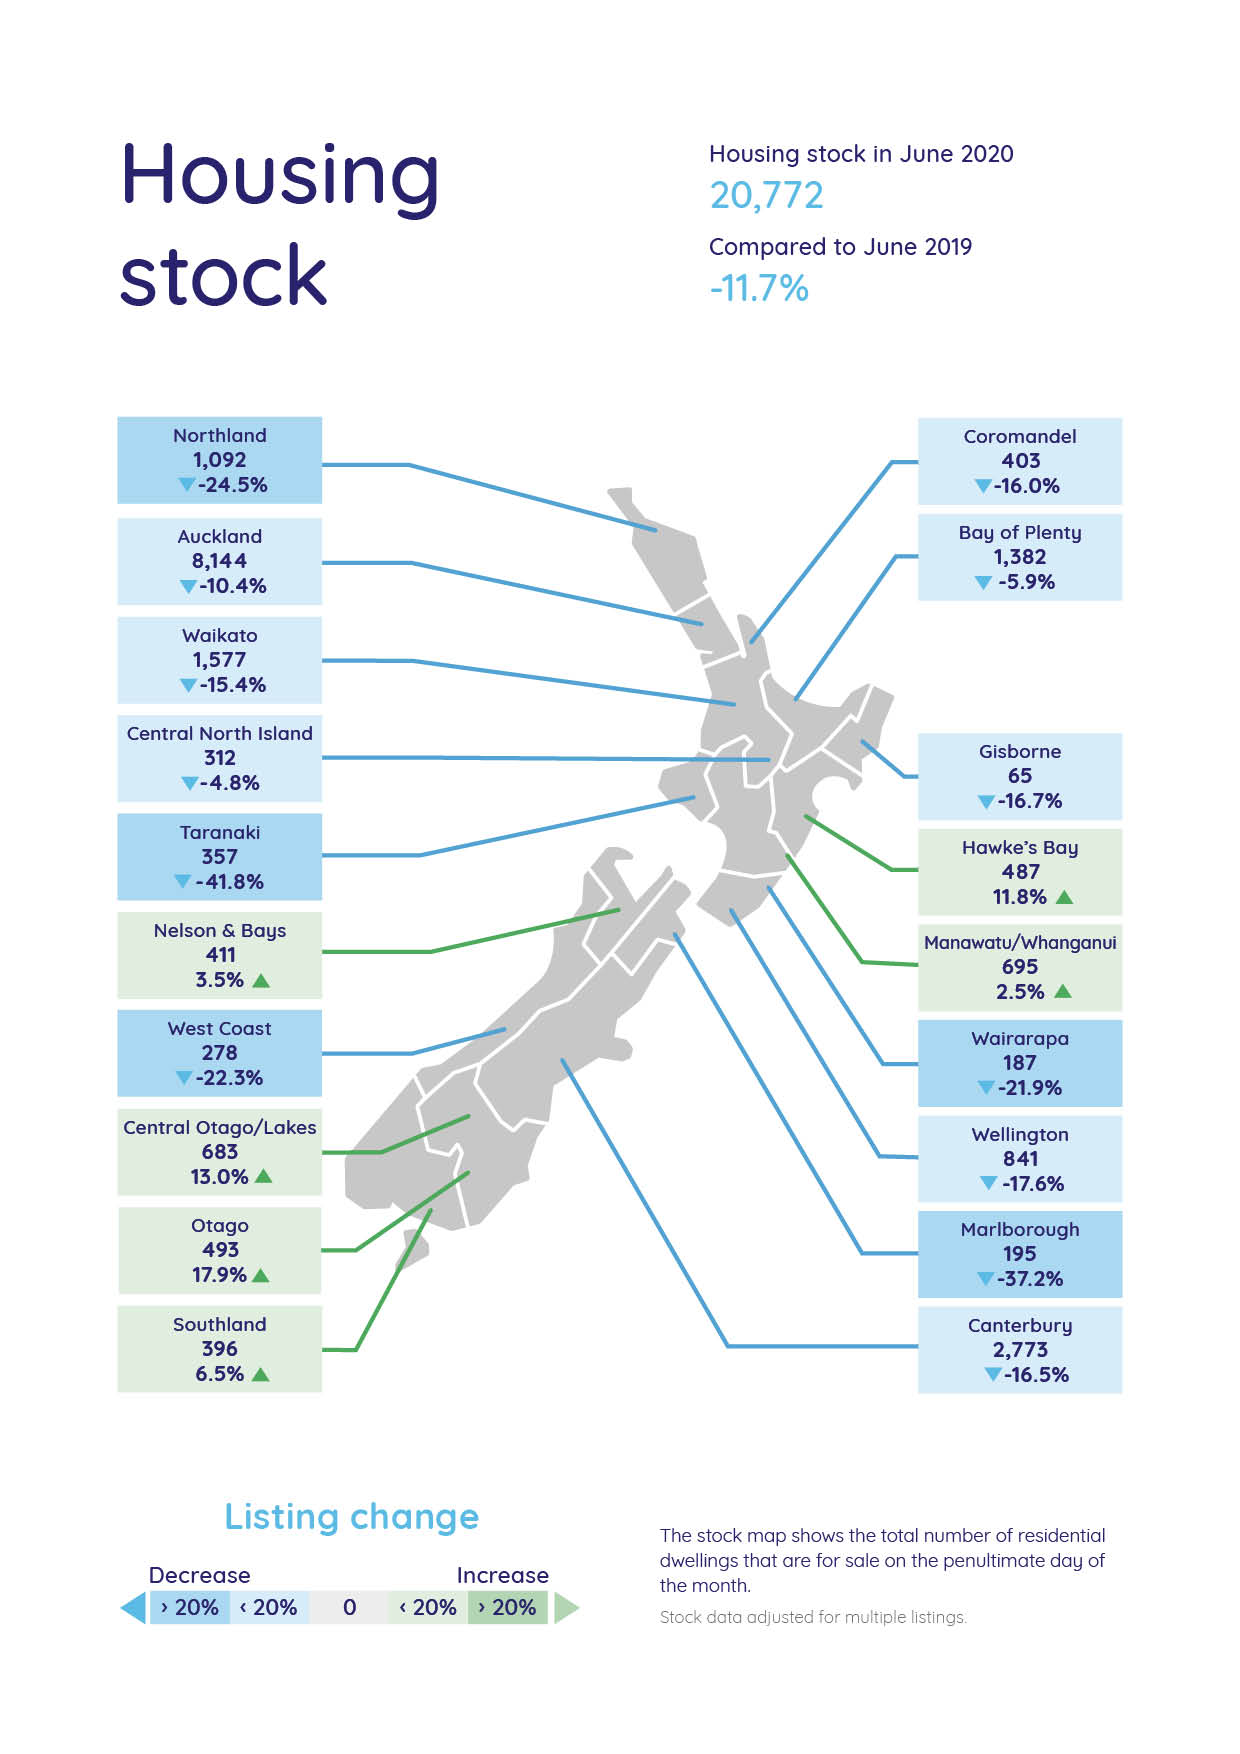
However, with new listings coming onto the market up 19.4% on June 2019 and total stock also up 11.8% on the same time last year, Vanessa says she is reluctant to predict what will happen next.
“If COVID-19 can teach us anything, it is that we don’t know what is around the corner. We can make predictions based on the ‘checkmark’ recoveries we have in the USA and UK property markets, but it is all speculation until we have the data to back it up,” says Vanessa.
User data from realestate.co.nz shows that the most popular suburbs searched in the region are Havelock North, Taradale and Napier Hill. The majority of users looking in this region were based within the Hawke’s Bay, followed by Aucklanders and then Wellingtonians.
About realestate.co.nz
Established before Google, in 1996, realestate.co.nz is New Zealand’s longest-standing property site. With residential, lifestyle, rural and commercial property listings available, realestate.co.nz is the place where serious buyers look for property. Dedicated to property, realestate.co.nz has no private sales and has search functionality that’s second to none to get you to your perfect property faster.
Glossary of terms:
As the only provider of real estate data in real-time, realestate.co.nz offers valuable property market information not available from other sources.
- Average asking price is not a valuation. It is an indication of current market sentiment. Statistically, asking prices tend to correlate closely with the sales prices recorded in future months when those properties are sold. As it looks at different data, average asking prices may differ from recorded sales data released at the same time.
- Inventory is a measure of how long it would take, theoretically, to sell the current stock at current average rates of sale if no new properties were to be listed for sale. It provides a measure of the rate of turnover in the market.
- New listings are a record of all the new listings on realestate.co.nz for the relevant calendar month. As realestate.co.nz reflects 97% of all properties listed through registered estate agents in New Zealand, this gives a representative view of the New Zealand property market.
- Demand: the increase or decrease in the number of views per listing in that region, taken over a rolling three-month time frame, compared to the same three-month time frame the previous year – including the current month.
- Seasonal adjustment is a method realestate.co.nz uses to better represent the core underlying trend of the property market in New Zealand. This is done using methodology from the New Zealand Institute of Economic Research.
- Truncated mean is the method realestate.co.nz uses to provide statistically relevant asking prices. The top and bottom 10% of listings in each area are removed before the average is calculated, to prevent exceptional listings from providing false impressions.
Share
-
.svg)
.svg)
.svg)