
.svg)


Provincial regions’ strong performance contributes to a lift in national average asking prices, while the Auckland region’s average asking price lifts for the second month in a row. All-time asking price highs for Taranaki, Otago, Southland and Hawke’s Bay regions. Hawke’s Bay hits the property trifecta.
Download the full New Zealand Property Report as a PDF.
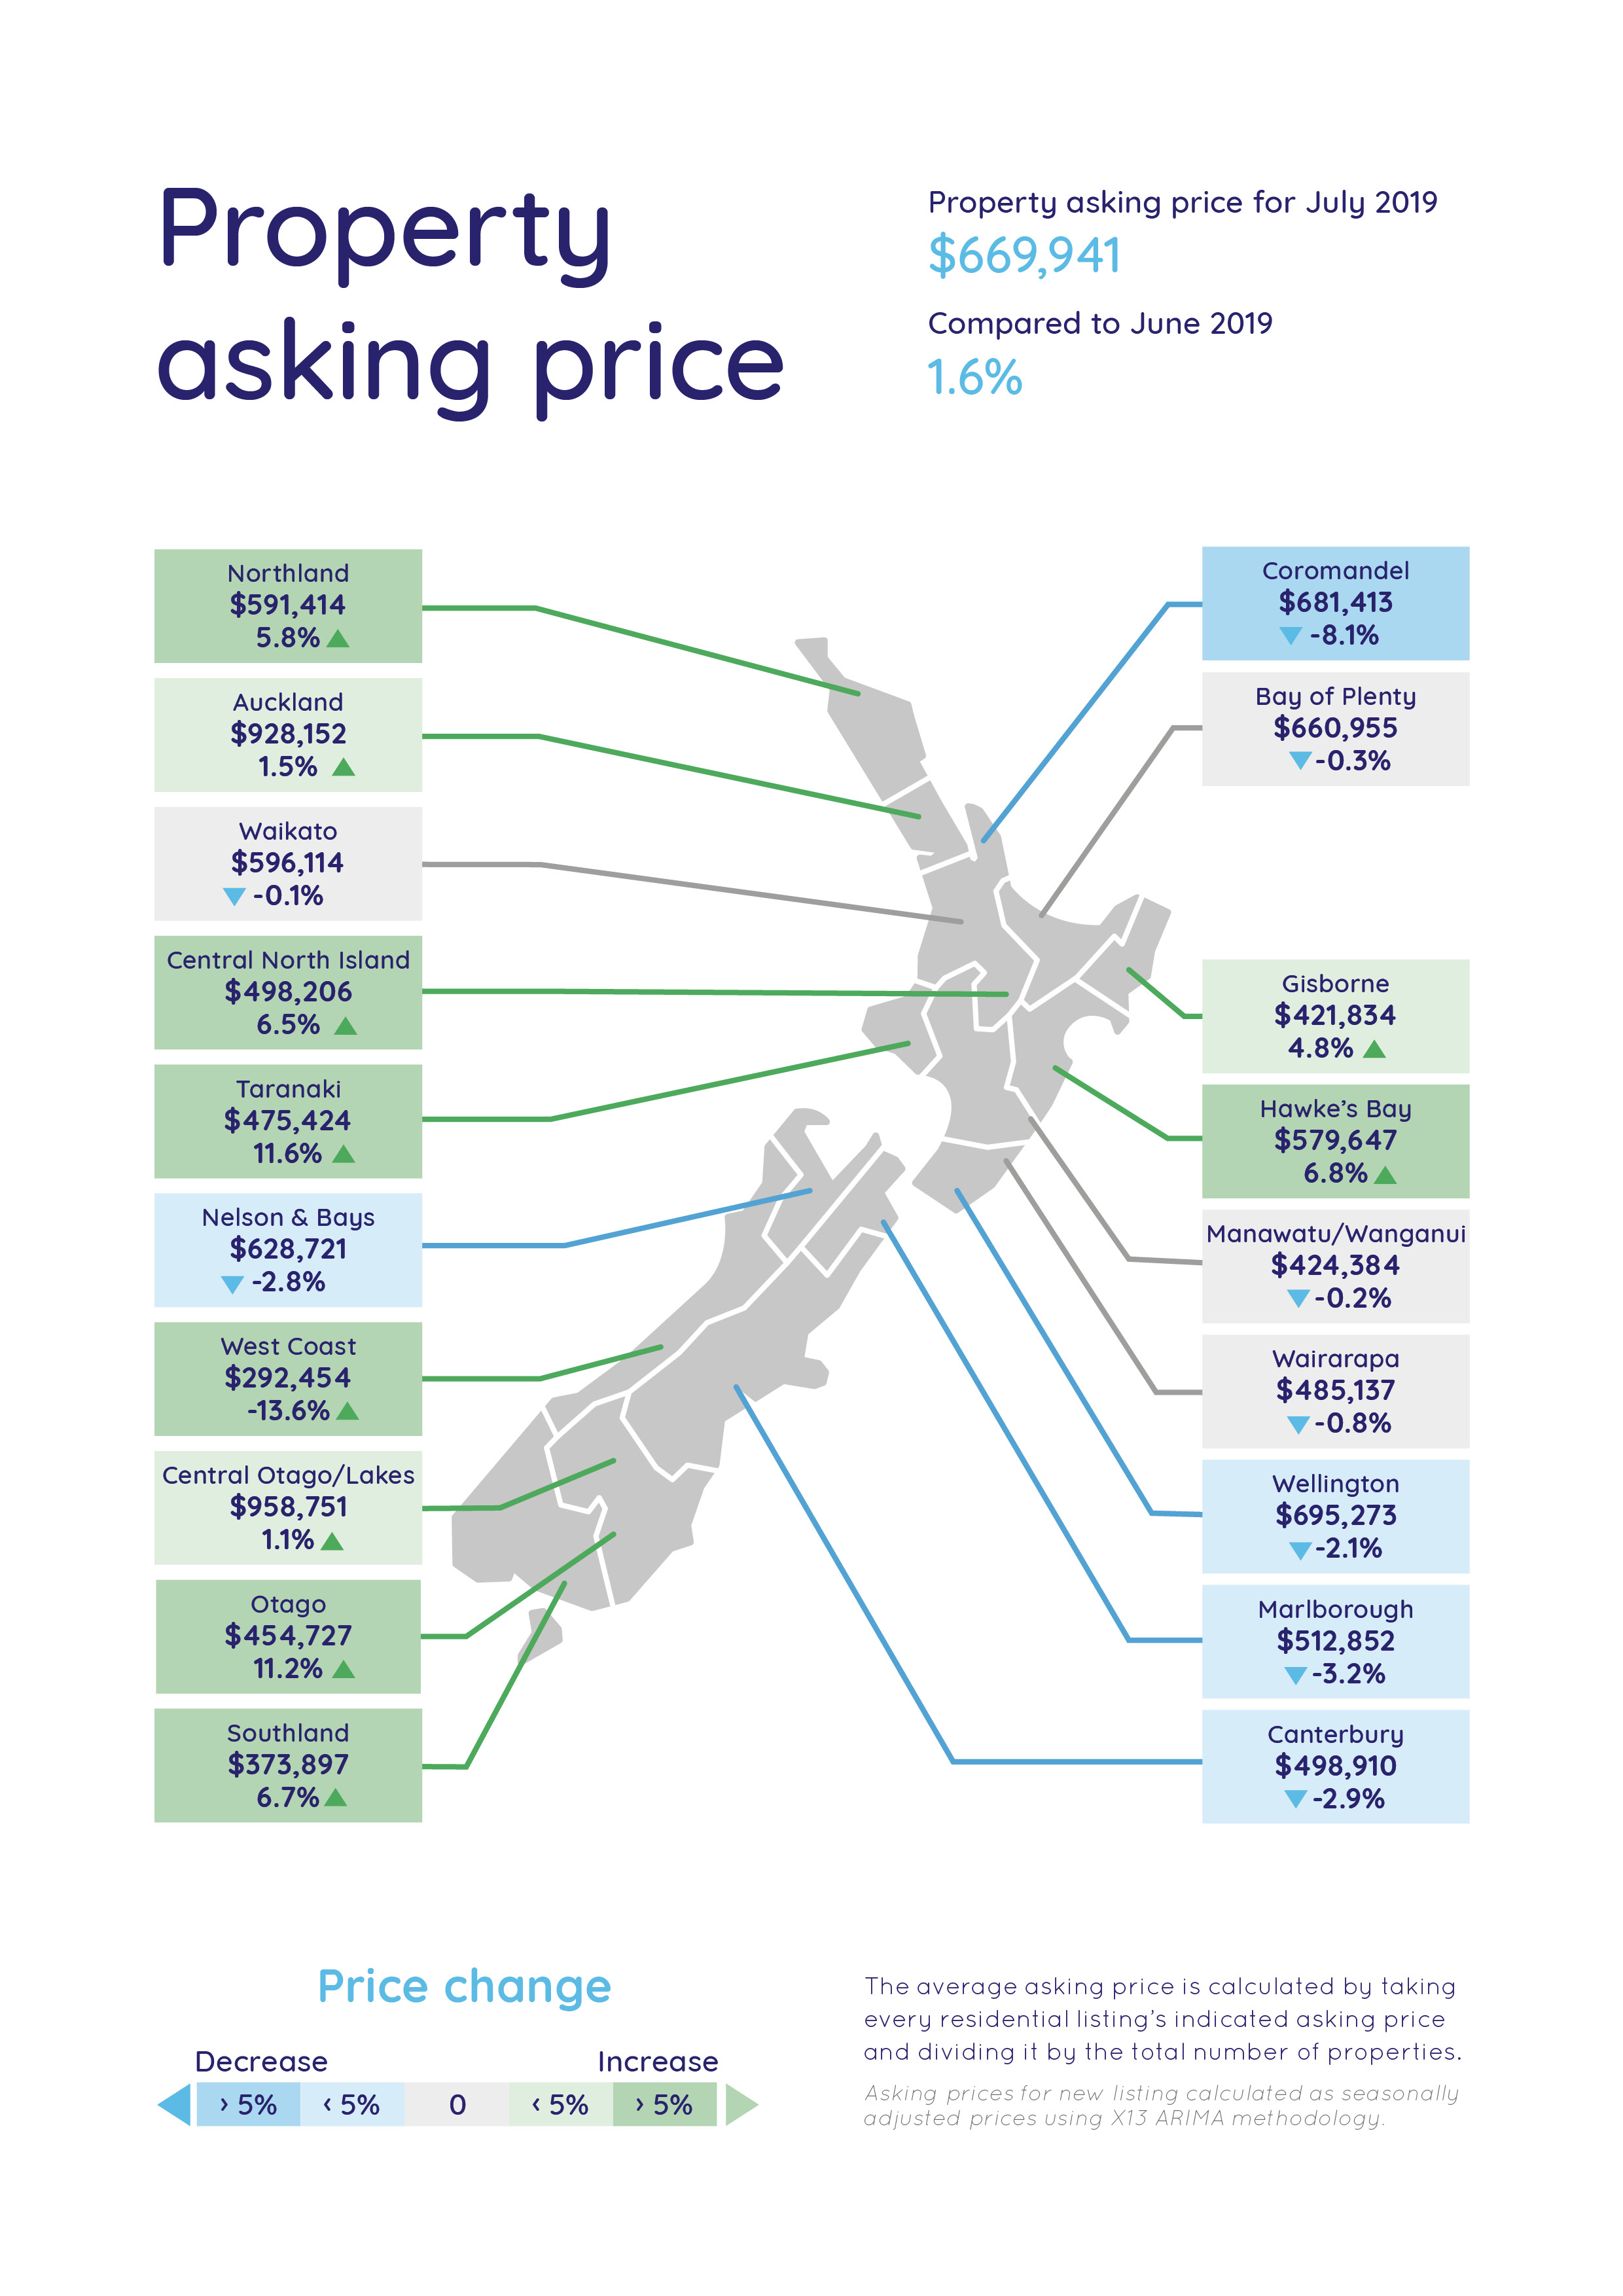
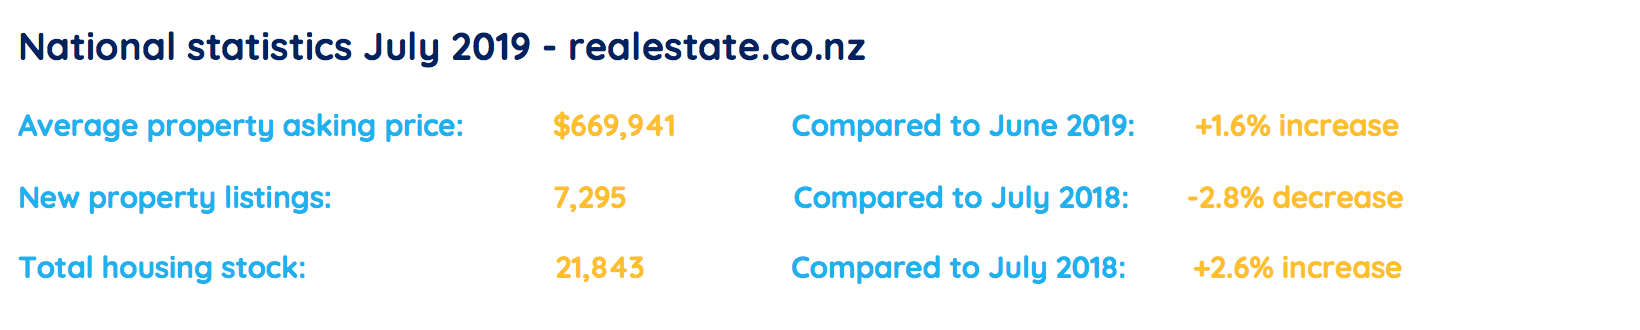
Real-time statistics from realestate.co.nz show the lift in July’s national average asking price for a home (up 1.6% to $669,941) was dominated by the provincial regions.
The site saw all-time asking price highs in the Taranaki, Otago, Southland and Hawke’s Bay regions since records began in 2007.
“We are a long way from the peak of the heated property market when it was all about the Auckland region,” says realestate.co.nz spokesperson Vanessa Taylor.
“However, we can’t ignore the fact that the Auckland region is our biggest market and with the average asking price lifting for the second month in a row, we’ll be watching with interest to see what happens during the rest of this quarter,” she says.
In July, the Auckland region’s average asking price was up 1.5% compared to June 2019, lifting to $928,152.
“That’s still some way off the region’s 2019 peak average asking price of $960,715 in February, which is traditionally an active property month,” says Vanessa.
All-time asking price highs for Taranaki, Otago, Southland and Hawke’s Bay regions -
The Taranaki region’s all-time asking price high in July, was coupled with a significant fall in new listings.
The average asking price was $475,424 in July, up 11.6% on June 2019.
“For two months in a row, new listings have been scarce in the Taranaki region. It was a similar picture in June and July last year, but listings are even fewer this year,” says Vanessa.
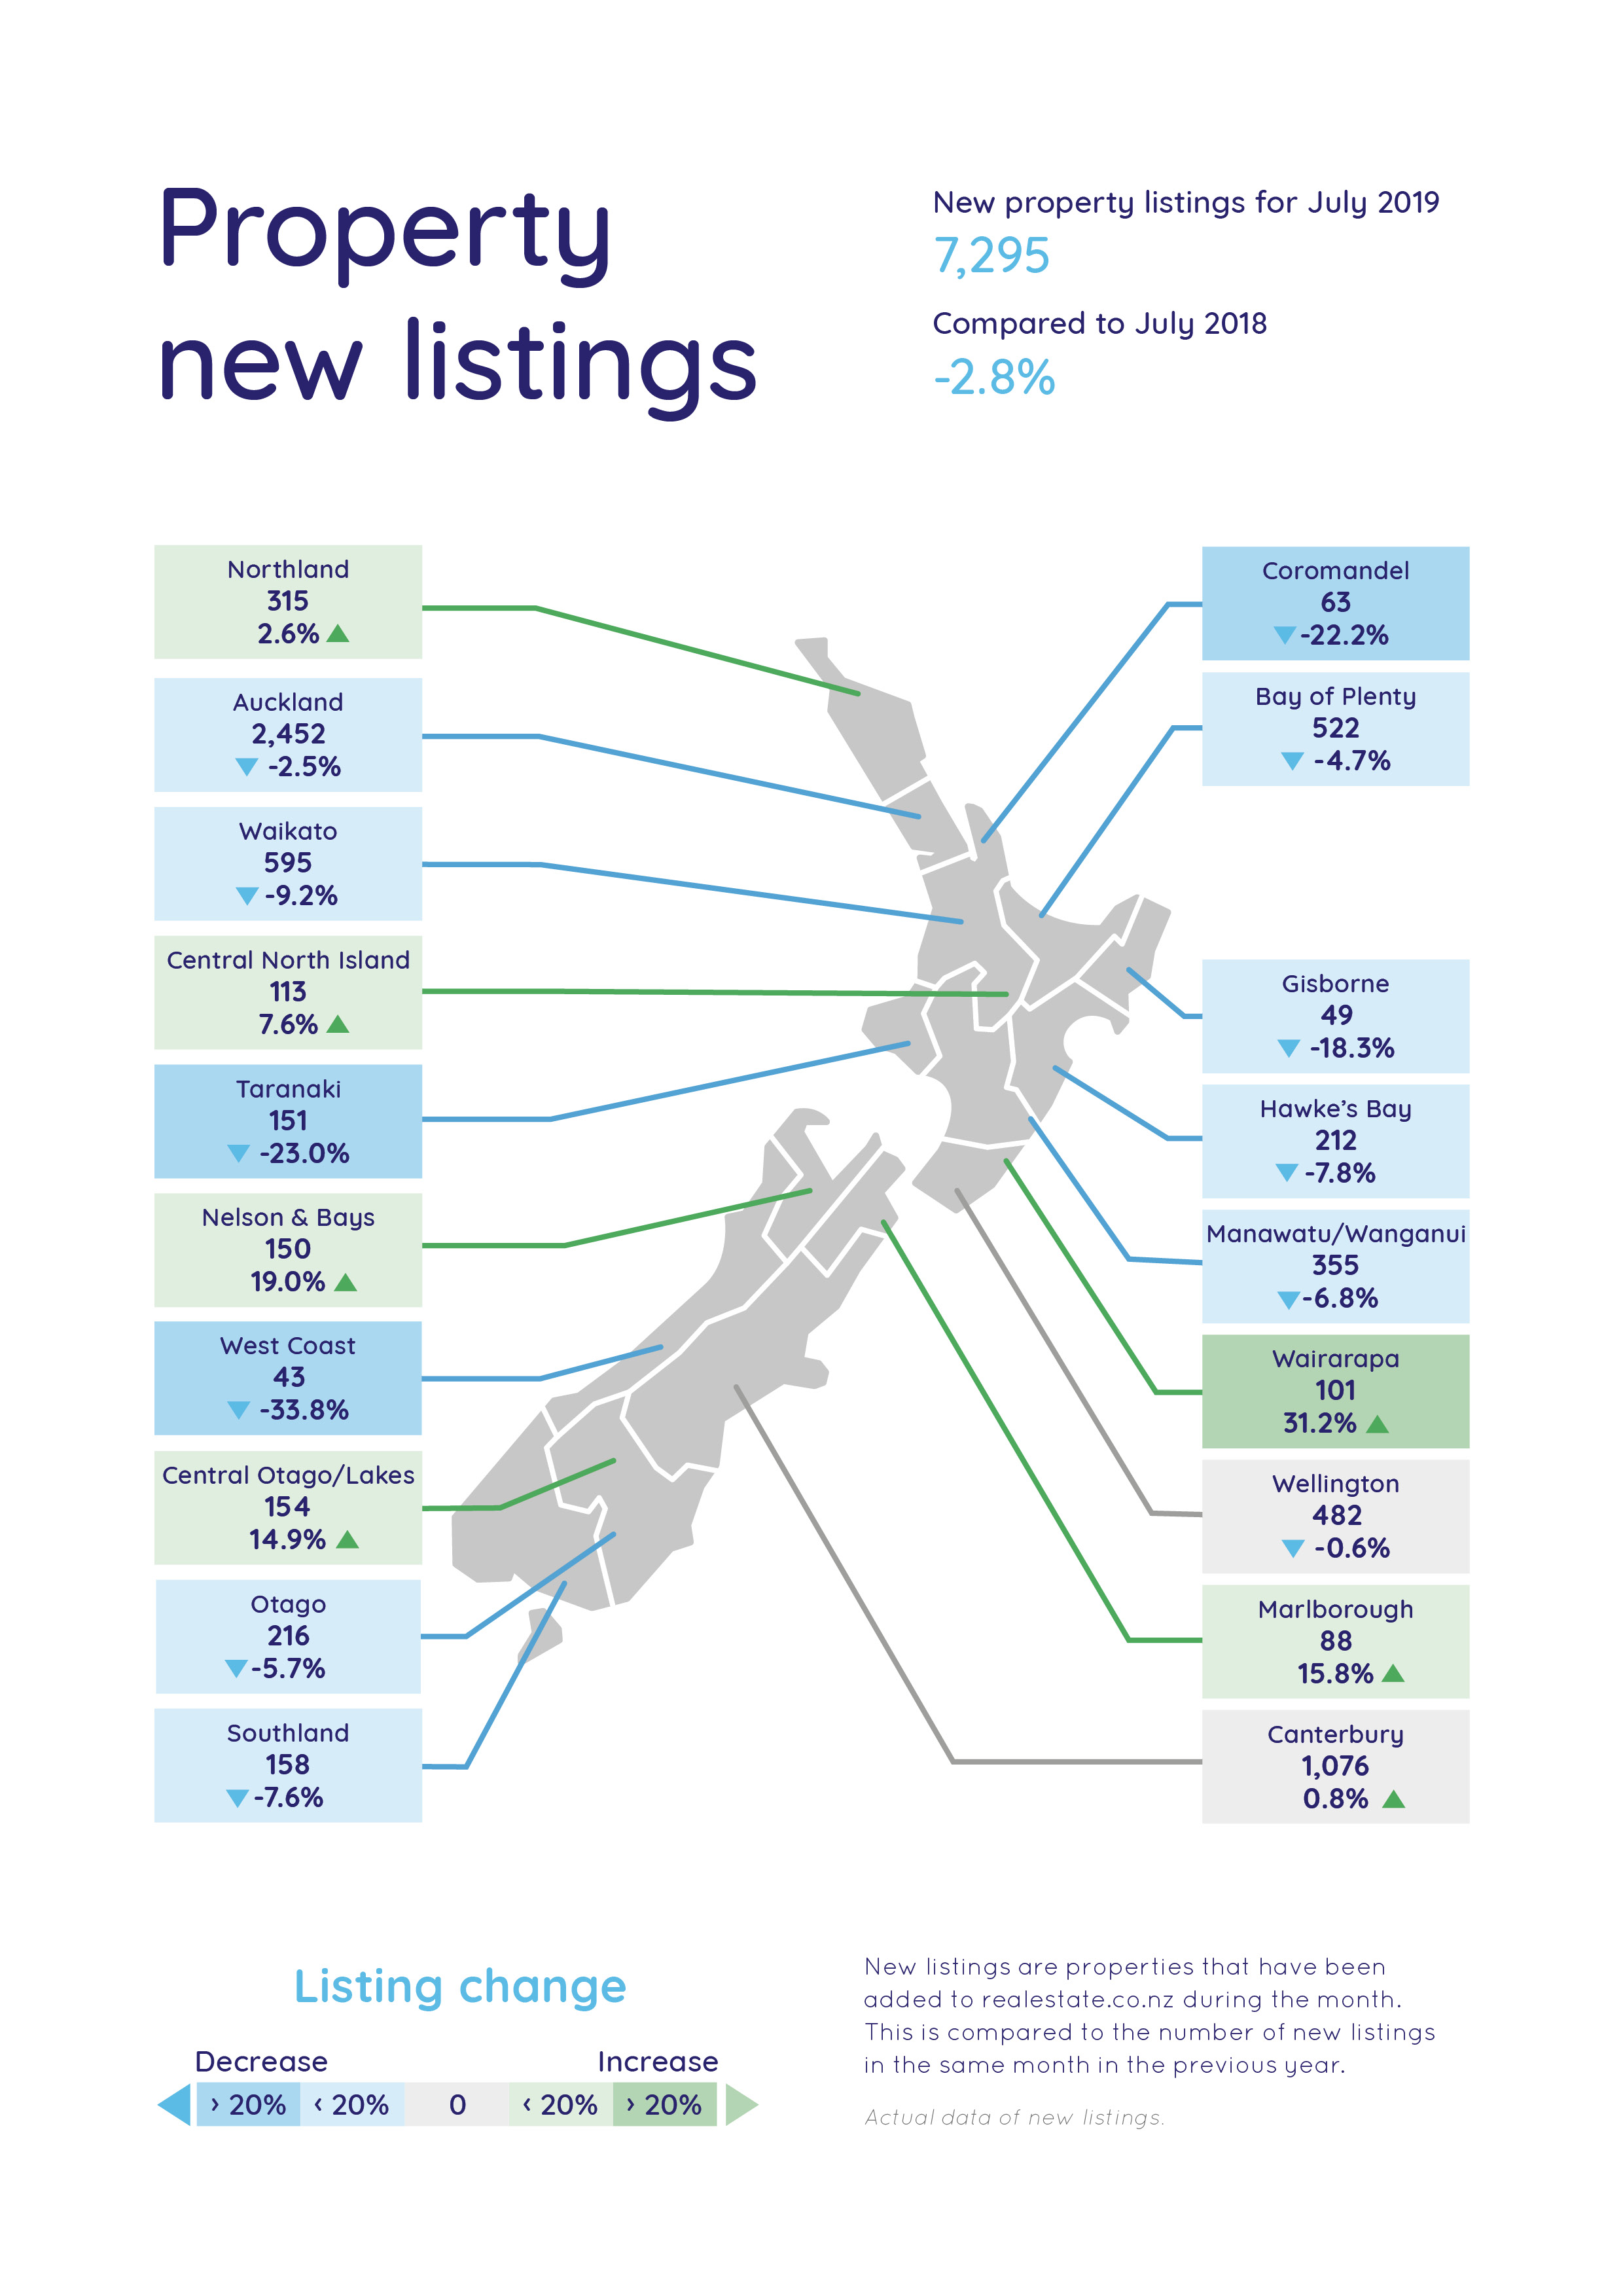
In July the Taranaki region registered 151 new listings, down 23.0% on the same month last year.
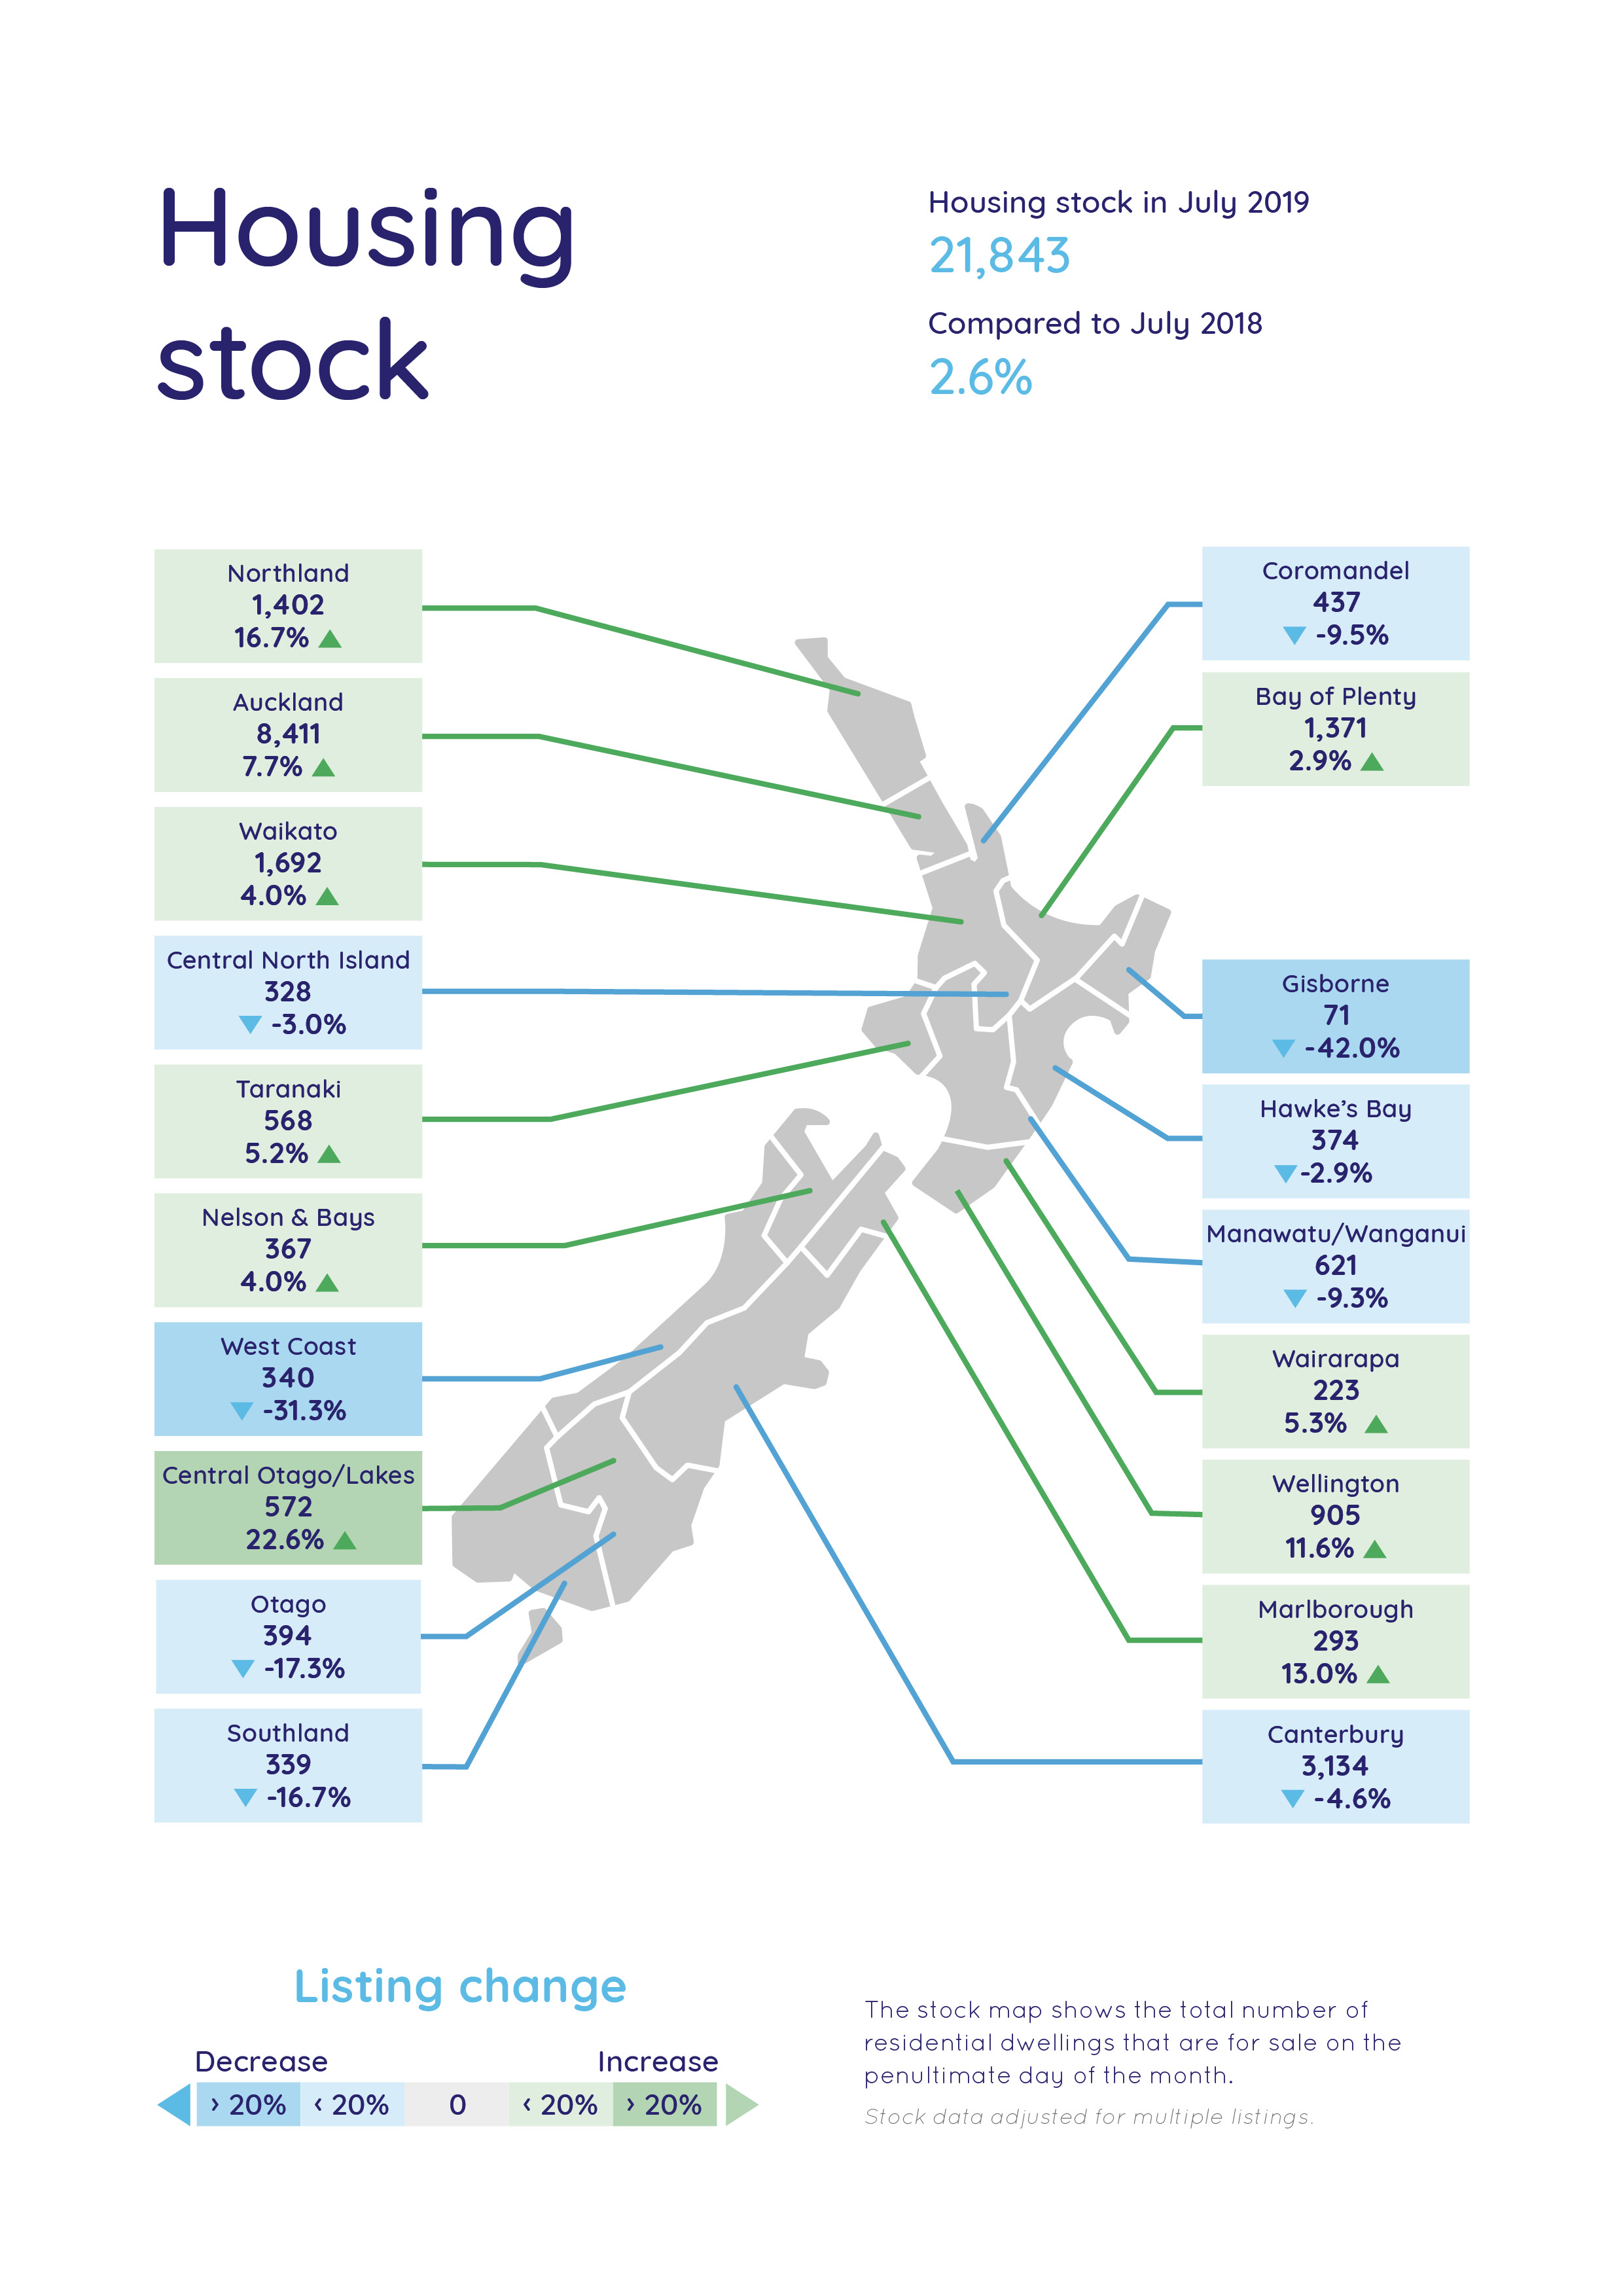
Although new listings were short, there was a total of 568 homes for sale in July (up 5.2% from July 2018).
“Taranaki is a unique province on many levels and continues to be on our radar,” says Vanessa.
The Otago region is showing the symptoms of a supply and demand situation. The region’s average asking price rose 11.2% in July to hit an all-time record of $454,727.
This is in a month where new listings were down 5.7% (216 listings) and total stock was also down 17.3% (394 listings) compared to July 2018.
“This situation is not unusual for this time of year in Otago, particularly with investors who may be sitting on property until the university year ends,” she says.
Southland has been very active this year, with four of the six months in 2019 seeing all-time high average asking prices. The region started the year at an asking price of $332,051 and is now sitting at $373,897 for July (a 6.7% increase on last month).
New listings have dropped back 7.6% on this time last year (158 listings) while total homes for sale is at an all-time low of 339 (down 16.9% on July 2018).
“The effects of supply and demand are certainly strong in the South Island this month,” Vanessa comments.
The Hawke’s Bay is the fourth region to command record asking price highs in July.
The Hawke’s Bay property trifecta –
With a record high average asking price, record low level of new listings and record low number of total homes for sale in any month since data collection began 12 years ago, the Hawke’s Bay region takes the trifecta.
“It’s a classic supply and demand situation,” says Vanessa.
Hawke’s Bay region July trifecta facts:
- All-time asking price high of $579,647, up 6.8% on June 2019
- All-time low number of new property listings (212), down 7.8% on July 2018
- All-time low number of total homes available for sale (374), down 2.9% on this time last year
“The region continues to grow in stature and it’s not surprising that it’s flourishing,” says Vanessa.
“It’s a region which has it all. Renowned for the beauty of its natural scenery including beaches, rivers and outdoor activities, it’s also famous for its lifestyle and uniqueness, being the historic Art Deco city of Napier,” says Vanessa.
“With a Mediterranean-like climate, New Zealand’s oldest wine region has evolved over time into the home of award-winning restaurants, gourmet food production, art, music and events,” says Vanessa.
When realestate.co.nz started collecting data 12 years ago, the average asking price for a home in the Hawke’s Bay region was $344,321.
“It was always an appealing place to live and anecdotally it seems Aucklanders began to eye the Hawke’s Bay as a place which could offer a permanent lifestyle change when property prices started to climb rapidly in the Auckland region.”
The 212 new listings in July were down 7.8% compared to the same month last year and the total number of homes for sale also fell 2.9% to 374 listings.
“This is a very tight market, but the upside is that more than half of the homes on the market in July were fresh listings for buyers to consider,” says Vanessa.
Note - Bindi Norwell, Chief Executive at REINZ recently commented on sales results stating: “We’ve seen median sale prices for residential properties increasing across the country for some time now, despite the introduction of the foreign buyer ban at the back end of 2018. In fact, over the last three years, median prices across New Zealand have increased by 17.0%. Looking more closely at the Taranaki, Otago and Southland regions, we have seen median price increases of 20.6%, 34.5% and 50.0% respectively over the last few years, showing just how strong these markets are.”
Glossary of terms:
As the only provider of real estate data in real-time, realestate.co.nz offers valuable property market information not available from other sources.
- Average asking price is not a valuation. It is an indication of current market sentiment. Statistically, asking prices tend to correlate closely with the sales prices recorded in future months when those properties are sold. As it looks at different data, average asking prices may differ from recorded sales data released at the same time.
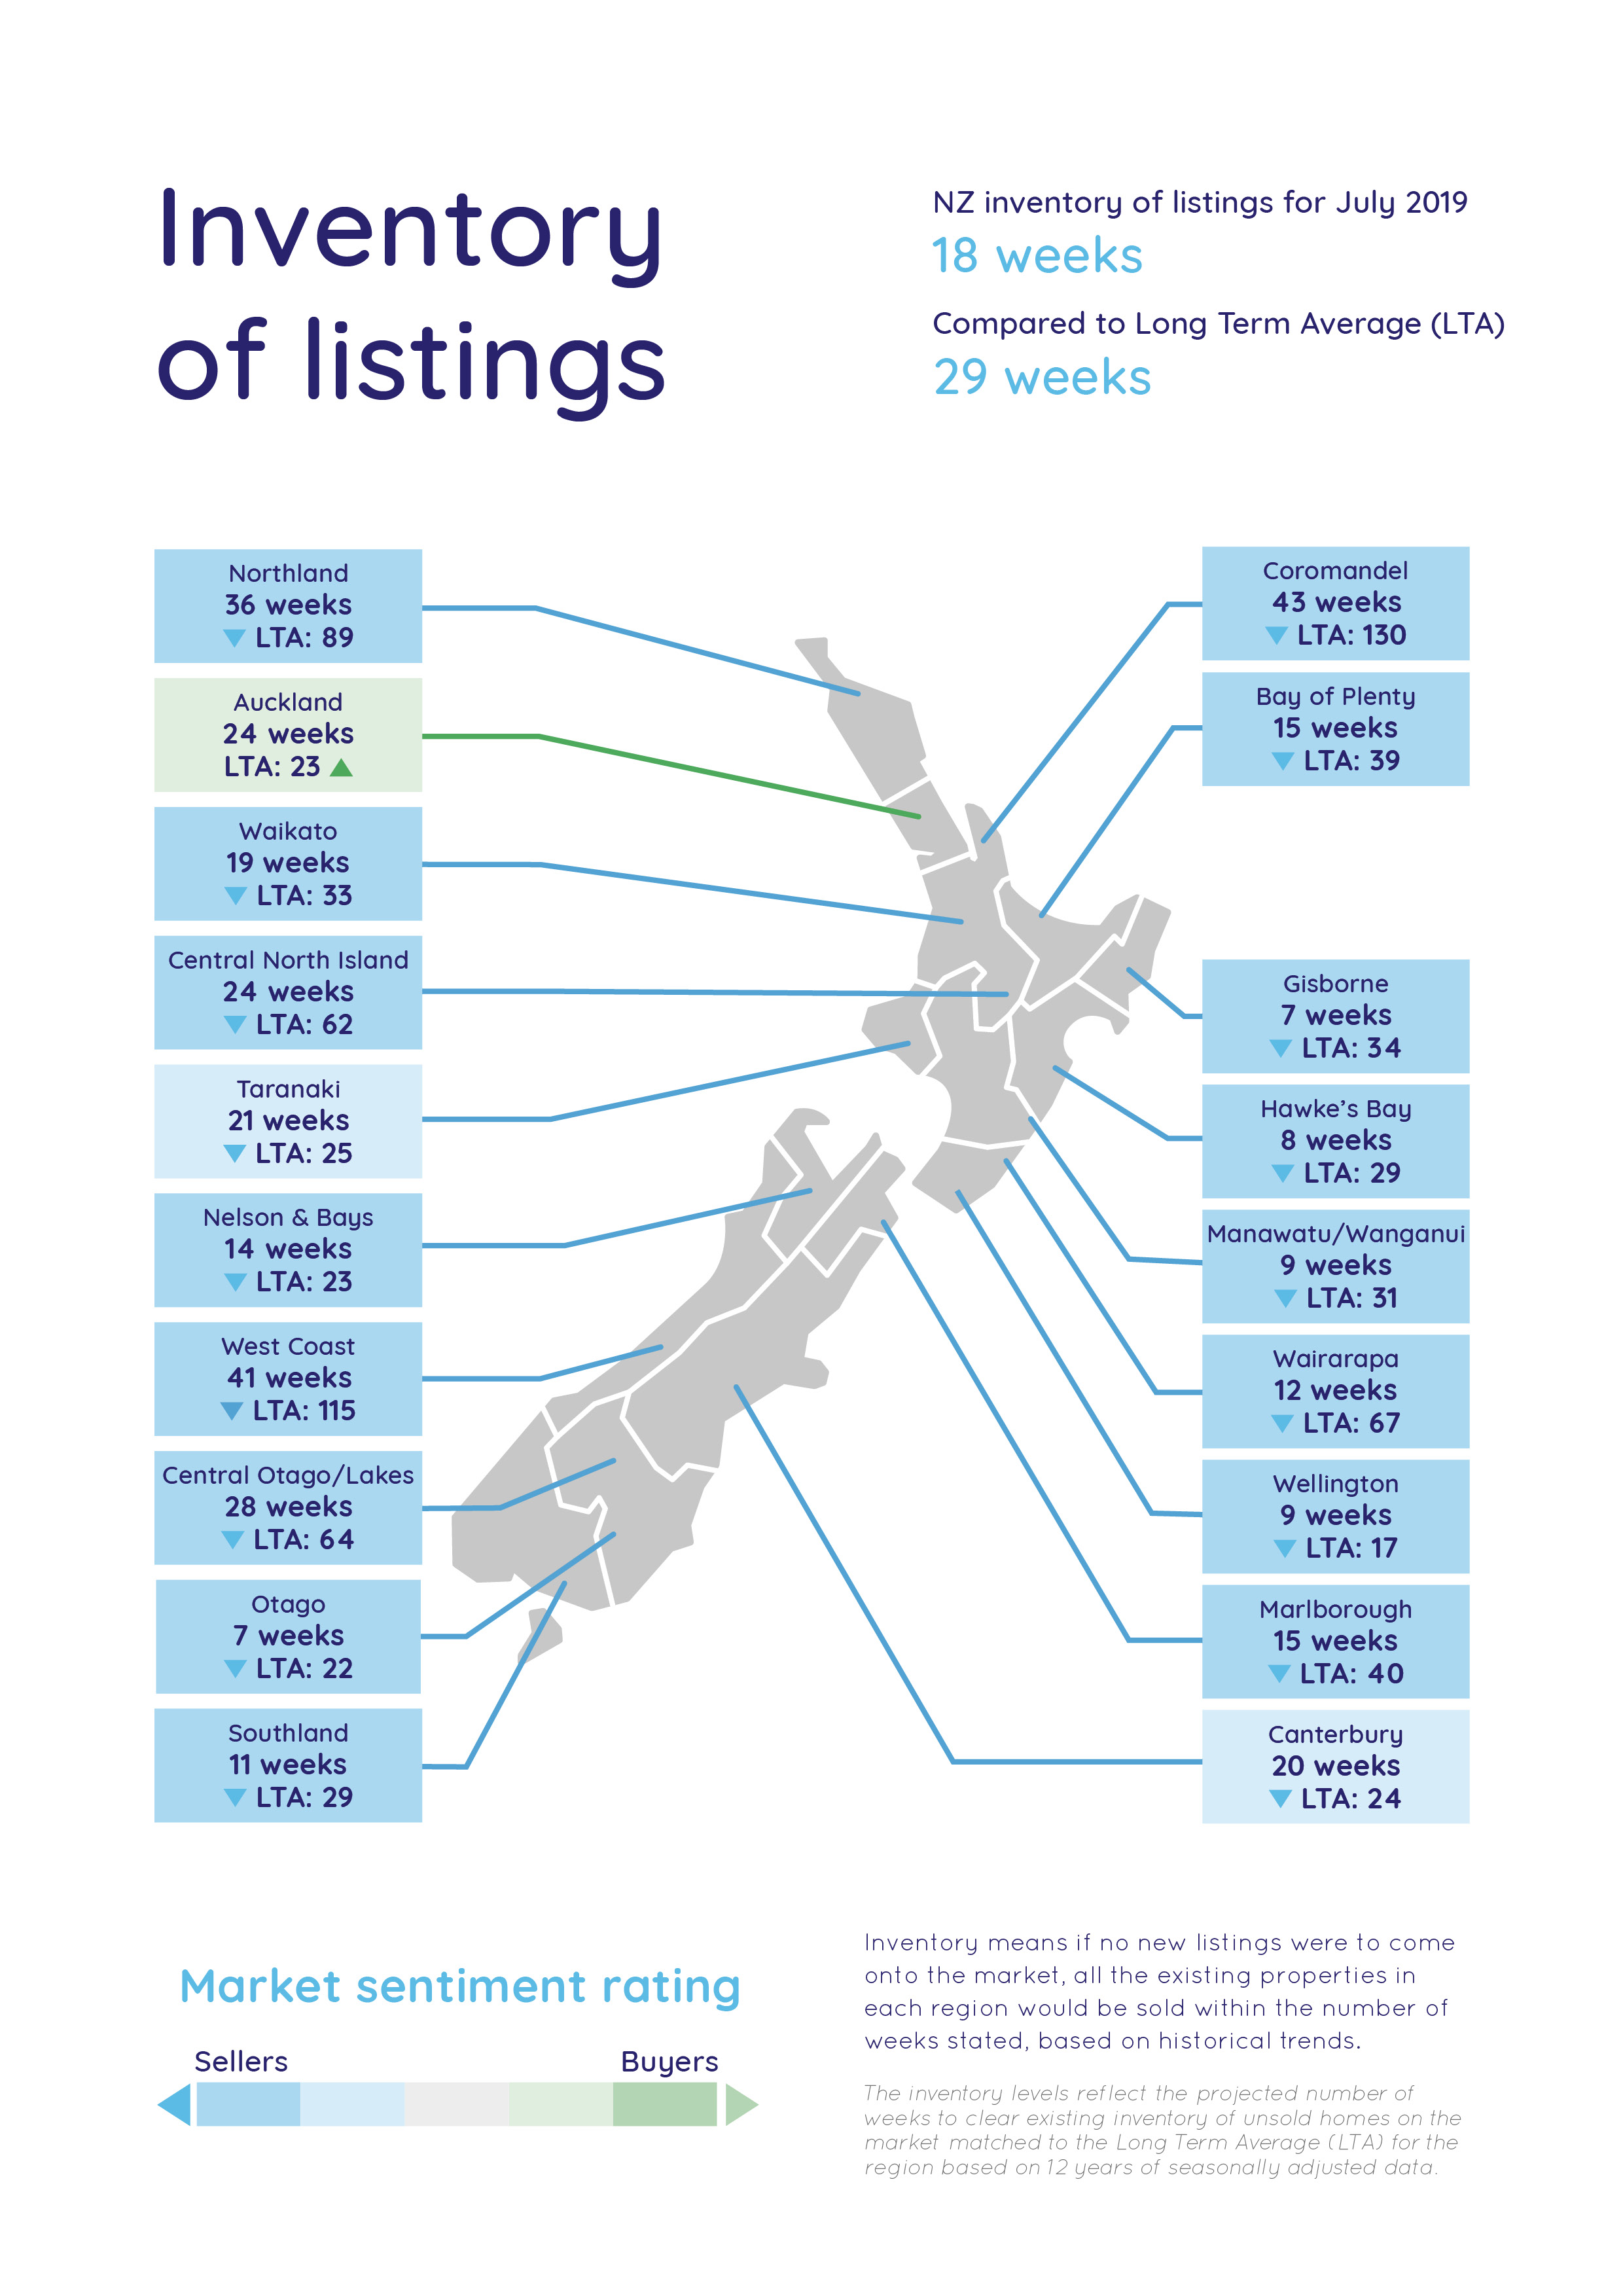
- Inventory is a measure of how long it would take, theoretically, to sell the current stock at current average rates of sale if no new properties were to be listed for sale. It provides a measure of the rate of turnover in the market.
- New listings are a record of all the new listings on realestate.co.nz for the relevant calendar month. As realestate.co.nz reflects 97% of all properties listed through registered estate agents in New Zealand, this gives a representative view of the New Zealand property market.
- Demand: the increase or decrease in the number of views per listing in that region, taken over a rolling three-month time frame, compared to the same three-month time frame the previous year – including the current month.
- Seasonal adjustment is a method realestate.co.nz uses to better represent the core underlying trend of the property market in New Zealand. This is done using methodology from the New Zealand Institute of Economic Research.
- Truncated mean is the method realestate.co.nz uses to provide statistically relevant asking prices. The top and bottom 10% of listings in each area are removed before the average is calculated, to prevent exceptional listings from providing false impressions.
Share
-
.svg)
.svg)
.svg)