
.svg)


Regional New Zealand dominates the spring property market. Record asking price highs in five lifestyle regions - Gisborne, Bay of Plenty, Nelson & Bays, Manawatu/Wanganui and Northland, while Wellington is the only mover among the five big regions. New listings are comparable to April 2019 levels, while property seekers remain active.
Download the full New Zealand Property Report as a PDF, or watch our video update below.
Regional New Zealand dominated the property market in the first official month of spring, says realestate.co.nz spokesperson Vanessa Taylor.
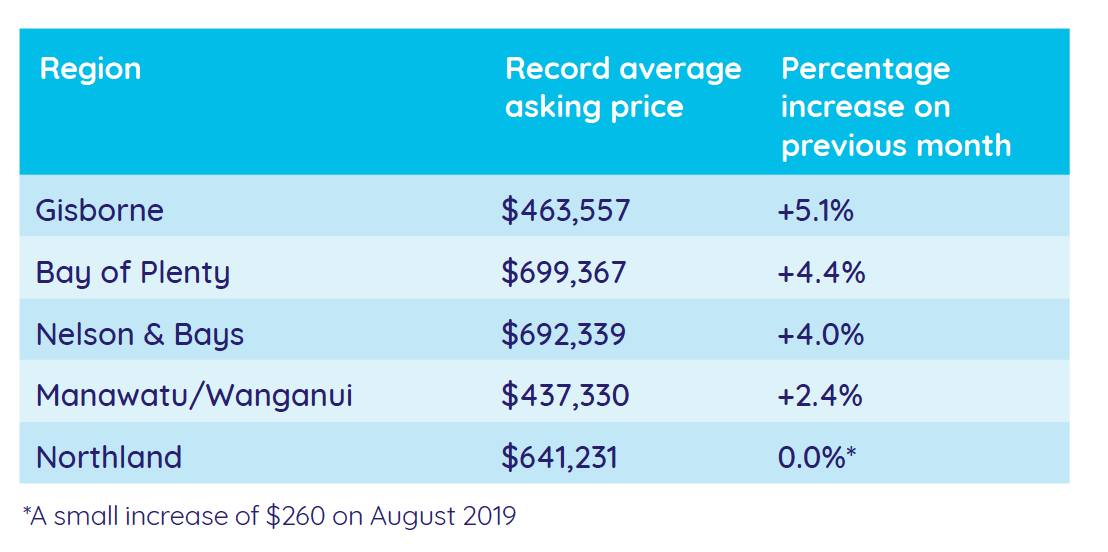
In September, five provincial regions registered record average asking price highs in realestate.co.nz’s 12-year databank.
“These provincial regions have gone some way to compensate for the more subdued main regions,” says Vanessa.
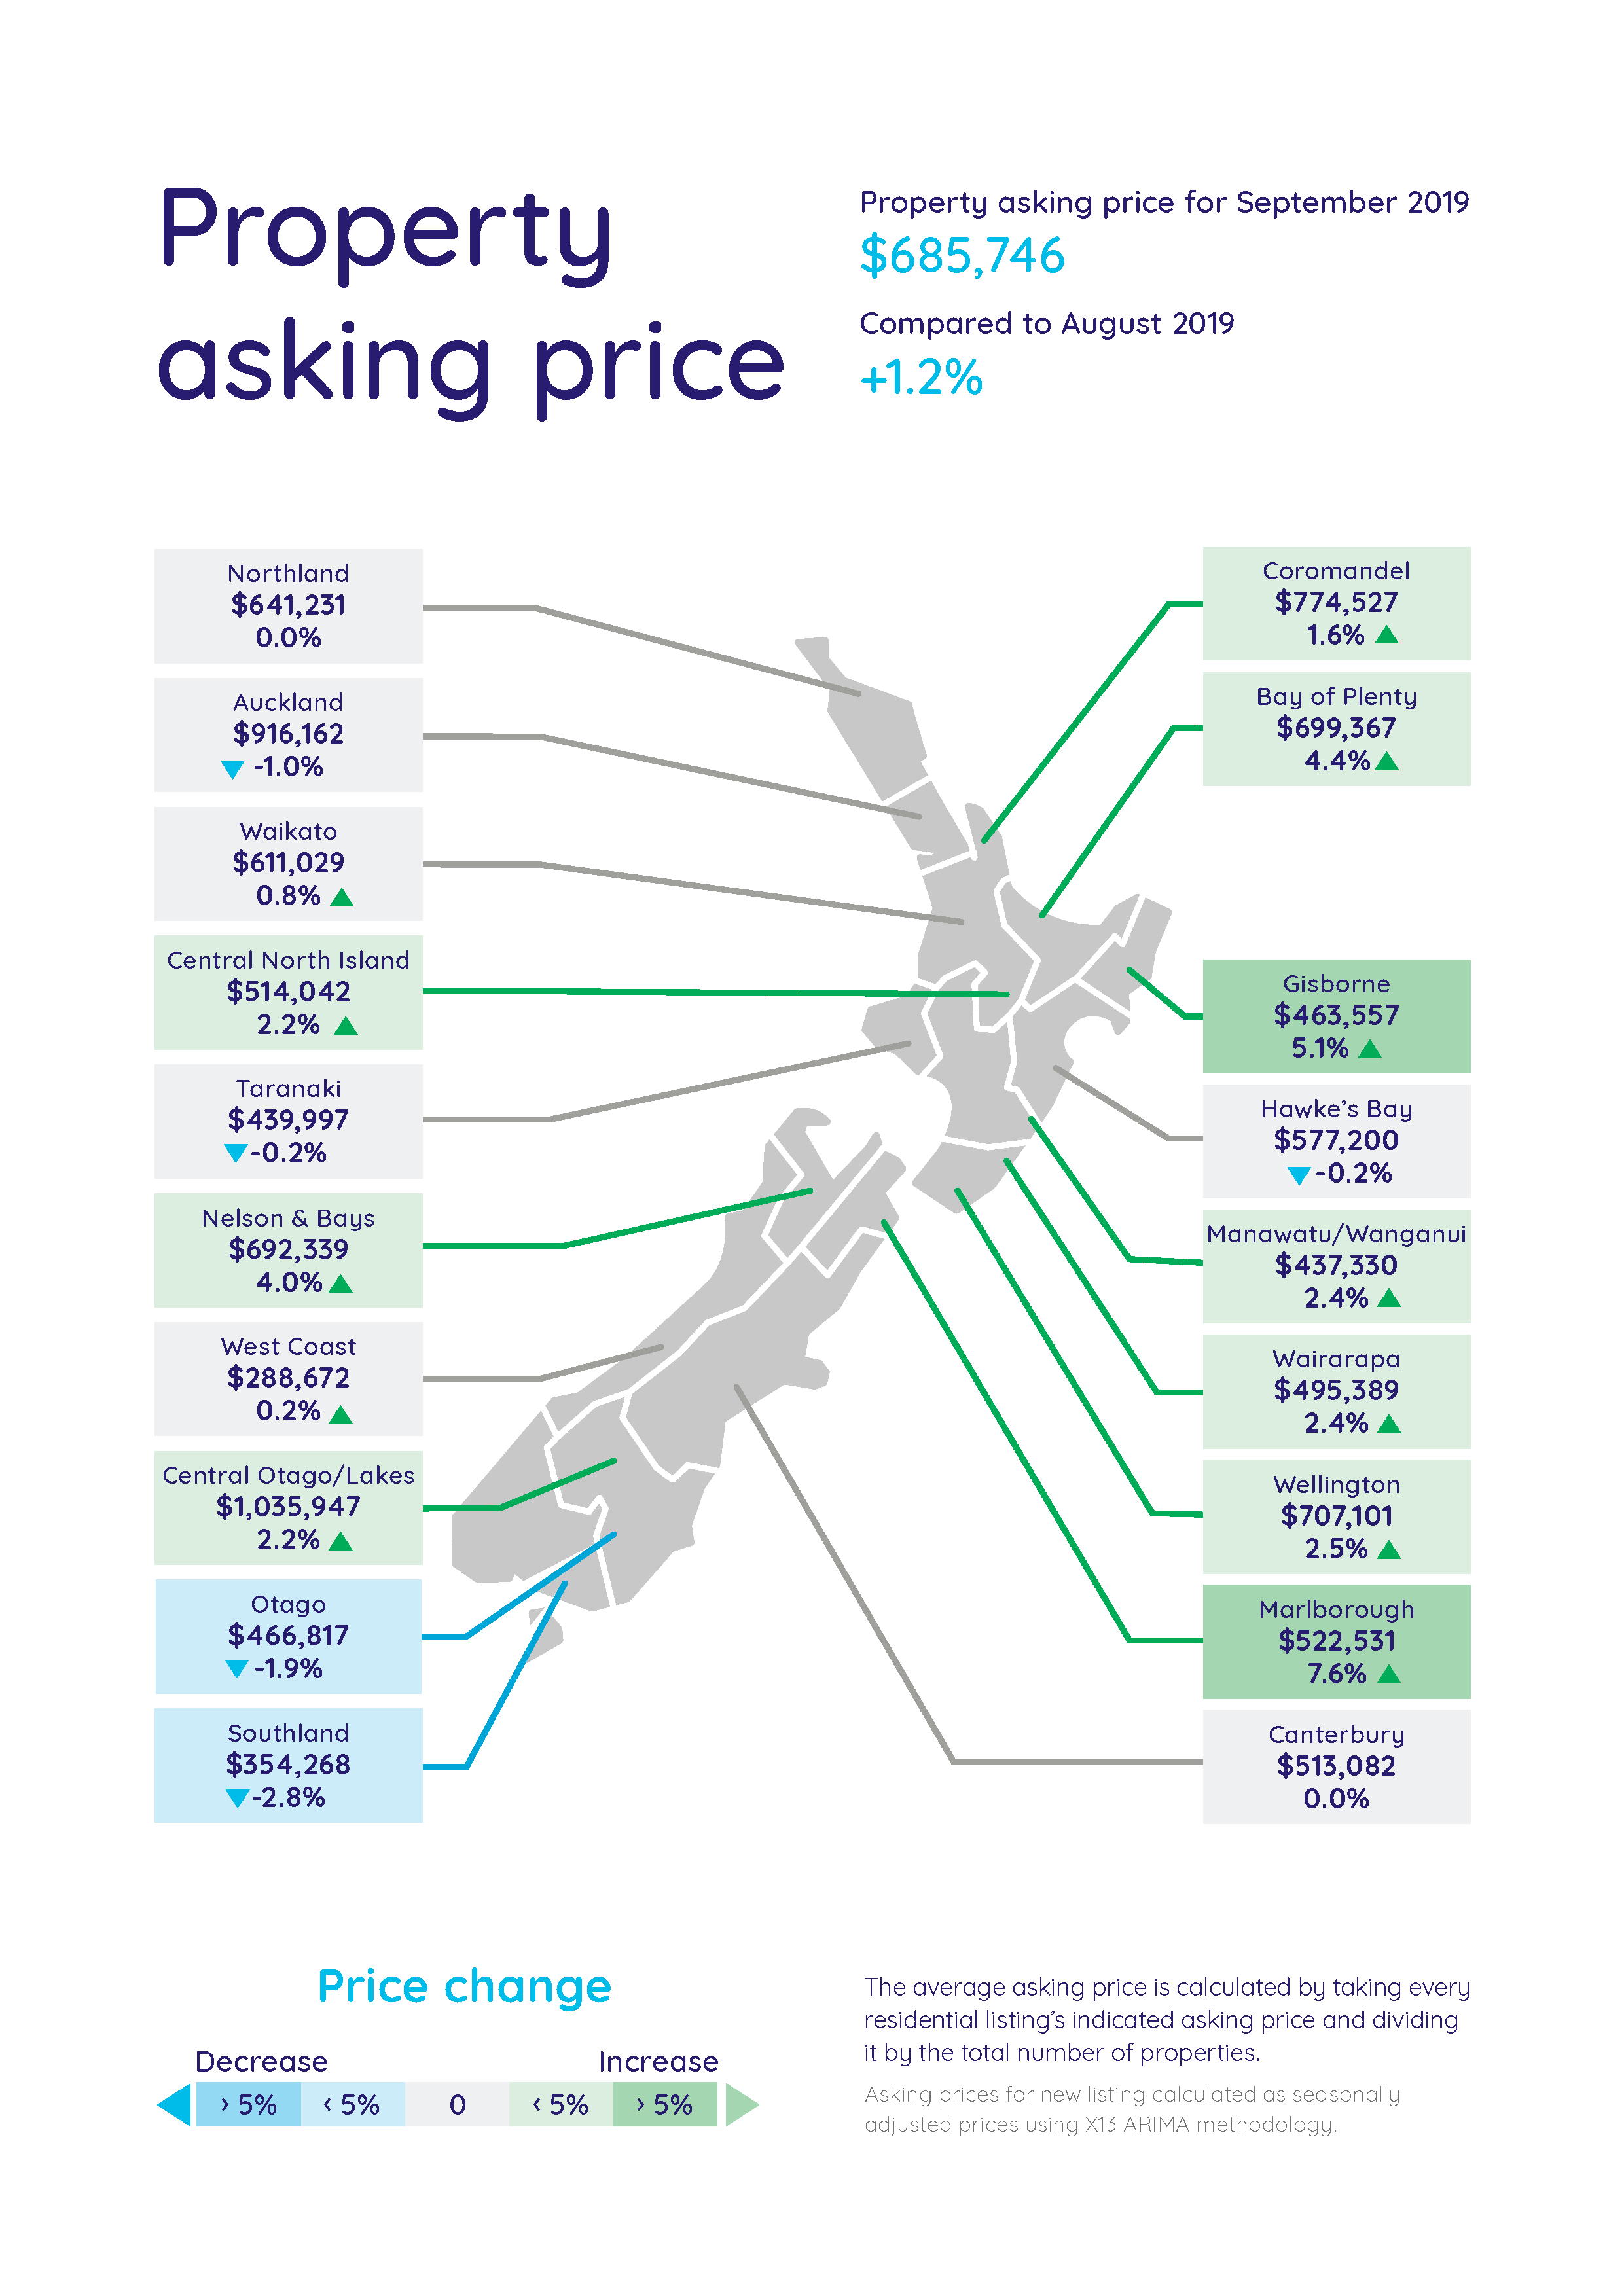
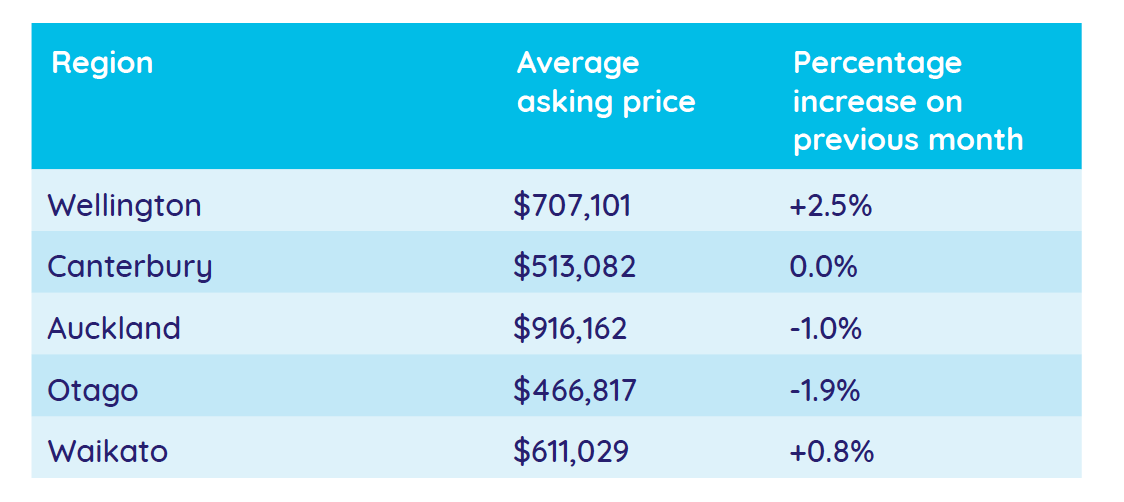
Of the five main regions (Auckland, Wellington, Canterbury, Otago and Waikato), only the Wellington region recorded an increase over 1.0% in average asking prices.
Underpinned by regional New Zealand, the national average asking price lifted by 1.2% to $685,746 when compared to the previous month, says Vanessa.
Kiwibank General Manager, Borrowing and Investments, Chris Greig says the level of activity in the regions has increased approximately 10.0% for Kiwibank in comparison to the same time last year whilst applications for new lending in the major centres is static.
“The last quarter, however, has seen a decrease in the amount of first home buyers taking out new lending,” he says.
Record asking price highs in lifestyle regions
Gisborne, Bay of Plenty, Nelson & Bays, Manawatu/Wanganui, and Northland for the second month in a row
Five regions hit record average asking price highs since realestate.co.nz records began in 2007.
For Northland, it was the second month in a row and the sixth time during 2019 we have seen an all-time average asking price high. The asking price grew, albeit by a modest $260, to reach $641,231.
“It’s an increase that doesn’t actually register as statistically relevant, but for Northlanders a record is a record,” says Vanessa.
At the other end of the scale, the Gisborne region’s average asking price rose by 5.1%, to hit a record of $463,557.
It was followed by the Bay of Plenty, Nelson & Bays, Manawatu/Wanganui and Northland regions.
“These are all regions with lifestyle appeal,” says Vanessa.
“They all touch the coast, you can holiday or work in these regions and for people looking to leave the hustle-bustle of the big cities for a more balanced lifestyle, they’re all good options.”
Wellington the only mover among the five big regions
It was a different picture in the five major regions.
The average asking price in the Wellington region continued its northward climb, reaching $707,101 in September (up 2.5% on the previous month), but the other four main regions were not so lively.
Average asking prices in the Canterbury, Auckland, Waikato and Otago regions either remained static or fell.
“Following the Reserve Bank’s announcement in early August of the cutting of the Official Cash Rate (OCR), September was the first full month for the property market to see any potential effects,” says Vanessa.
“It’s still very early days but it will be interesting to watch what impact, if any, the disparity in pricing levels and activity between the regions and main centres may have on prospective buyers and sellers,” says Vanessa.
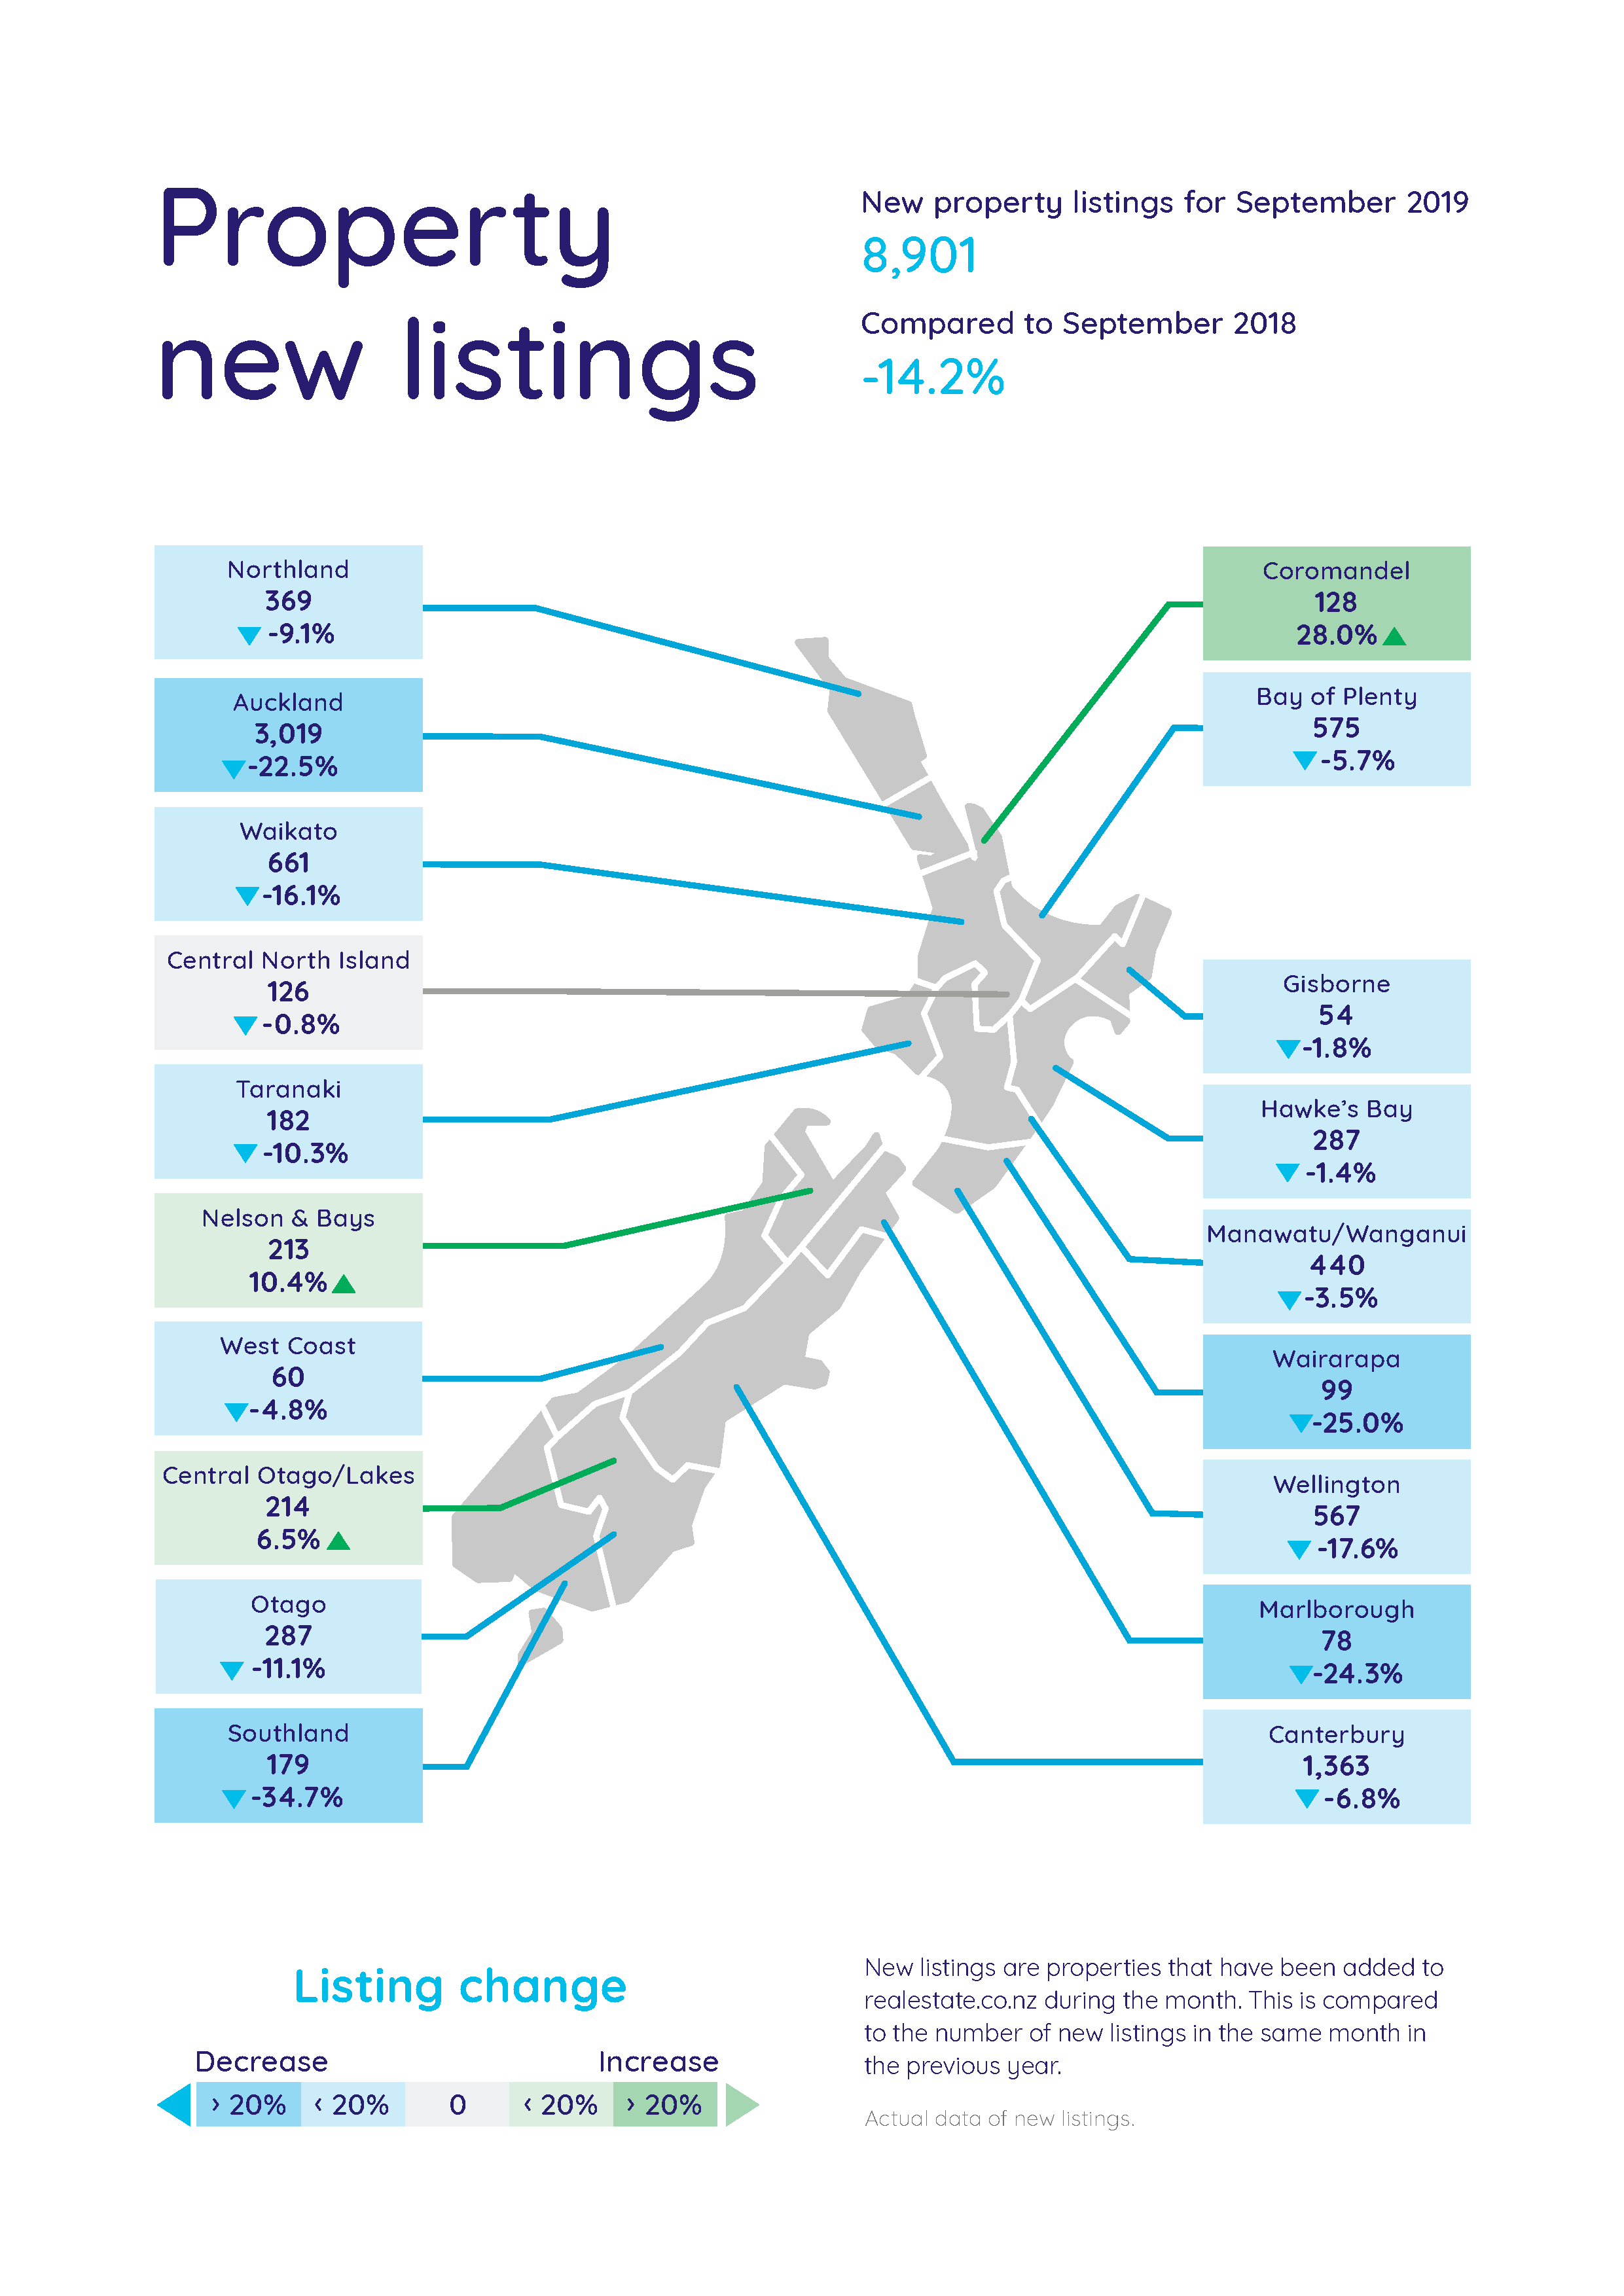
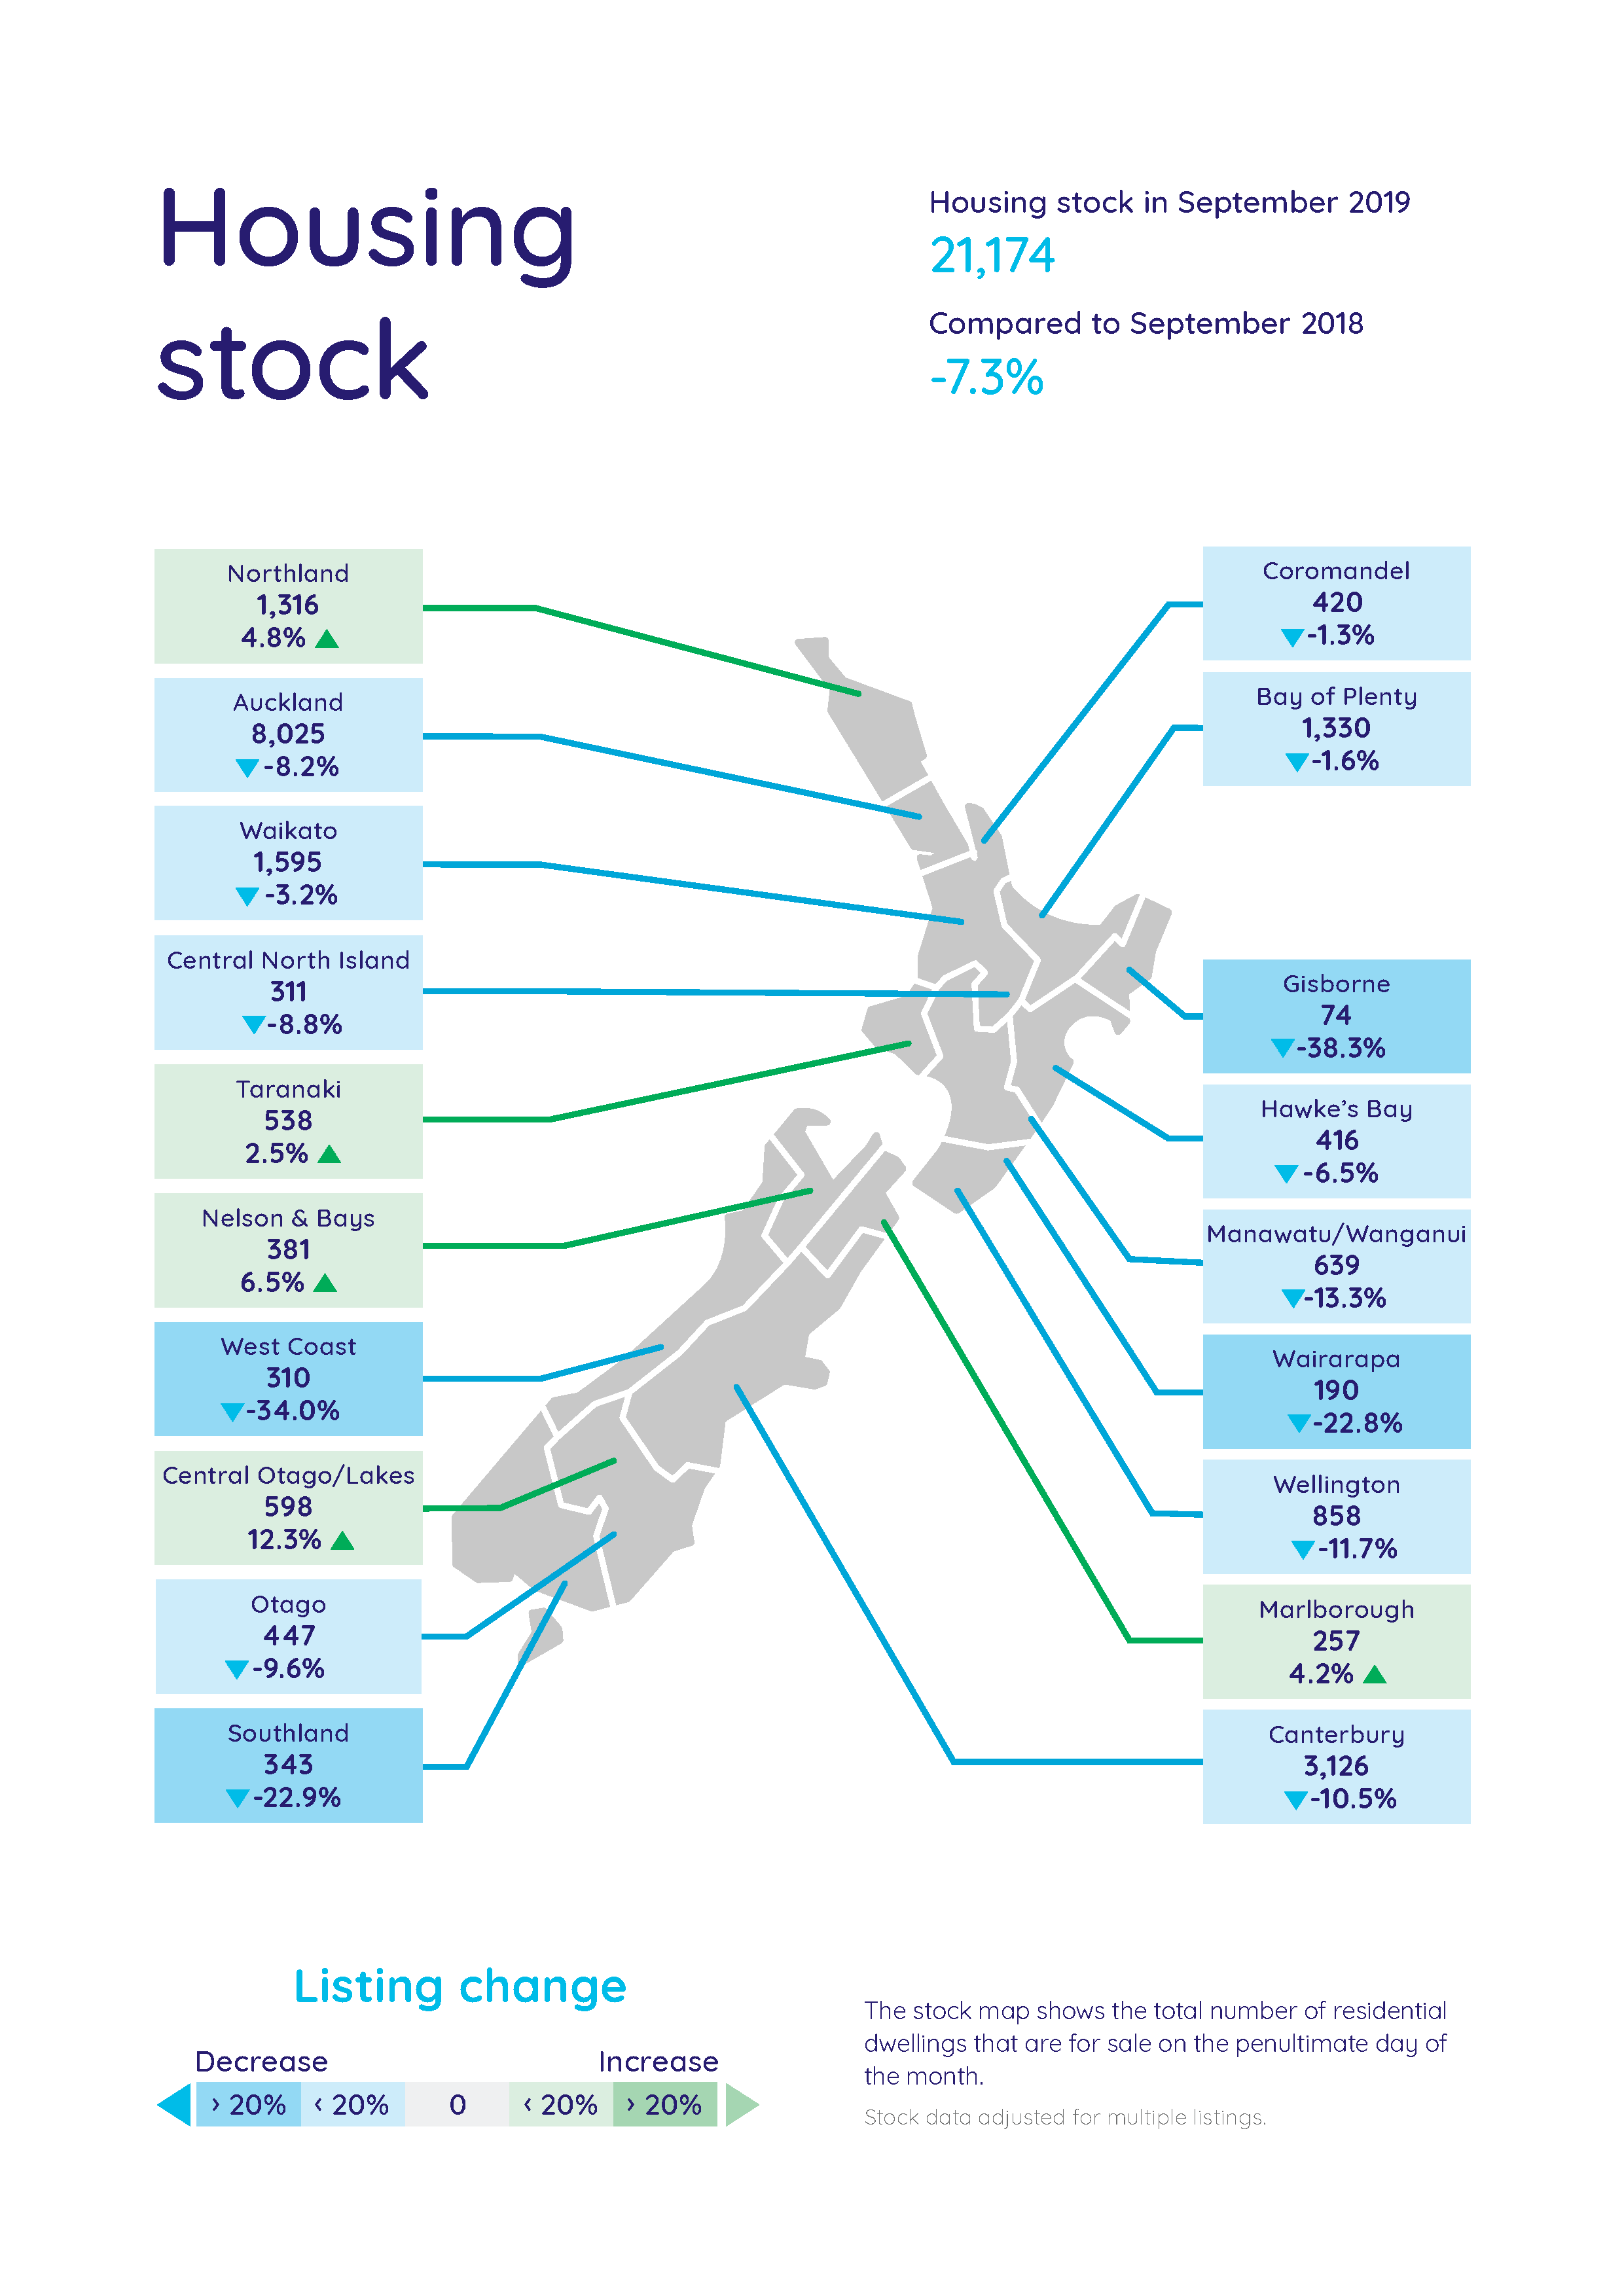
New listings back to April 2019 levels and property seekers are active
To take into account seasonal fluctuations and buyer behaviour in different months, realestate.co.nz compares the average number of new listings year-on-year.
Last year (September 2018) was somewhat of a “one-off” with a significant spike in new listings in that particular month*.
As a result, in September 2019 it appeared that new listings fell significantly compared with the previous year - a 14.2% decrease with 8,901 new listings coming onto the market.
However, the actual number of new listings this September was similar to April 2019 and up on the June-August 2019 quarter, says Vanessa.
The three regions which did register an increase in new listings compared with the same month last year, were Central Otago/Lakes, Nelson & Bays and the Coromandel.
The Coromandel region was the stand-out, registering 128 new listings in September, which is a 28.0% increase on the same month last year.
The Central-Otago/Lakes region had 214 new listings on-site, which represented a 6.5% increase on September 2018.
Rounding off the three regions, Nelson & Bays which saw 213 new listings come to the market which was a 10.4% increase on 2018.
“These vendors may be taking into account the time it takes to search for a property, sell an existing home, transact for a holiday bach or a change of lifestyle, before the start of the summer holidays,” she says.
“On the demand side, there have been strong levels of interest with more than 1,000,000 unique browsers searching realestate.co.nz in September.”
*The September 2018 media release from realestate.co.nz stated:
Real-time statistics from realestate.co.nz show the new listing deluge is led by the Auckland region with owners adding 3,896 homes for sale to the site, up by nearly a third (31.9%) compared to September 2017.
Nationally, there were 10,373 new property listings in September which is an increase of 11.7% on the same month last year. The total number of homes on the market (22,847) is the highest number in any September month since 2015.
For media interviews or further information contact:
- Trish Fitzsimons 021 022 96927 trish@realestate.co.nz
- Or - Sally Haysom 022 124 7321
Glossary of terms:
As the only provider of real estate data in real-time, realestate.co.nz offers valuable property market information not available from other sources.
- Average asking price is not a valuation. It is an indication of current market sentiment. Statistically, asking prices tend to correlate closely with the sales prices recorded in future months when those properties are sold. As it looks at different data, average asking prices may differ from recorded sales data released at the same time.
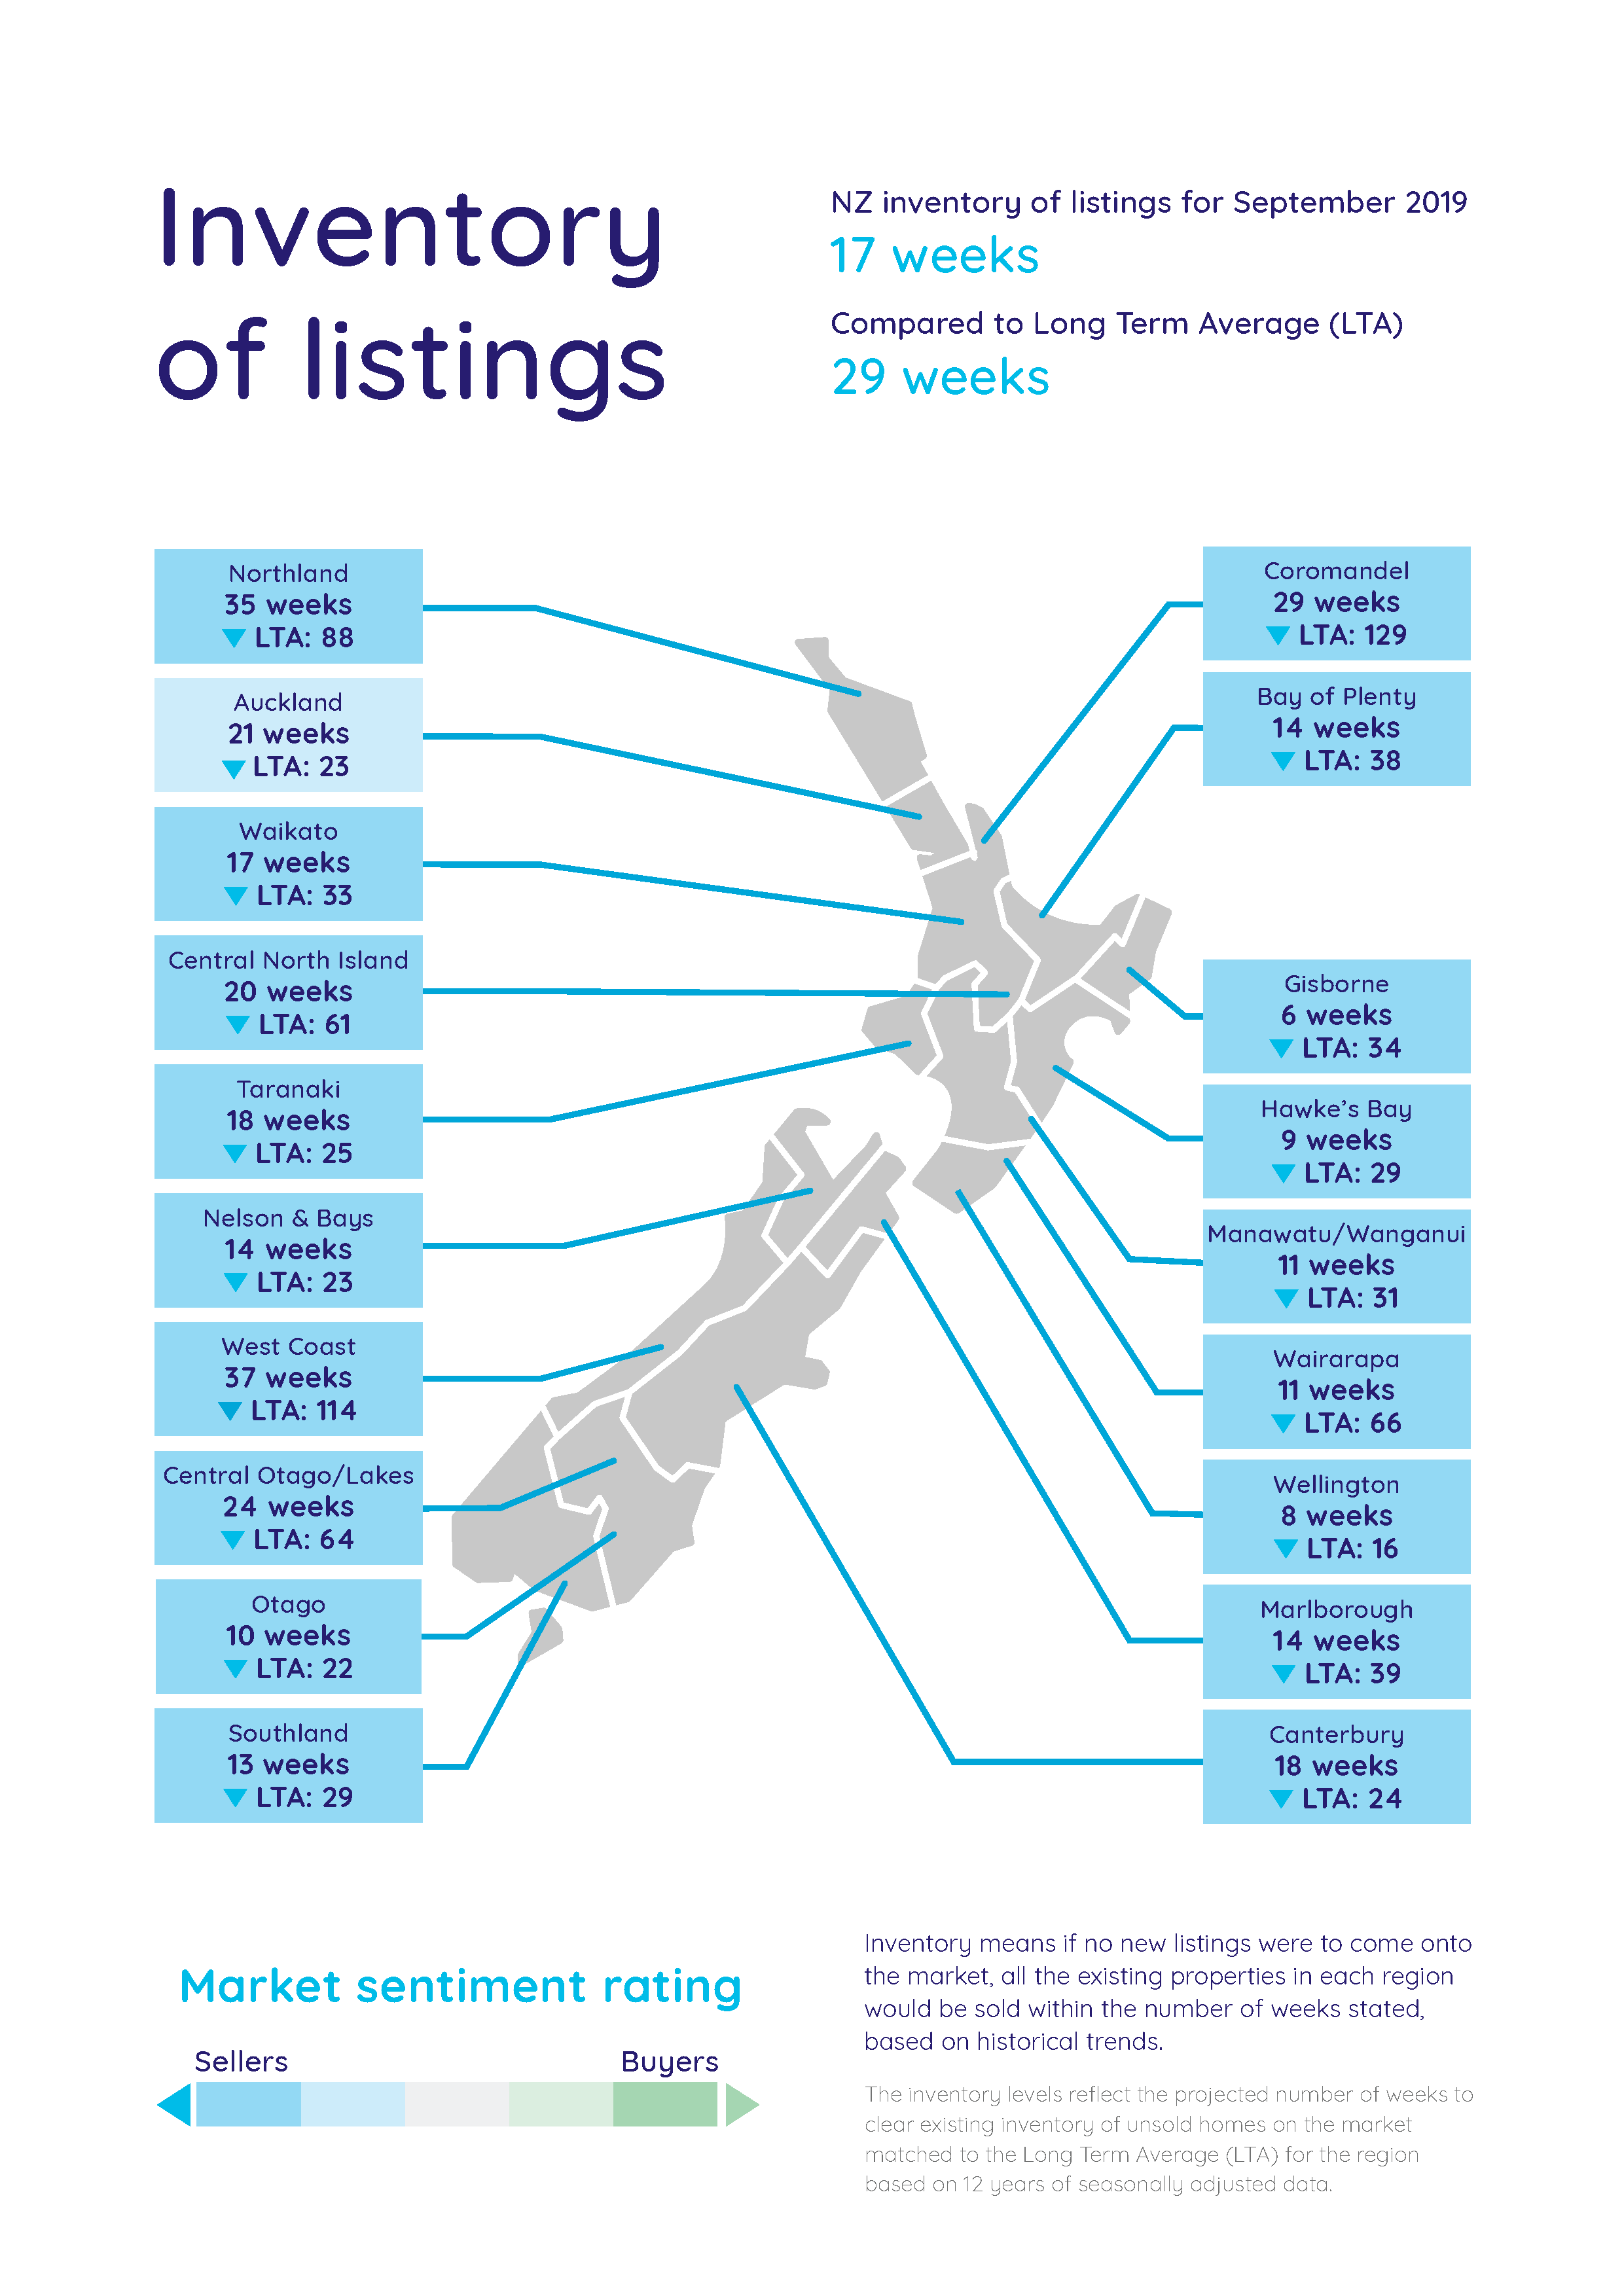
- Inventory is a measure of how long it would take, theoretically, to sell the current stock at current average rates of sale if no new properties were to be listed for sale. It provides a measure of the rate of turnover in the market.
- New listings are a record of all the new listings on realestate.co.nz for the relevant calendar month. As realestate.co.nz reflects 97% of all properties listed through registered estate agents in New Zealand, this gives a representative view of the New Zealand property market.
- Demand: the increase or decrease in the number of views per listing in that region, taken over a rolling three-month time frame, compared to the same three-month time frame the previous year – including the current month.
- Seasonal adjustment is a method realestate.co.nz uses to better represent the core underlying trend of the property market in New Zealand. This is done using methodology from the New Zealand Institute of Economic Research.
- Truncated mean is the method realestate.co.nz uses to provide statistically relevant asking prices. The top and bottom 10% of listings in each area are removed before the average is calculated, to prevent exceptional listings from providing false impressions.
Share
-
.svg)
.svg)
.svg)