
.svg)


Not enough houses: supply low nationwide.
Stock shortage unlikely to ease in short term; prices remain buoyant.
Real-time data from realestate.co.nz suggests that the country’s long-term stock shortage will continue to pose challenges for the property market in coming months.
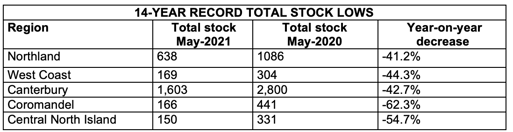
Housing stock was down year-on-year in all but one region in May, with five regions falling to all-time lows since records began 14 years ago.
Vanessa Williams, spokesperson for realestate.co.nz, says this is despite a 5.2% year-on-year increase in new listings.
“Stock has steadily been decreasing over the last decade, and at this point it would take a flood of properties coming onto the market to reverse that trend,” says Vanessa.
“Despite a lift in new listings and incentives to encourage new builds, we’re not yet seeing enough homes listed to ease the supply shortage. This is continuing to put pressure on property prices.”
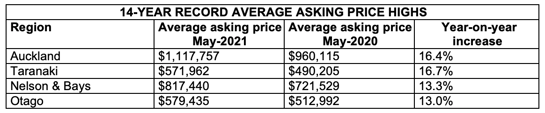
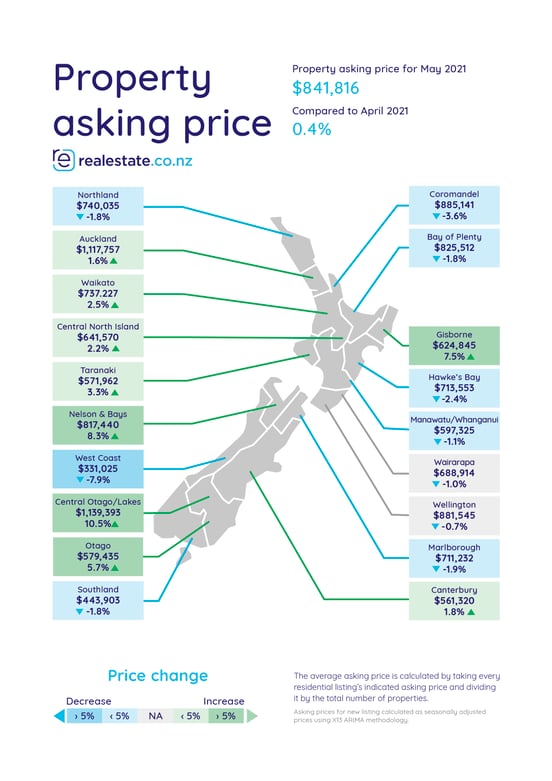
The national average asking price was $841,816 last month, up 15.3% on May 2020. Four regions reached record average asking prices in May: Auckland, Taranaki, Nelson & Bays and Otago.
Building booming – but don’t expect a flood of supply just yet
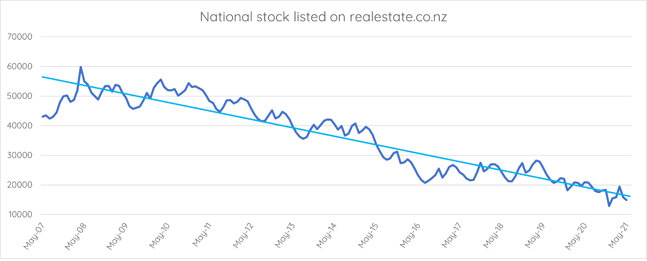
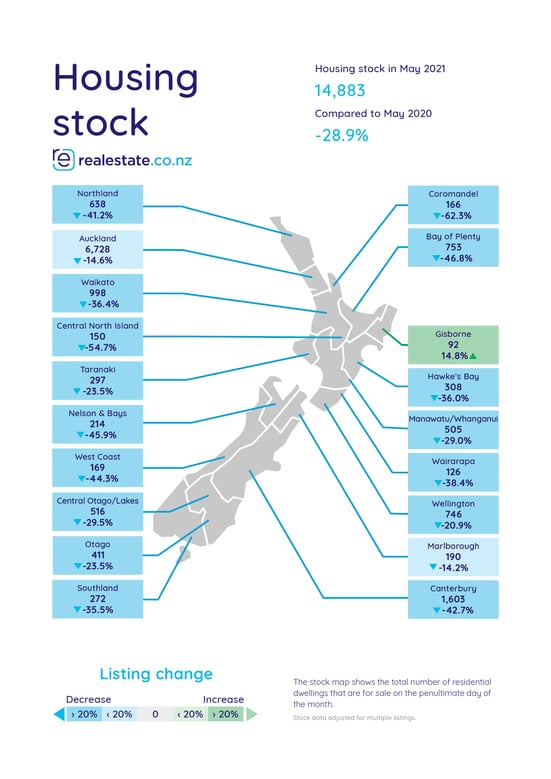
Property remains in short supply across the country, with only 14,883 homes available for purchase at the end of May – 28.9% less than the same time last year.
Stock was down year-on-year in all bar one region last month, with five regions falling to record lows in May.
This comes despite an increase in new listings and a booming building industry.
According to Stats NZ, building consent numbers are at an all-time high with over 40,000 new homes consented during the year ended March 2021.
“There is definitely a building boom at the moment, but the problem we’re facing now is supply issues,” says Mike Craig, Chairperson of New Zealand Certified Builders.
“Product delays mean everything has slowed down. I have jobs that were due to start in October that have now been pushed out to February, and I’ve been hearing similar stories across the industry.”
Vanessa Williams, spokesperson for realestate.co.nz, says build timeframes are only one part of the puzzle.
“The challenge is that we have had such historically low stock levels that new listings haven’t been able to make dent in the market, even with all the building happening currently,” she says.
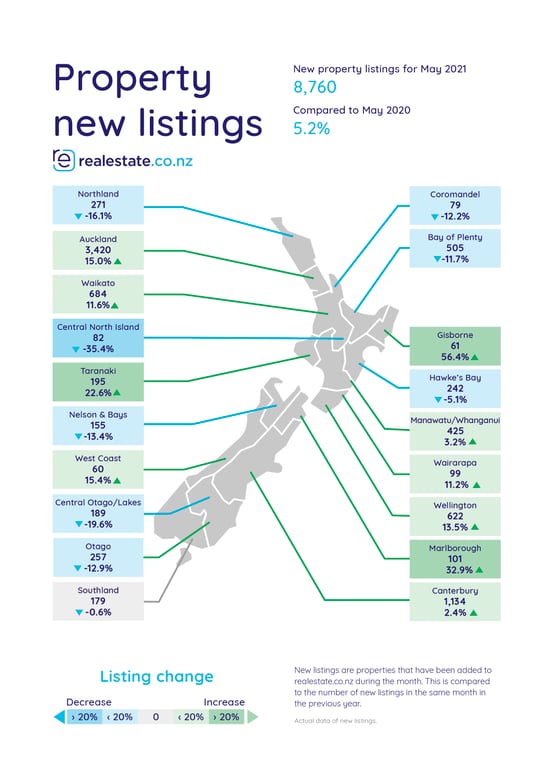
New listings were up in 10 of 19 regions during May, with Gisborne and Marlborough recording the biggest increases.
There were 8,760 properties listed for sale nationwide last month – 5.2% more than in May 2020. But Vanessa cautions that the year-on-year figures may not be as promising as they first appear.
“Looking back on May 2020, the market was just starting to come back online after the Covid-19 lockdown. In previous years we’ve seen around 9,500 or more new listings during May,” she says.
“The number of properties coming onto the market is still not meeting demand - so although we are seeing a lift in new listings, total stock numbers are still going backwards.”
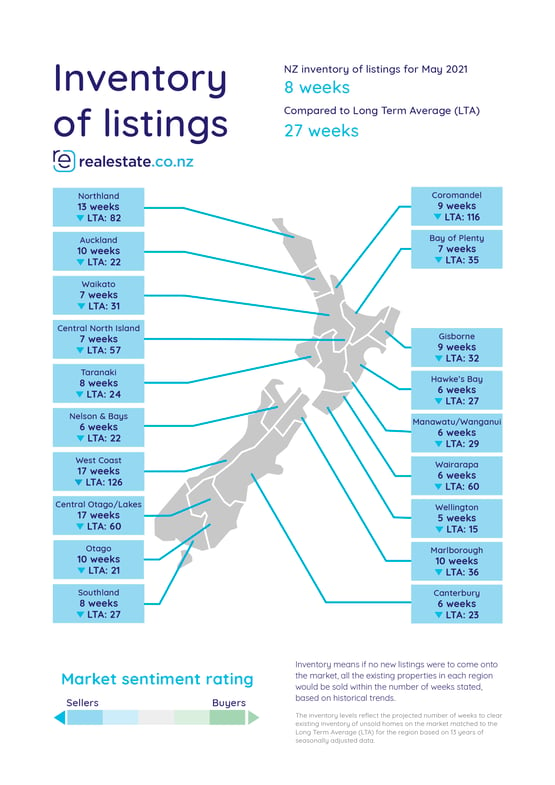
Gisborne was the only region in the country that didn’t record a year-on-year decrease in inventory last month, bucking the trend with 14.8% more stock than May 2020.
Coromandel and Central North Island had the lowest stock compared to 2020, decreasing by 62.3% and 54.7% respectively.
National asking price surpasses $840k; record prices in four regions
Real-time data shows that average asking prices were up 15.3% year-on-year in May, with four regions hitting record asking price highs.
The average asking price for Kiwi properties was $841,816 in May, up slightly from $838,290 in April.
“Although there are signs of market activity cooling, this hasn’t yet been reflected in year-on-year prices, which are still significantly up,” says Vanessa.
“However, we have seen 10 of our 19 regions show a drop in price from April to May. While it’s too early to tell whether prices are starting to trend downwards, this is something we’ll be watching closely in coming months.”
The average asking prices in Auckland reached a record high of $1,117,757 in May. A home in the super-city now costs on average $157,642 more than the same time last year.
Taranaki reached a record high for the second consecutive month, with a home in the region now asking $571,962 on average.
14-year record average asking prices were also recorded in Nelson & Bays and Otago, up 13.3% and 13.0% respectively compared to May 2020.
ENDS
For media enquiries, please contact:
Trish Fitzsimons | 021 022 96927 | trish@realestate.co.nz
About realestate.co.nz
Established before Google, in 1996, realestate.co.nz is New Zealand’s longest-standing property site. With residential, lifestyle, rural and commercial property listings available, realestate.co.nz is the place where serious buyers look for property. Dedicated to property, realestate.co.nz has no private sales and has search functionality that’s second to none to get you to your perfect property faster.
Glossary of terms:
As the only provider of real estate data in real-time, realestate.co.nz offers valuable property market information not available from other sources.
- Average asking price is not a valuation. It is an indication of current market sentiment. Statistically, asking prices tend to correlate closely with the sales prices recorded in future months when those properties are sold. As it looks at different data, average asking prices may differ from recorded sales data released at the same time.
- Inventory is a measure of how long it would take, theoretically, to sell the current stock at current average rates of sale if no new properties were to be listed for sale. It provides a measure of the rate of turnover in the market.
- New listings are a record of all the new listings on realestate.co.nz for the relevant calendar month. As realestate.co.nz reflects 97% of all properties listed through registered estate agents in New Zealand, this gives a representative view of the New Zealand property market.
- Demand: the increase or decrease in the number of views per listing in that region, taken over a rolling three-month time frame, compared to the same three-month time frame the previous year – including the current month.
- Seasonal adjustment is a method realestate.co.nz uses to better represent the core underlying trend of the property market in New Zealand. This is done using methodology from the New Zealand Institute of Economic Research.
- Truncated mean is the method realestate.co.nz uses to provide statistically relevant asking prices. The top and bottom 10% of listings in each area are removed before the average is calculated, to prevent exceptional listings from providing false impressions.
Share
-
.svg)
.svg)
.svg)