
.svg)


Auckland average asking price hits a $1 million record while national stock remains at a record low.
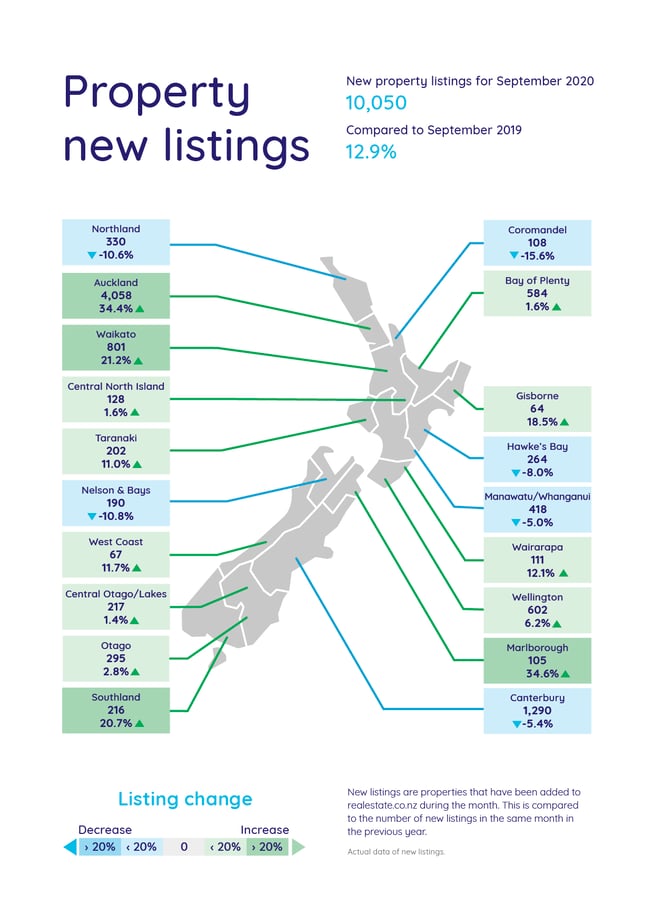
Real-time data from realestate.co.nz shows that despite a year on year increase in new listings over the past four months, low total stock numbers around the country are still driving high asking prices.
The average asking price in Auckland tipped over $1 million for the first time since records began, while Taranaki and Central North Island also reached 13-year record highs.
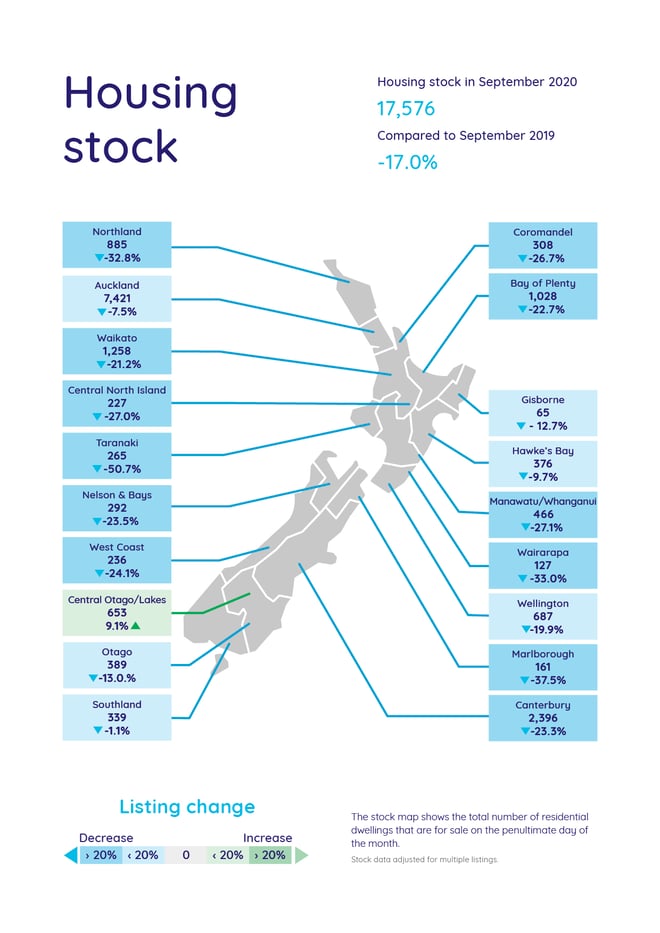
Vanessa Taylor, spokesperson for realestate.co.nz, says that nationally demand is still outstripping supply with the total number of homes available for sale in September down 17.0% on the same month in 2019.
“We’re continuing to see a housing shortage in New Zealand with 10 of 19 regions hitting record total stock lows. Demand also remains high with over 1.25 million users recorded on realestate.co.nz in September 2020,” says Vanessa.
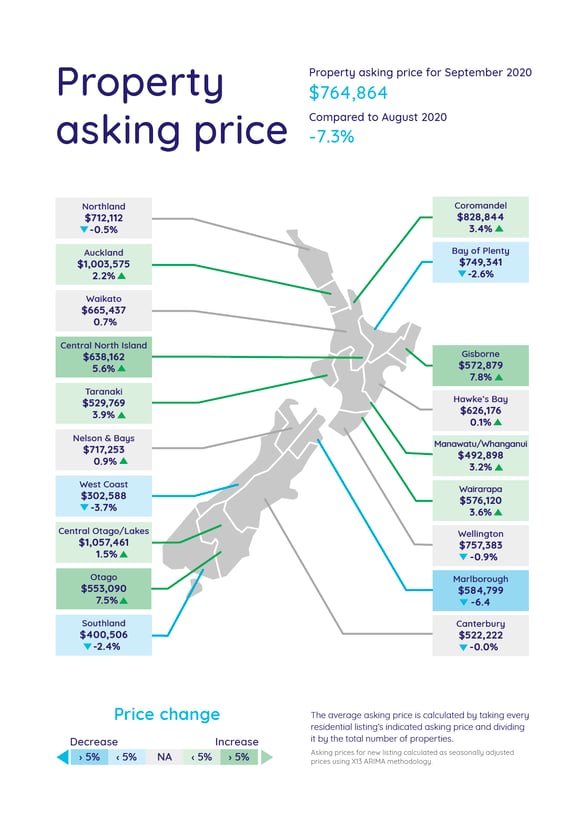
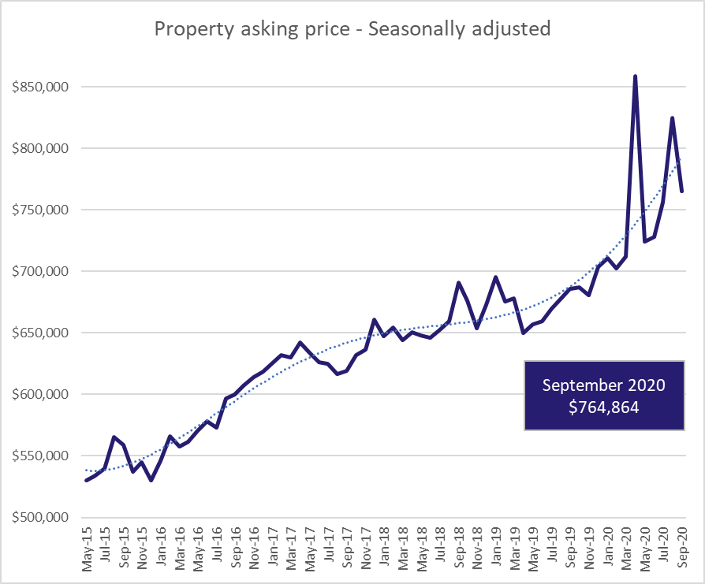
The national average asking price was up by 11.5% year on year to $764,864, although prices were pegged back from their August highs.
“After a large jump in national asking prices in August, we’ve seen a 7.3% decrease in September which suggests prices are now starting to normalise.”
“It is typical to see peaks to average asking prices from time to time and high demand for property post-COVID-19 has suggested the rise in prices. However, the national average asking price now sits closer to the trend line,” says Vanessa.
Average asking price in Auckland tops $1 million for the first time since records began 13-years ago
Reaching a record high, the average asking price in Auckland rose 9.5% year on year in September 2020. The asking price in Auckland was $1,003,575 in September – up from $916,162 for the same period in 2019.
Climbing 2.2% on August 2020, the average asking price in Auckland has been sitting above $950,000 since January this year. Vanessa says it will be interesting to see whether prices in the region hold or drop back to the mid to high $950,000 mark.
“With the national average asking price dropping 7.3% in September compared to the previous month we are seeing average asking prices beginning to normalise around the country. But only time will tell whether we see this tempering in Auckland or whether high demand sees prices continuing to trend upwards.”
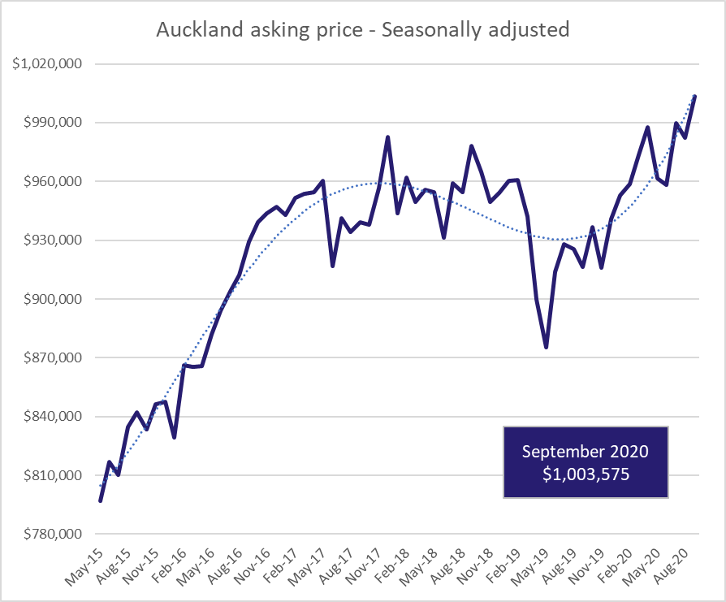
Note: as visible in the above graph, house prices did skew upwards in April 2020 as a result of Kiwis being unable to list their properties due to the nationwide lockdown. With less than 2,000 new listings coming onto the market in Auckland in April 2020 compared to almost 5,000 in September 2020, prices in April were inflated by a lack of supply.
Record low stock levels continue to provide limited choice for buyers in the Auckland region, with 7.5% fewer properties available on the market than the same time last year. However, vendors in the region did remain active in September with new listings coming onto the market in the region up by 34.4% on the same time last year.
Record low stock levels drive Taranaki asking prices to 13-year high
After increasing steadily since the start of 2020, the average asking price in Taranaki reached an all-time high of $529,769 in September.
Although new listings in the region increased by 11.0% year on year in September, stock remains at its lowest level since records began in 2007.
“Taranaki stock levels are down 50.7% on the same time last year, with just 265 total homes available for sale,” says Vanessa.
Compared to September 2019, the average asking price in Taranaki was up 20.4%.
“The average house sale in Taranaki now asks over half a million dollars - close to $90,000 more than it did at the same time last year.”
“We are seeing prices being driven up by our regions at the moment – nearby Central North Island and Gisborne saw some of the biggest month on month increases in September with asking prices up 5.6% (to $638,162) and 7.8% (to $572,879) respectively,” says Vanessa.
Central Otago/Lakes bucks national trend with a 9.1% increase in housing stock
While nationwide housing stock was down 17.0% year on year, Central Otago/Lakes bucked the trend with a 9.1% stock increase – the only region with more properties available this September compared to the same period in 2019.
Although asking prices are holding steady, this indicates that demand in the region isn’t quite as high as we are seeing in other places, says Vanessa.
“With the borders shut, we are hearing of Kiwis flocking to hotspots in the region like Queenstown. However, it seems that our appetite for property in this region does not match our desire to holiday there.”
There are 653 properties currently available for purchase in Central Otago/Lakes. New listings are up 8.0% on August this year, and 1.4% higher than for the same time in 2019.
For media enquiries, please contact:
Trish Fitzsimons | 021 022 96927 | trish@realestate.co.nz
About realestate.co.nz
Established before Google, in 1996, realestate.co.nz is New Zealand’s longest-standing property site. With residential, lifestyle, rural and commercial property listings available, realestate.co.nz is the place where serious buyers look for property. Dedicated to property, realestate.co.nz has no private sales and has search functionality that’s second to none to get you to your perfect property faster.
Glossary of terms:
As the only provider of real estate data in real-time, realestate.co.nz offers valuable property market information not available from other sources.
- Average asking price is not a valuation. It is an indication of current market sentiment. Statistically, asking prices tend to correlate closely with the sales prices recorded in future months when those properties are sold. As it looks at different data, average asking prices may differ from recorded sales data released at the same time.
- Inventory is a measure of how long it would take, theoretically, to sell the current stock at current average rates of sale if no new properties were to be listed for sale. It provides a measure of the rate of turnover in the market.
- New listings are a record of all the new listings on realestate.co.nz for the relevant calendar month. As realestate.co.nz reflects 97% of all properties listed through registered estate agents in New Zealand, this gives a representative view of the New Zealand property market.
- Demand: the increase or decrease in the number of views per listing in that region, taken over a rolling three-month time frame, compared to the same three-month time frame the previous year – including the current month.
- Seasonal adjustment is a method realestate.co.nz uses to better represent the core underlying trend of the property market in New Zealand. This is done using methodology from the New Zealand Institute of Economic Research.
- Truncated mean is the method realestate.co.nz uses to provide statistically relevant asking prices. The top and bottom 10% of listings in each area are removed before the average is calculated, to prevent exceptional listings from providing false impressions.
Share
-
.svg)
.svg)
.svg)