
.svg)


HOUSING STOCK SHORTAGE DRIVES HEALTHY AVERAGE ASKING PRICES
Despite a lift in new listings coming onto the market since lockdown, low stock around the country is driving prices north according to real-time data from realestate.co.nz.
Nationally, the total number of homes available for sale in July was down 11.0% on the same month in 2019 while the national average asking price increased by 3.9% to $756,250. Vanessa Taylor, spokesperson for realestate.co.nz, says that despite speculation around prices dropping post-COVID-19, the market seems to be performing well.
“It has been three months since the country moved to alert level three and, while we can never say never, we simply haven’t seen the drop that many were predicting,” says Vanessa.
Vanessa says that New Zealand’s housing shortage remains an issue and that it is likely exacerbated by Kiwis returning home from overseas.
All-time asking price highs in five regions, and prices also up nationally.
Asking prices were up in nearly all regions last month with 13-year all-time asking price highs in Northland, Auckland, Hawke’s Bay, Coromandel, and Manawatu/Whanganui.
Omitting the data from the lockdown in April, where prices were skewed upwards as a result of Kiwis being unable to list their properties, we would have also seen a national all-time asking price high last month. Marlborough would have also reached a record high in July when April’s anomaly prices are removed.
Vanessa says that, with less than 3,000 new listings coming onto the market in April 2020 compared to almost 9,000 in July 2020, prices in April were inflated by a lack of supply. Removing April’s prices from the data gives us a better indication of what is happening in the market.
“Taking out April’s national asking price spike of $858,432, the national average asking price has been trending upwards since the end of last year and this hasn’t slowed down post-lockdown,” says Vanessa.
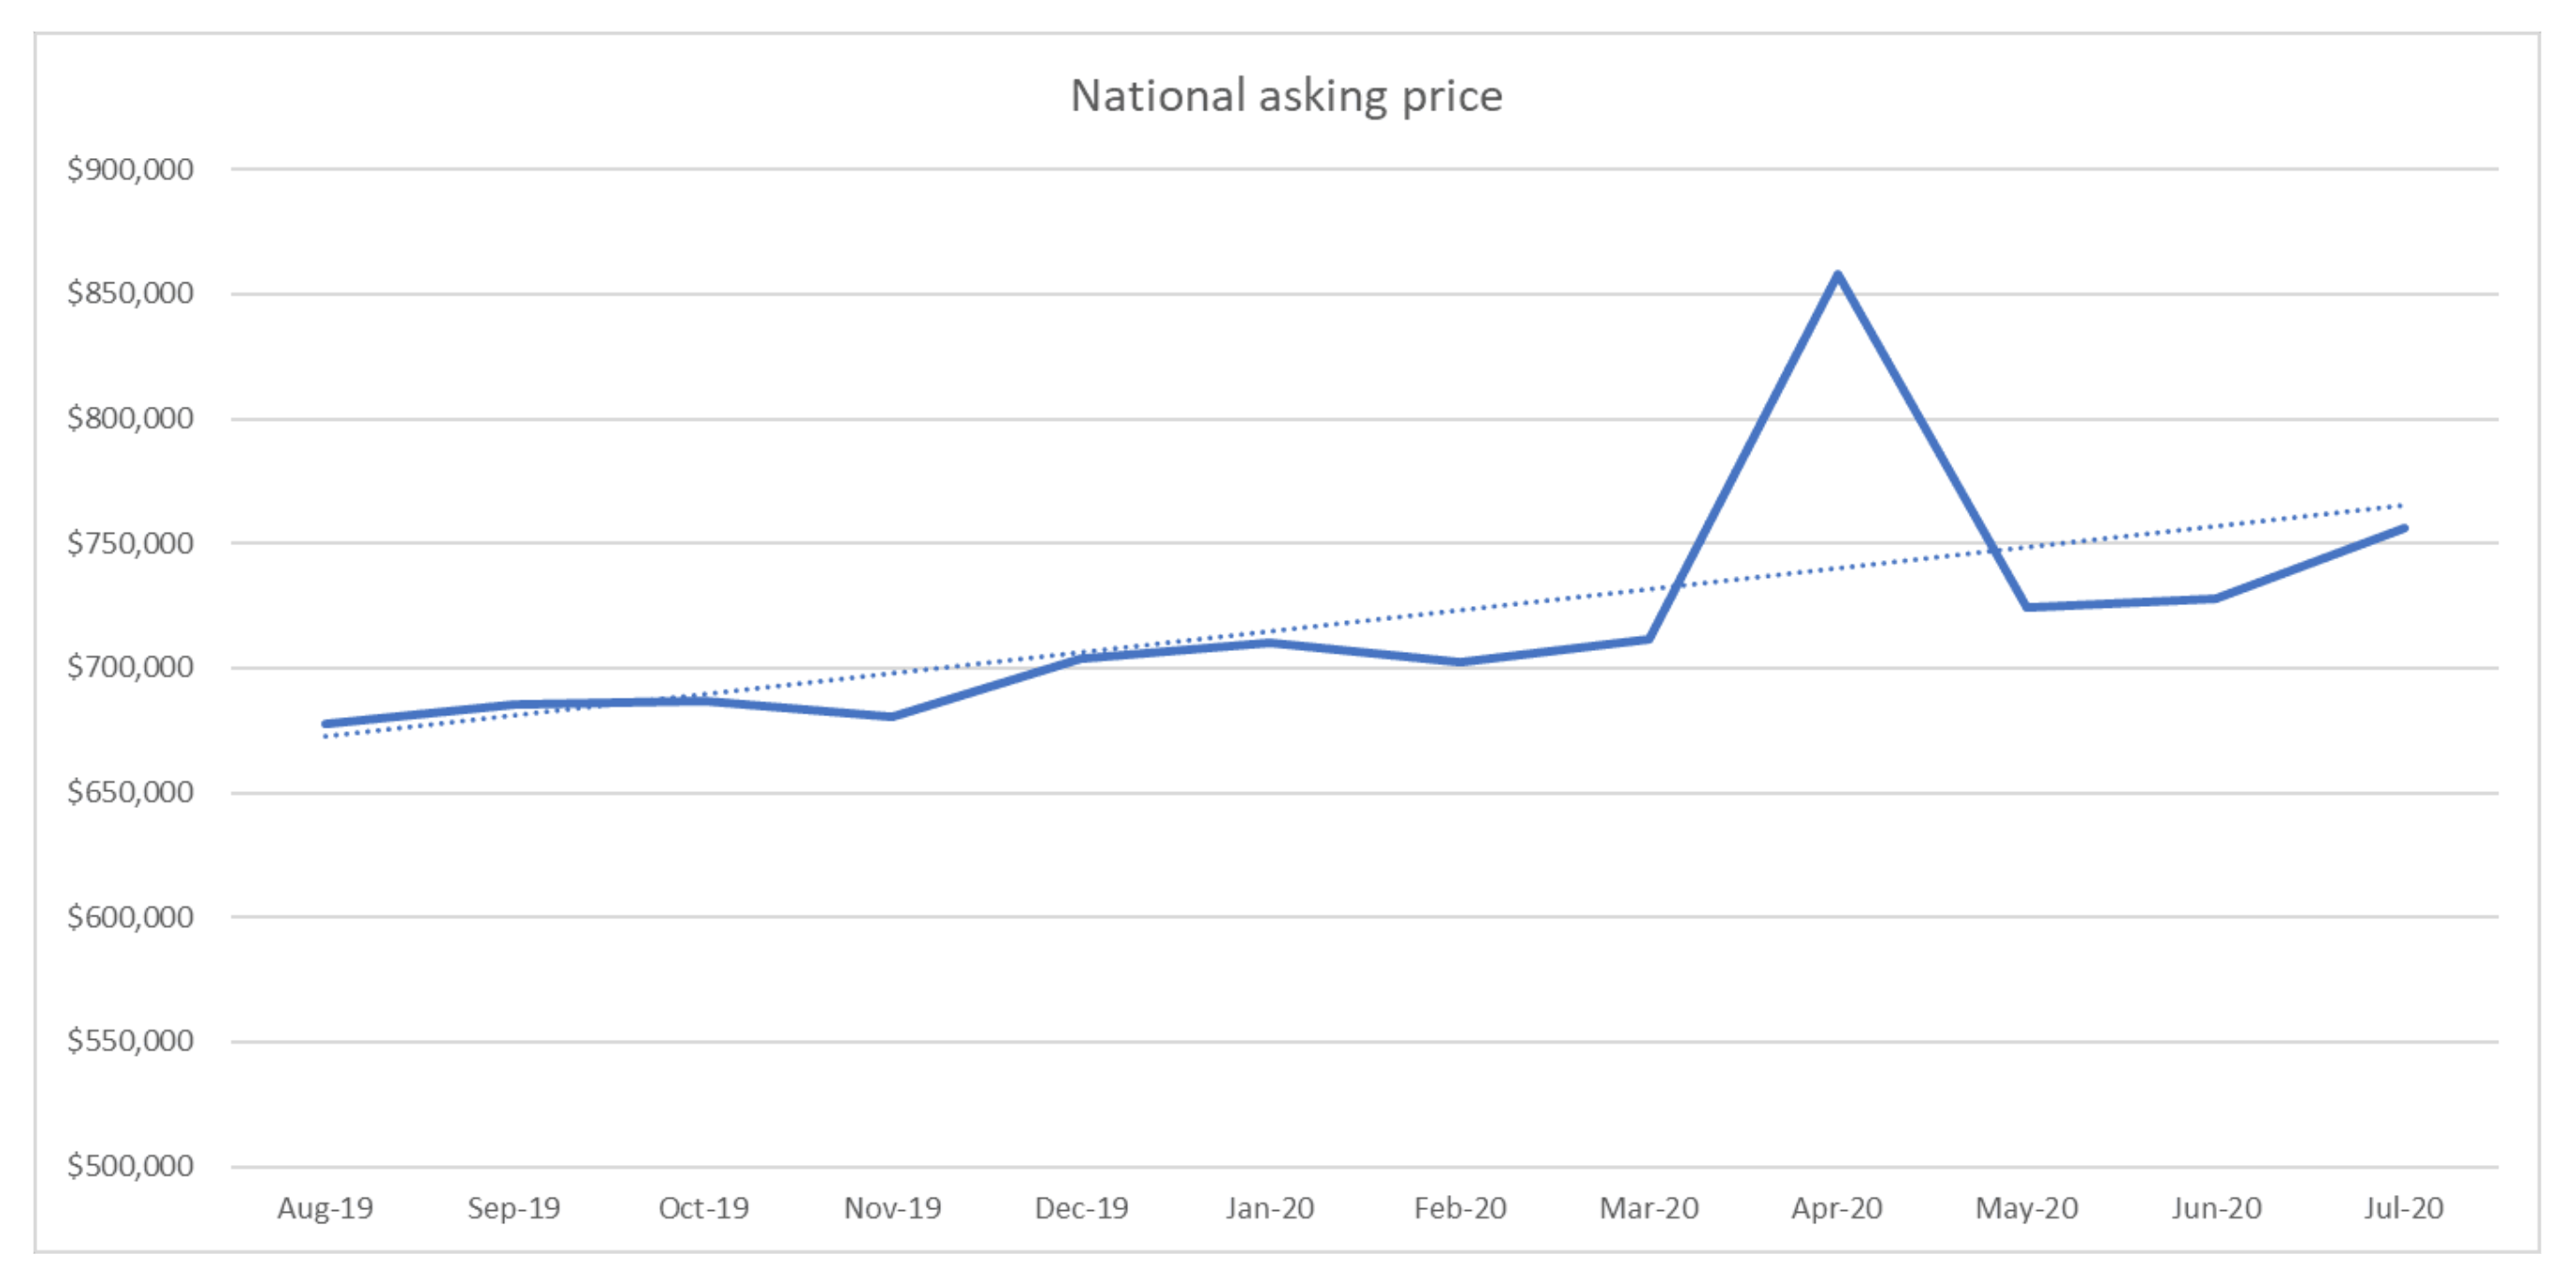
Month-on-month, July’s national average asking price increased by 3.9% on June 2020. Vanessa says that asking price highs won’t be good news for those hoping for a bargain, but that it may give confidence to those thinking of selling. 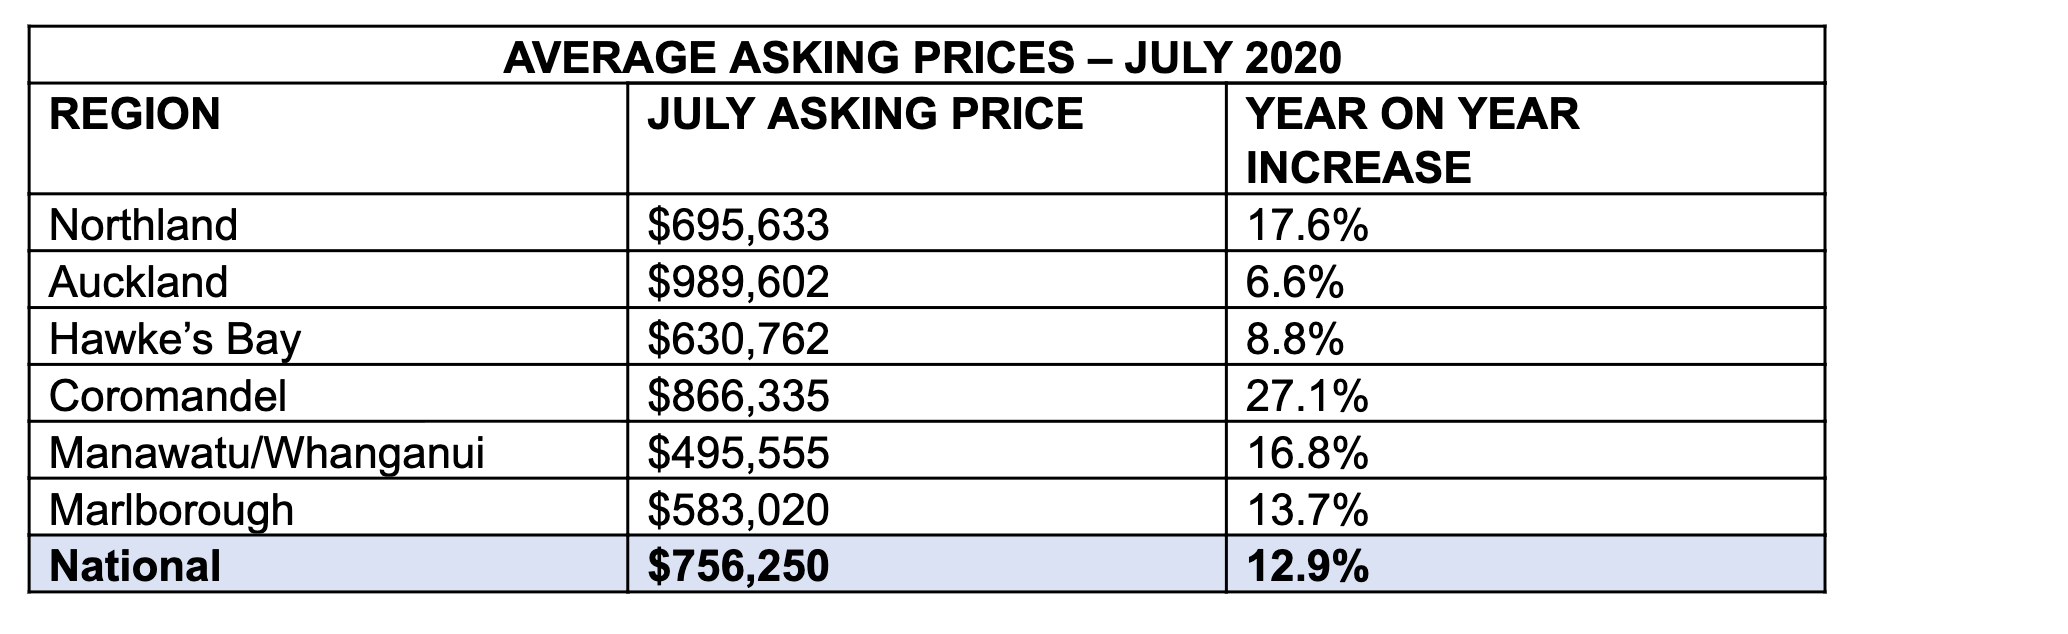
![]()
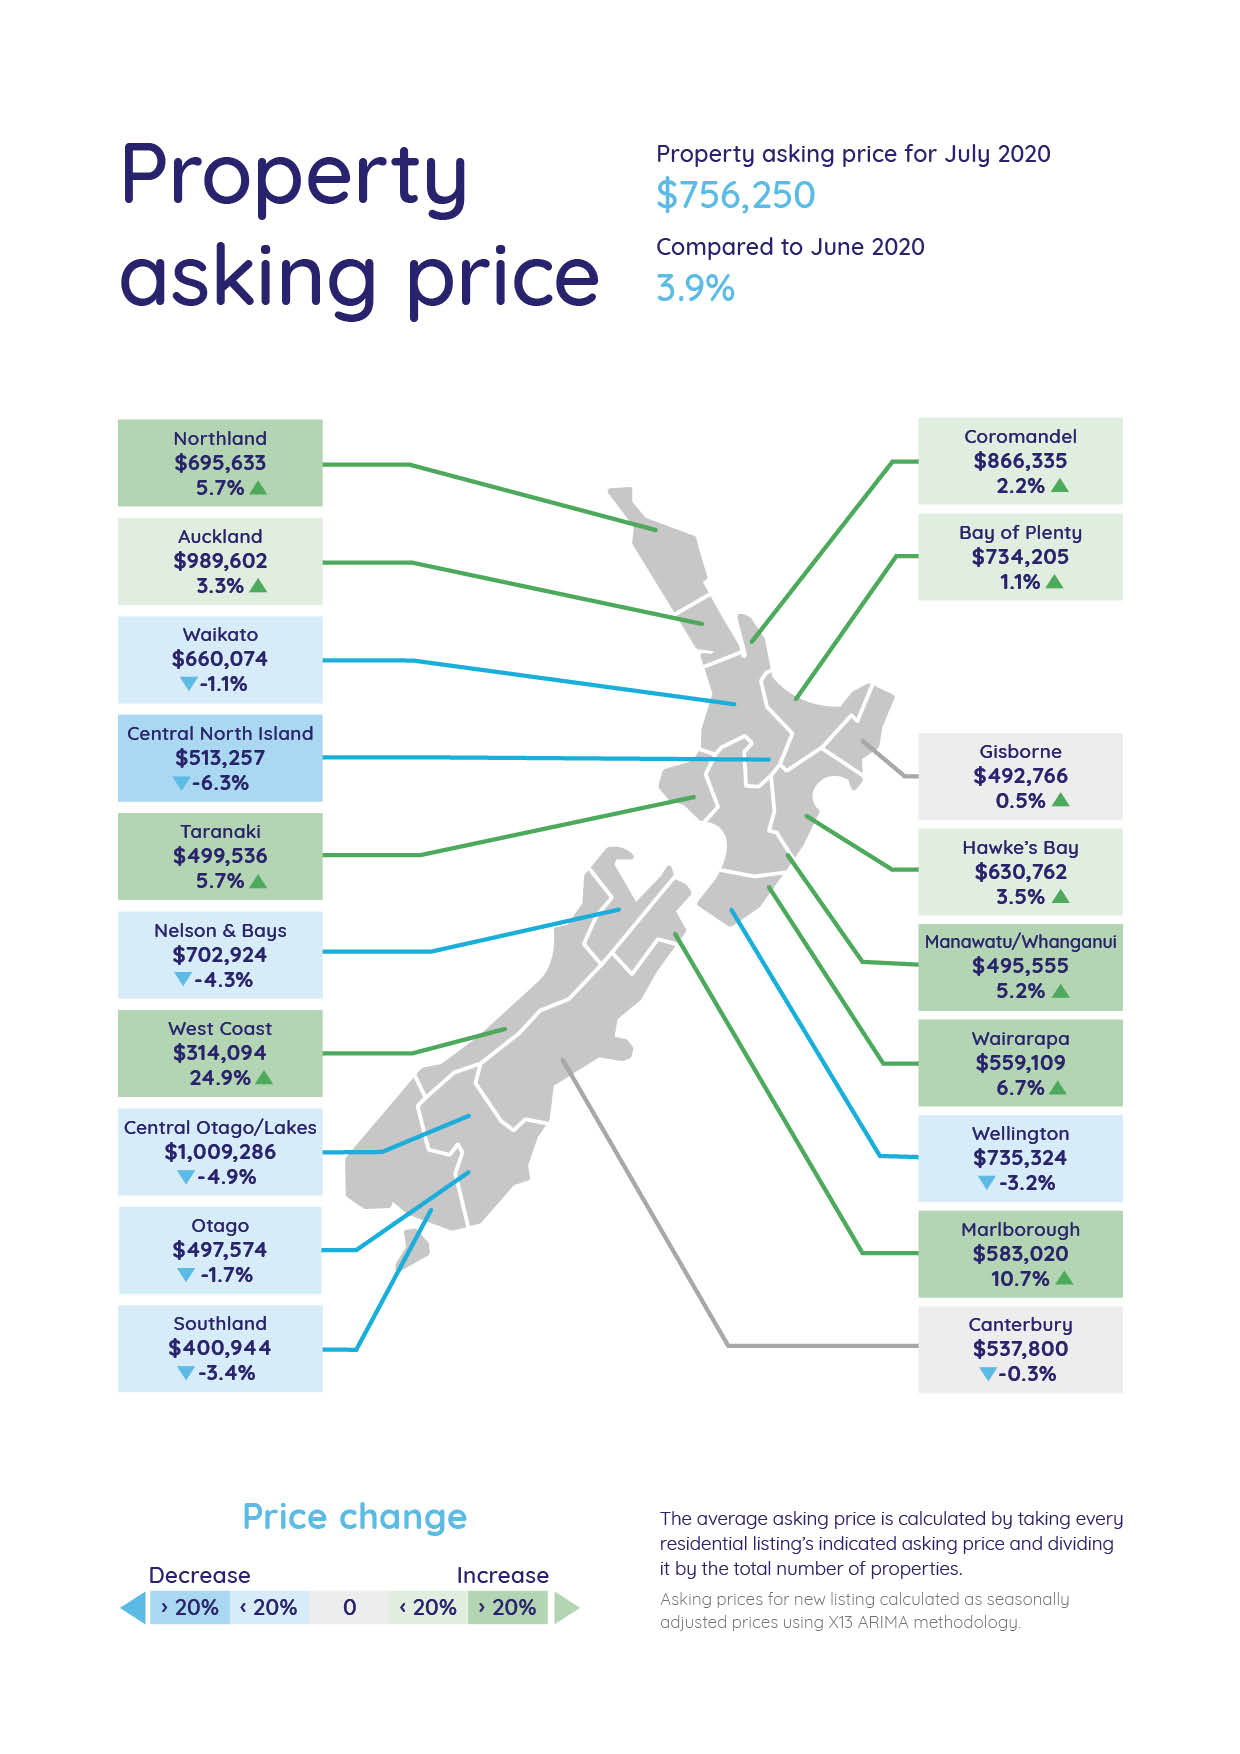
High asking prices driven by 13-year record stock lows in 10 of 19 regions
Northland, Gisborne, Taranaki, West Coast, Canterbury, Coromandel, Marlborough, Wairarapa, Central North Island, and Manawatu/Whanganui all saw 13-year record stock lows in July.
The biggest drops were in Taranaki, Wairarapa, and Marlborough where total homes available for sale (stock) decreased by 48.4%, 46.2% and 41.0% respectively.
Vanessa says that record lows in more than half of our regions could be seen as the driver behind the high average asking prices around the country last month.
“The New Zealand property market is a case of demand and supply; when housing stock is low, prices increase because demand is outstripping supply. And based on realestate.co.nz user data, we are seeing high demand for property right now,” says Vanessa.
Real-time user data from realestate.co.nz shows that the total number of users to the site in July increased by 16.1% when compared to July 2019, while the average session duration increased by more than 12.6%.
Bucking the stock trend, however, the Hawke’s Bay, Central Otago/Lakes, Southland, and Otago saw total homes available for sale increase by 17.8%, 17.8%, 10.2% and 1.2% respectively.
“Except for in the Hawke’s Bay where prices increased by 3.5%, the stock increases in these regions were reflected by a decrease in average asking prices,” says Vanessa.
Average asking prices decreased month on month by 4.9% in Central Otago/Lakes, 1.7% in Otago, and 3.4% in Southland.
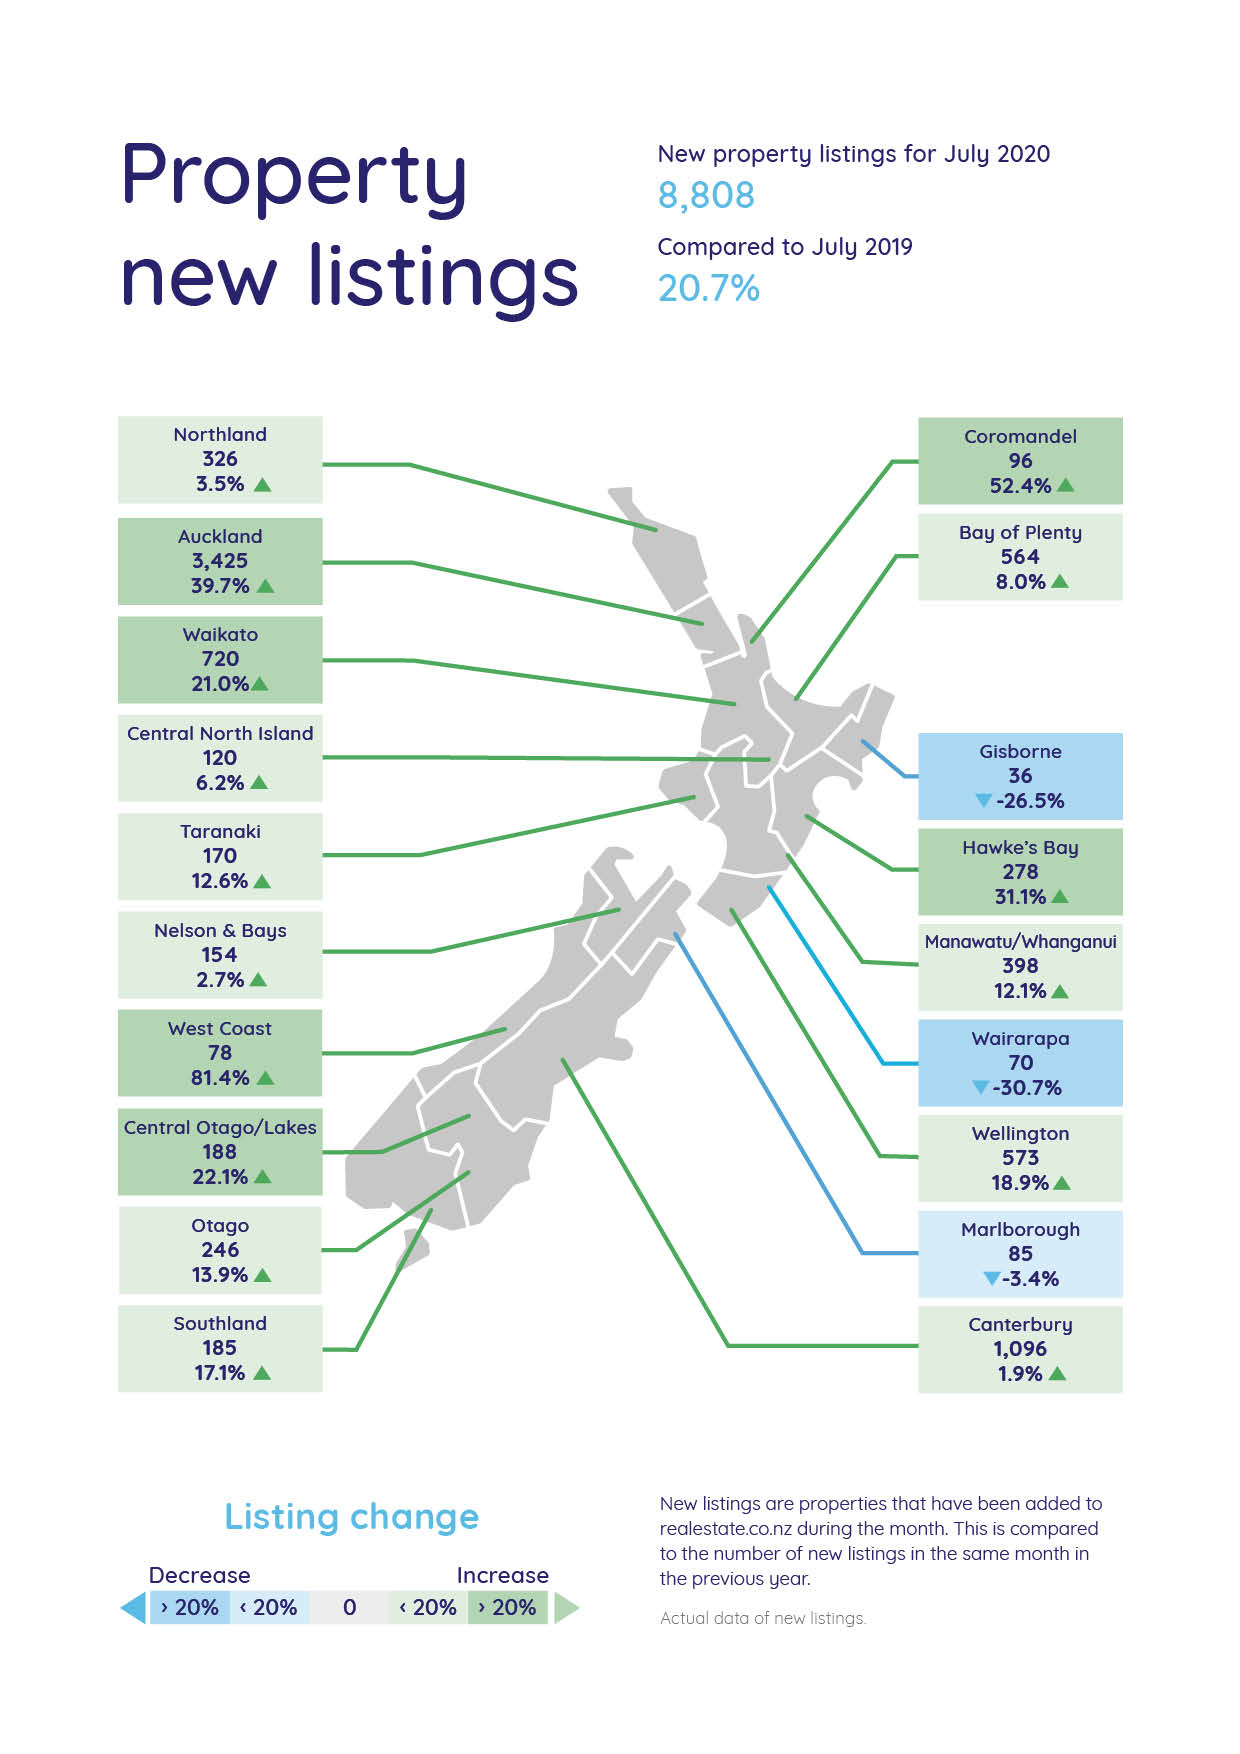
![]() New listings up by 20.7% nationally
New listings up by 20.7% nationally
Buyers had plenty of fresh stock to choose from last month with new listings coming onto the market up 20.7% on the same time last year. But soaring demand and low stock across the country signals that buyers were also snapping up new listings at pace during July.
Vanessa says that while the significant increase in new listings compared to last year is promising, the influx of Kiwis returning home is likely increasing demand and putting pressure on an already cramped market.
“Statistics New Zealand has reported record numbers of more than 47,000 Kiwis returning home since border restrictions began in March and I think we can expect that some of this extra demand is a result of this,” says Vanessa.
Data from realestate.co.nz shows that international traffic to the site since April has also increased by 12.9% suggesting that Kiwis abroad may have been searching for property ahead of their return. New users to realestate.co.nz were also up in July which could indicate that these new property seekers are driving demand.
Compared to July 2019, the biggest increases in new listings were in the West Coast (81.0%, 78 listings), Coromandel (52.4%, 96 listings), and Auckland (39.7%, 3,425 listings).
The only regions to see new listings decrease last month were Gisborne (26.5%), Wairarapa (30.7%), and Marlborough (3.4%).
![]() All-time asking price highs and stable demand in Manawatu/Whanganui
All-time asking price highs and stable demand in Manawatu/Whanganui
The average asking price in Manawatu/Whanganui has been increasing steadily since the beginning of 2019 and last month’s all-time high of $495,555 saw the region’s average asking price inch closer to the $500,000 mark.
Compared to July 2019, the average asking price is up 16.8% which reflects the consistent price climb we have seen in the region over the last few years. The region’s average asking price in July 2018 was $357,206 – $138,349 less than the region’s latest high.
Like the rest of the country, the increase in new listings and low stock suggests demand in the region is high. Vanessa says this may be good news for sellers in the region.
“New listings in the region increased by 12.1% year-on-year in July but the 13-year record stock low, to just 580 total homes available for sale, tells us that demand is outstripping supply,” says Vanessa.
![]() For media enquiries, please contact:
For media enquiries, please contact:
Trish Fitzsimons | 021 022 96927 | trish@realestate.co.nz
About realestate.co.nz
Established before Google, in 1996, realestate.co.nz is New Zealand’s longest-standing property site. With residential, lifestyle, rural and commercial property listings available, realestate.co.nz is the place where serious buyers look for property. Dedicated to property, realestate.co.nz has no private sales and has search functionality that’s second to none to get you to your perfect property faster.
Glossary of terms:
As the only provider of real estate data in real-time, realestate.co.nz offers valuable property market information not available from other sources.
- Average asking price is not a valuation. It is an indication of current market sentiment. Statistically, asking prices tend to correlate closely with the sales prices recorded in future months when those properties are sold. As it looks at different data, average asking prices may differ from recorded sales data released at the same time.
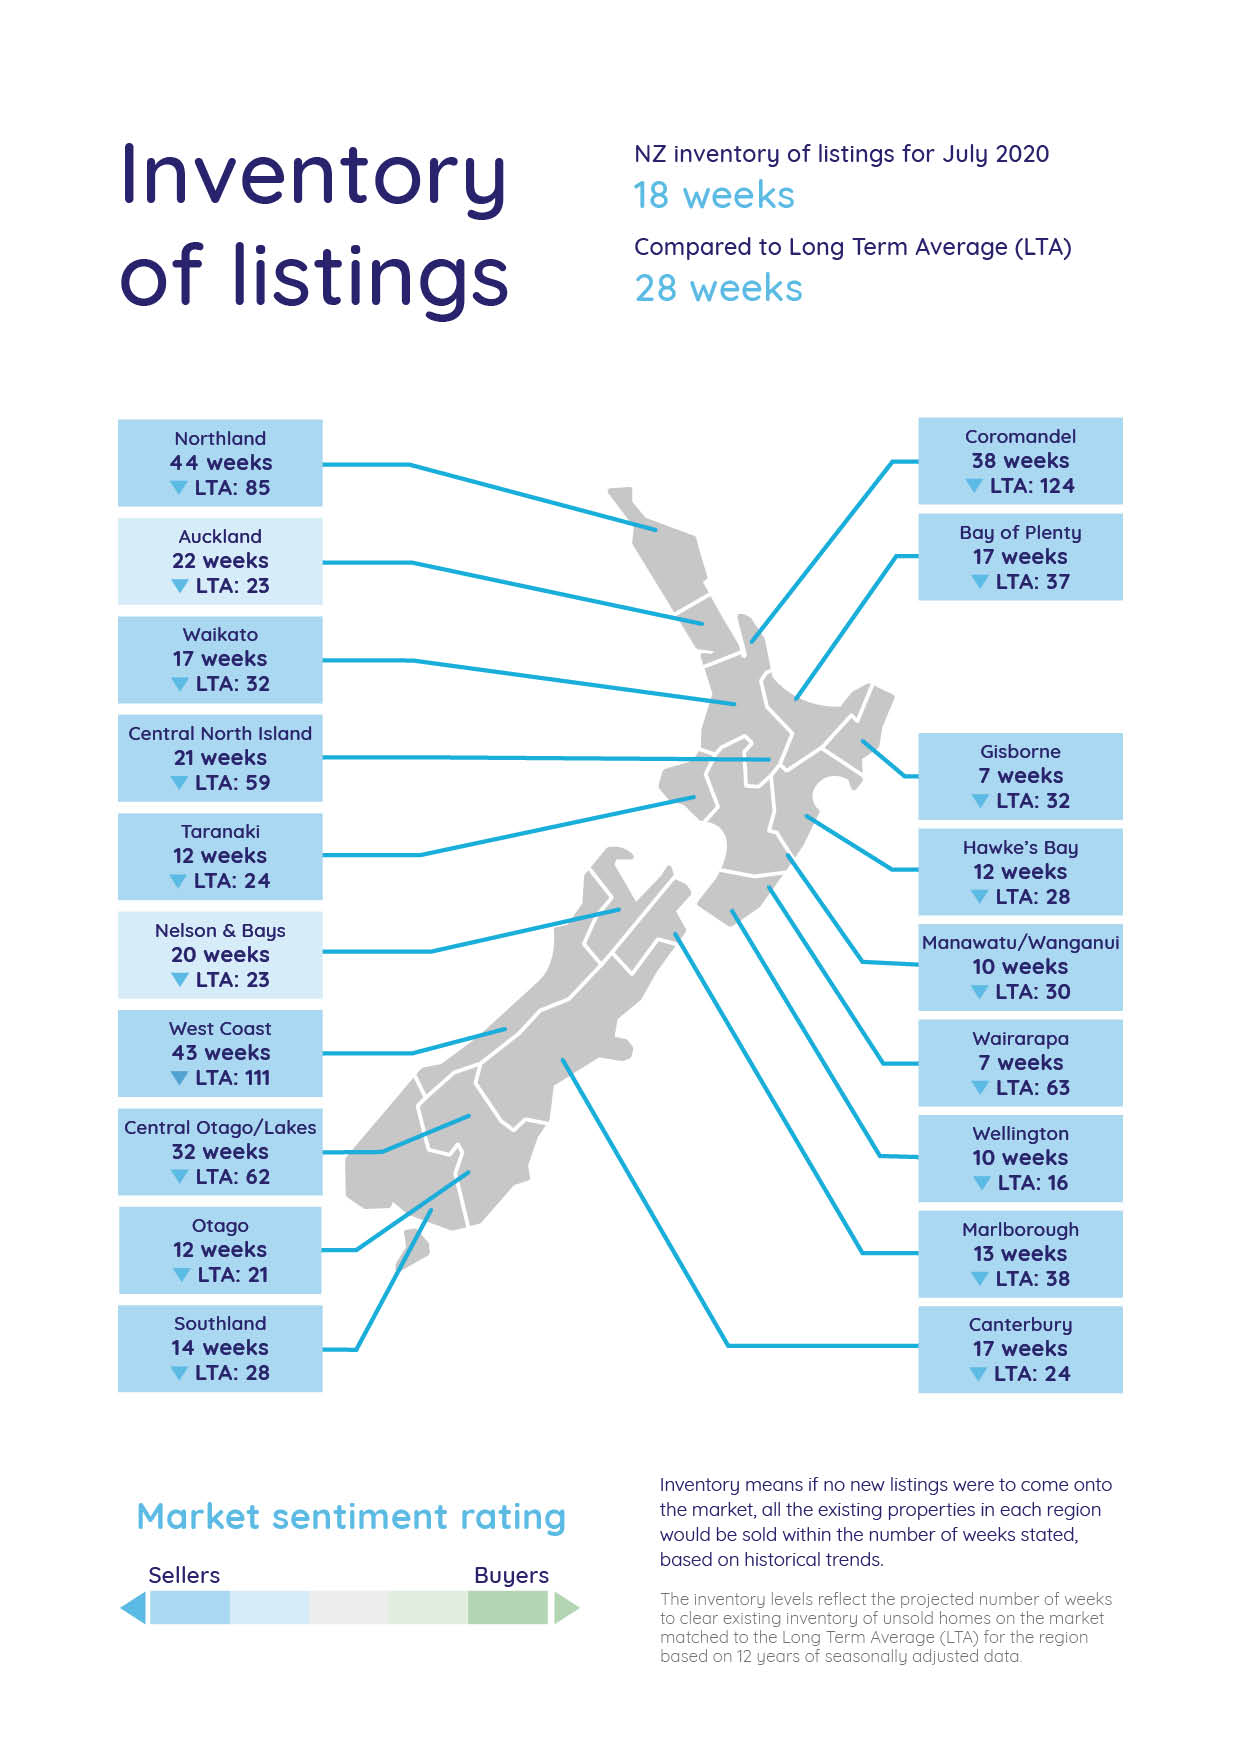
- Inventory is a measure of how long it would take, theoretically, to sell the current stock at current average rates of sale if no new properties were to be listed for sale. It provides a measure of the rate of turnover in the market.
- New listings are a record of all the new listings on realestate.co.nz for the relevant calendar month. As realestate.co.nz reflects 97% of all properties listed through registered estate agents in New Zealand, this gives a representative view of the New Zealand property market.
- Demand: the increase or decrease in the number of views per listing in that region, taken over a rolling three-month time frame, compared to the same three-month time frame the previous year – including the current month.
- Seasonal adjustment is a method realestate.co.nz uses to better represent the core underlying trend of the property market in New Zealand. This is done using methodology from the New Zealand Institute of Economic Research.
- Truncated mean is the method realestate.co.nz uses to provide statistically relevant asking prices. The top and bottom 10% of listings in each area are removed before the average is calculated, to prevent exceptional listings from providing false impressions.
Share
-
.svg)
.svg)
.svg)