
.svg)


Download the New Zealand Property Report as a print-ready PDF.
Record high asking prices in 11 regions, and record low total stock numbers in 9 regions | Signs of an early spring market for Auckland and Canterbury
August 2018 has been a month of record highs and record lows since realestate.co.nz started collecting data more than 11 years ago, says realestate.co.nz spokesperson Vanessa Taylor.
Real-time statistics from realestate.co.nz show nearly two thirds (11) of the country’s 19 regions hit record high average asking prices in August, while half of the regions (9) registered all-time lows in the number of houses listed for sale.
“Added into the mix is a healthy number of unique browsers in August to realestate.co.nz, which hints at an early spring lift in housing activity,” says Vanessa.
In August, 911,012 unique browsers visited the site, which is a 5.2% increase on July and consistent with summertime browsing levels, she says.
“We’ve had a relatively static housing market since the election period and this lift in interest coincides with a healthy injection of new listings in two of the country’s largest regions.
Of the 8,739 new property listings across the country during August, almost half (4,343) were located in either the Auckland or Canterbury regions.
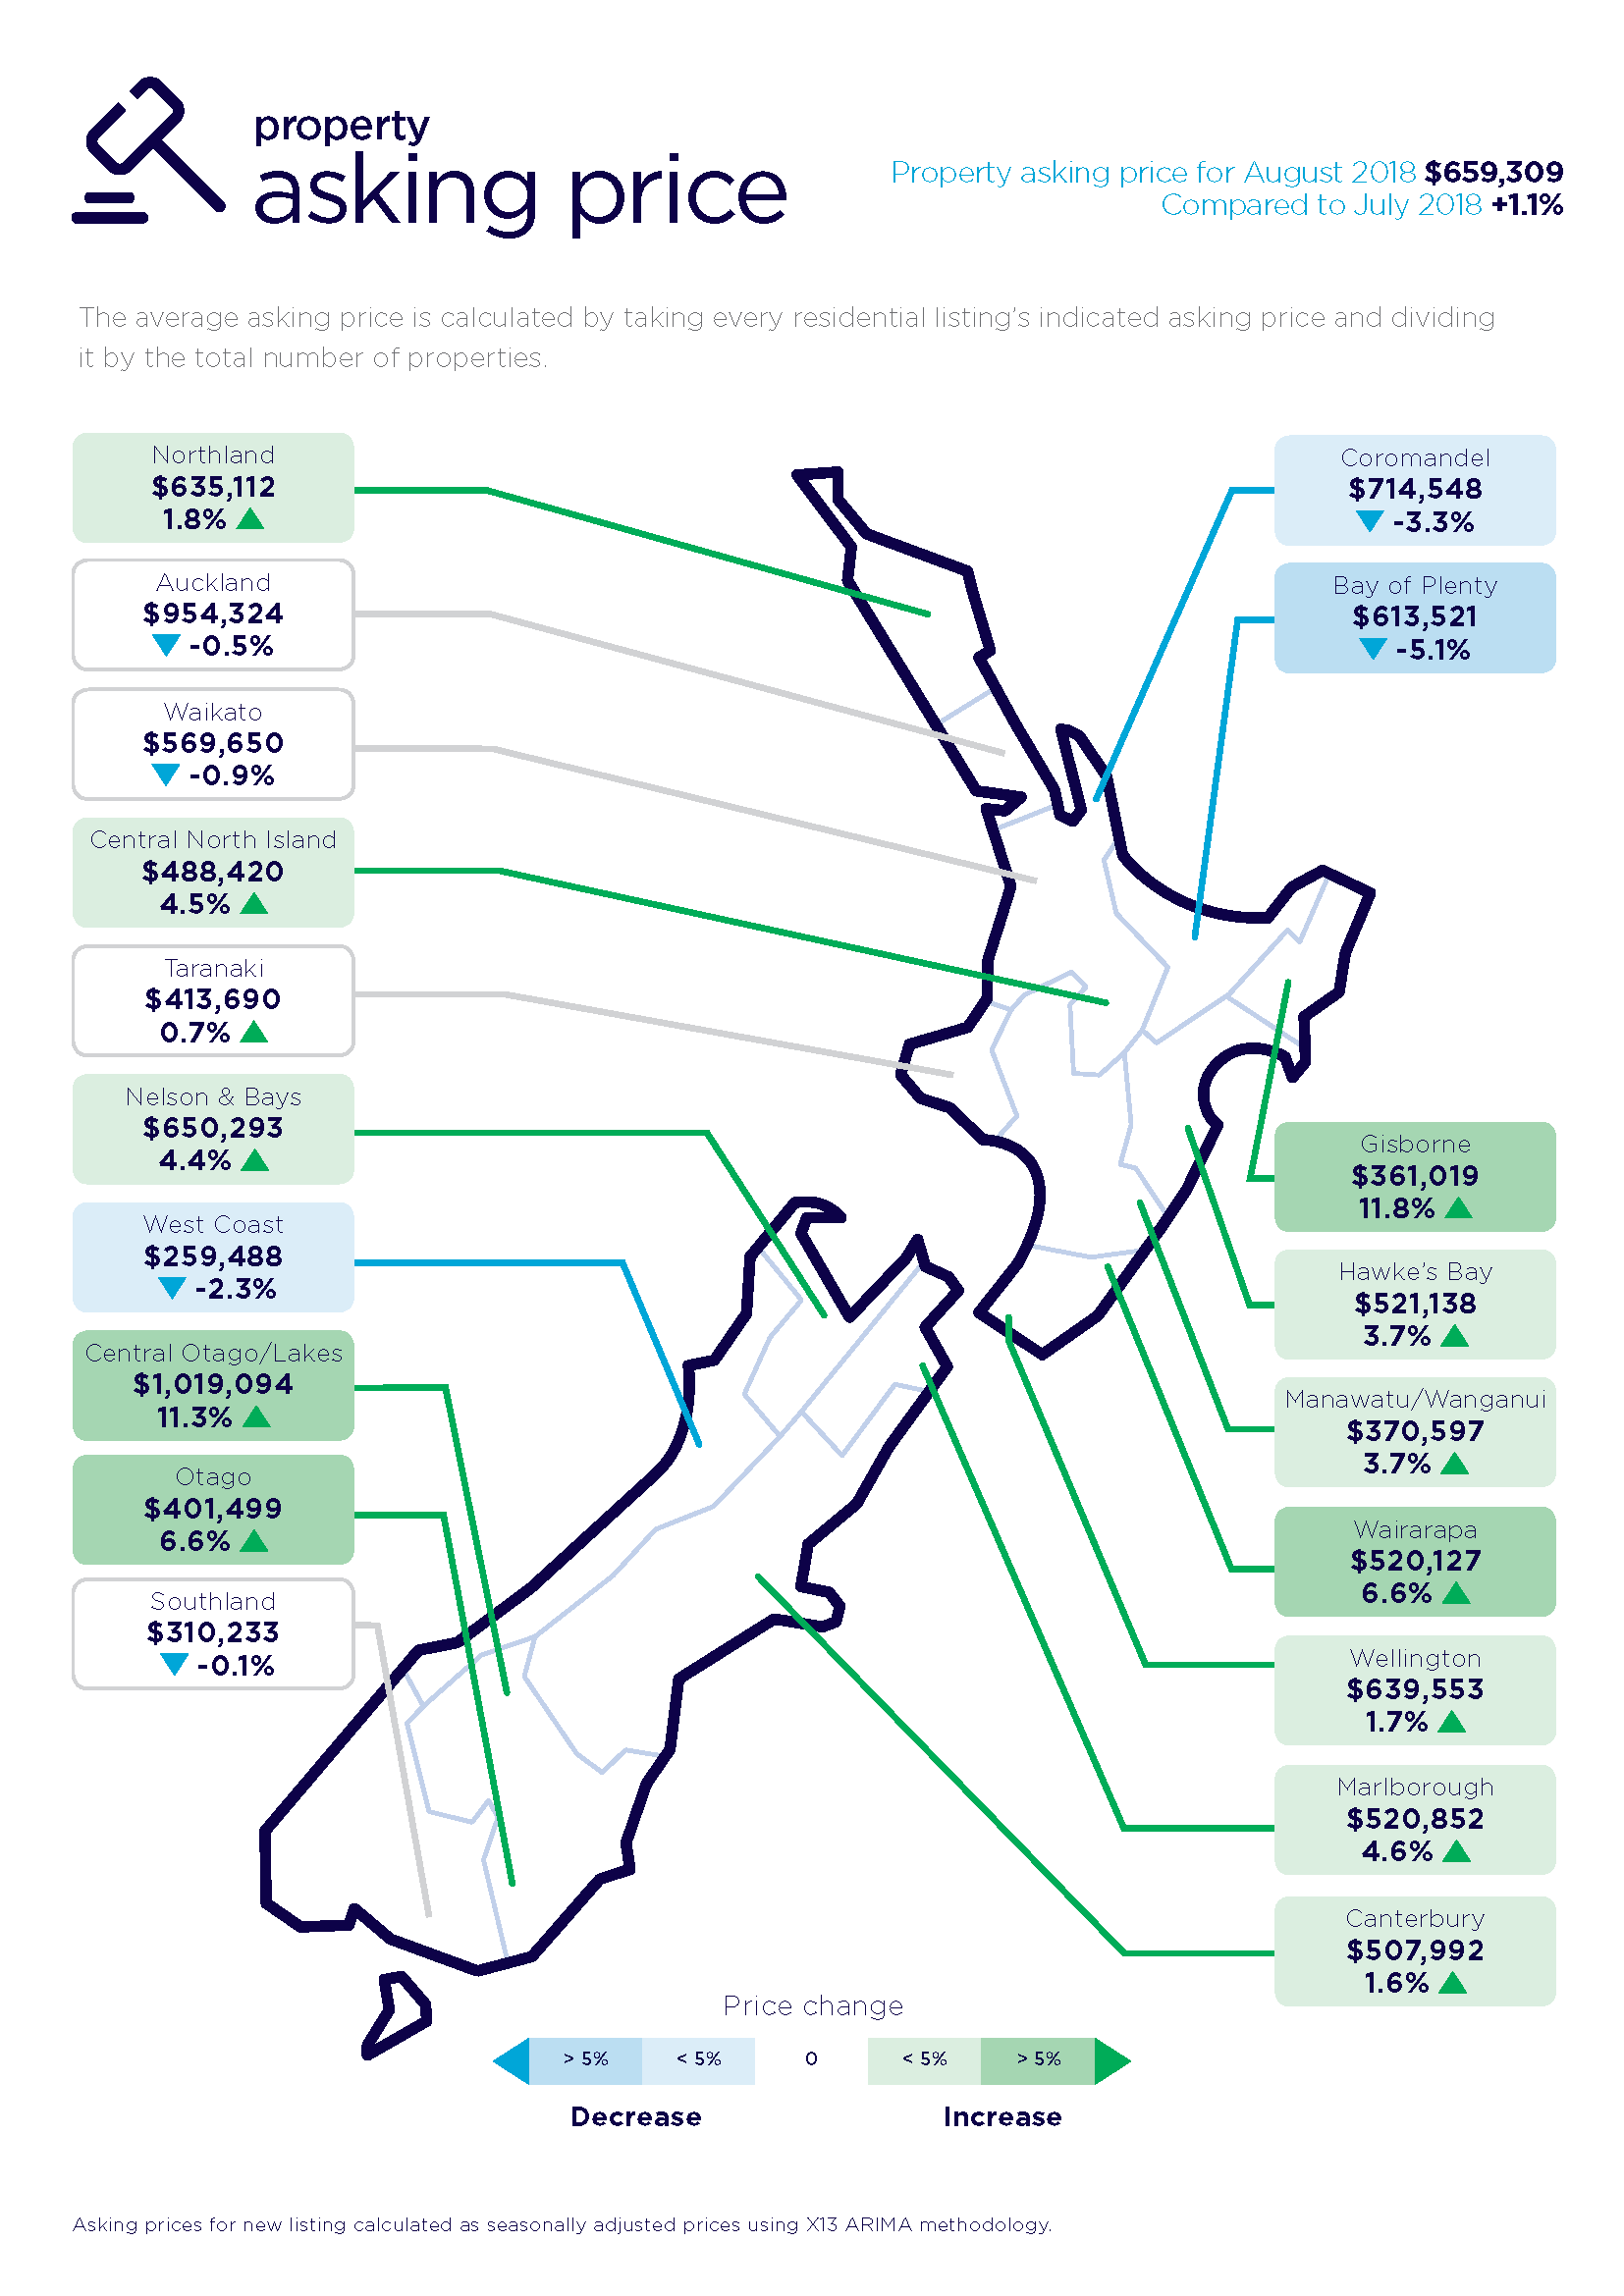
Record increases in asking prices highs in 11 regions
The increase in property asking prices was led by the Central Otago/Lakes District which tipped over the one-million-dollar milestone, with the average asking price sitting at $1,019,094. *
“This is the first region to ever reach the one-million-dollar asking price milestone in the 11 years of data collection history on realestate.co.nz,” says Vanessa.
“Whether Central Otago-Lakes continues to outstrip Auckland as the most expensive region in terms of asking prices remains to be seen,” says Vanessa.
“It’s a smaller market and if there are a significant number of top-end properties coming onto the market at the same time, it can impact the average asking prices.
“Auckland is larger, with a more diverse range of properties, so it’s not always comparing apples with apples,” she says.
While Central Otago-Lakes led the charge with a significant lift in asking prices, there were 10 other regions which recorded record highs in asking prices last month. These regions registered more modest gains and were equally balanced across the North and South Islands.
North Island:
Northland registered a 1.8% increase in asking price to $635,112, Central North Island up 4.5% to $488,420, Hawke’s Bay up 3.7% to $521,138, Manawatu-Wanganui up 3.7% to $370,597, Wairarapa up 6.6% to $520,127 and Wellington up 1.7% to $639,553.
South Island:
Nelson & Bay’s asking prices increased 4.4% to $650,293, Marlborough was up 4.6% to $520,852, Canterbury up 1.6 % to $507,992 and Otago was up 6.6% to $401,499.
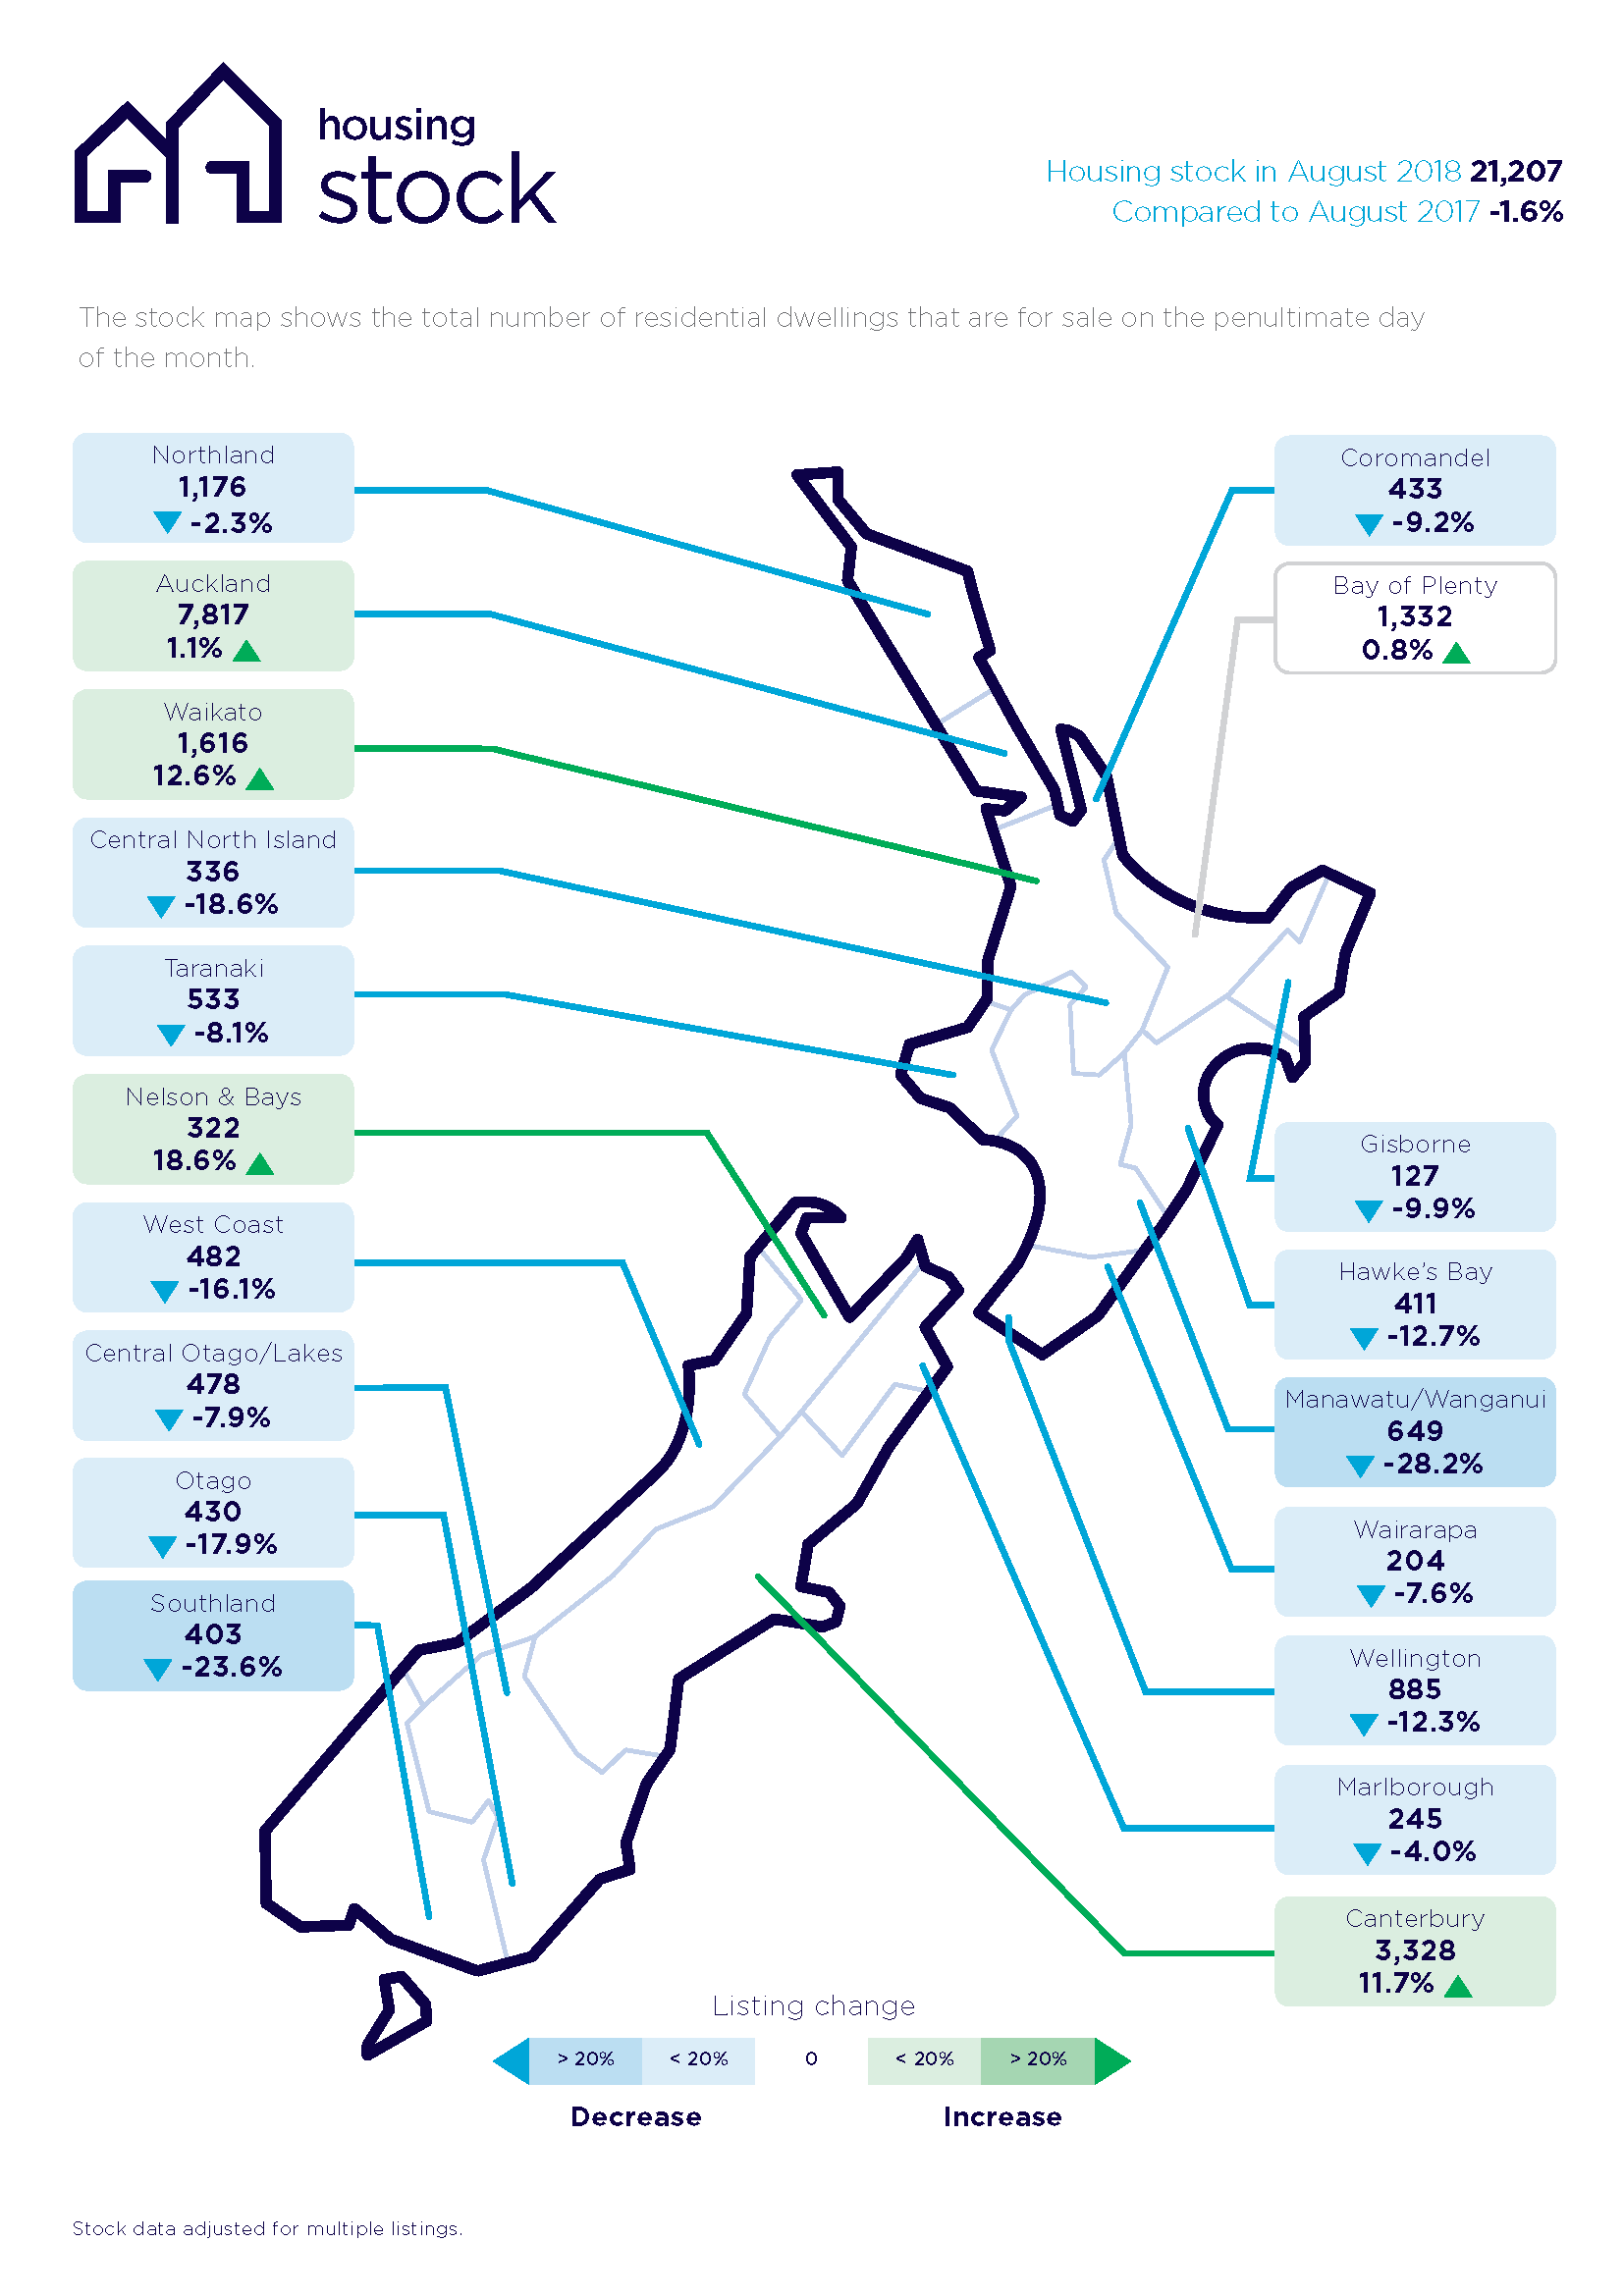
All-time lows in stock levels in nine regions
A fall in housing stock levels nationally has led to a tightening of options. This particularly impacts home buyers in nine regions, all of which registered all-time lows in the number of homes available for sale since 2007 when realestate.co.nz started collecting data.
Nationally, total stock levels in August stood at 21,207 which is down 1.6% on August 2017.
“While this seems on the face of it a modest decline, for the regions with all-time stock lows there’s not a lot of options and homes are being snapped up,” says Vanessa.
North Island:
Coromandel registered a 9.2% decrease to 433 listings, Central North Island down 18.6% to 336 listings, Taranaki fell by 8.1% to 533 listings, Manawatu-Wanganui saw a 28.2% decrease to 649 total listings and the Wairapara dropped 7.6% to 204 listings.
South Island:
Marlborough registered a drop of 4.0 % to 245 listings, West Coast decreased to 16.1% to 482 listings, Otago fell by 17.9% to 430 listings and finally the Southland region fell by 23.6% with 403 listings.
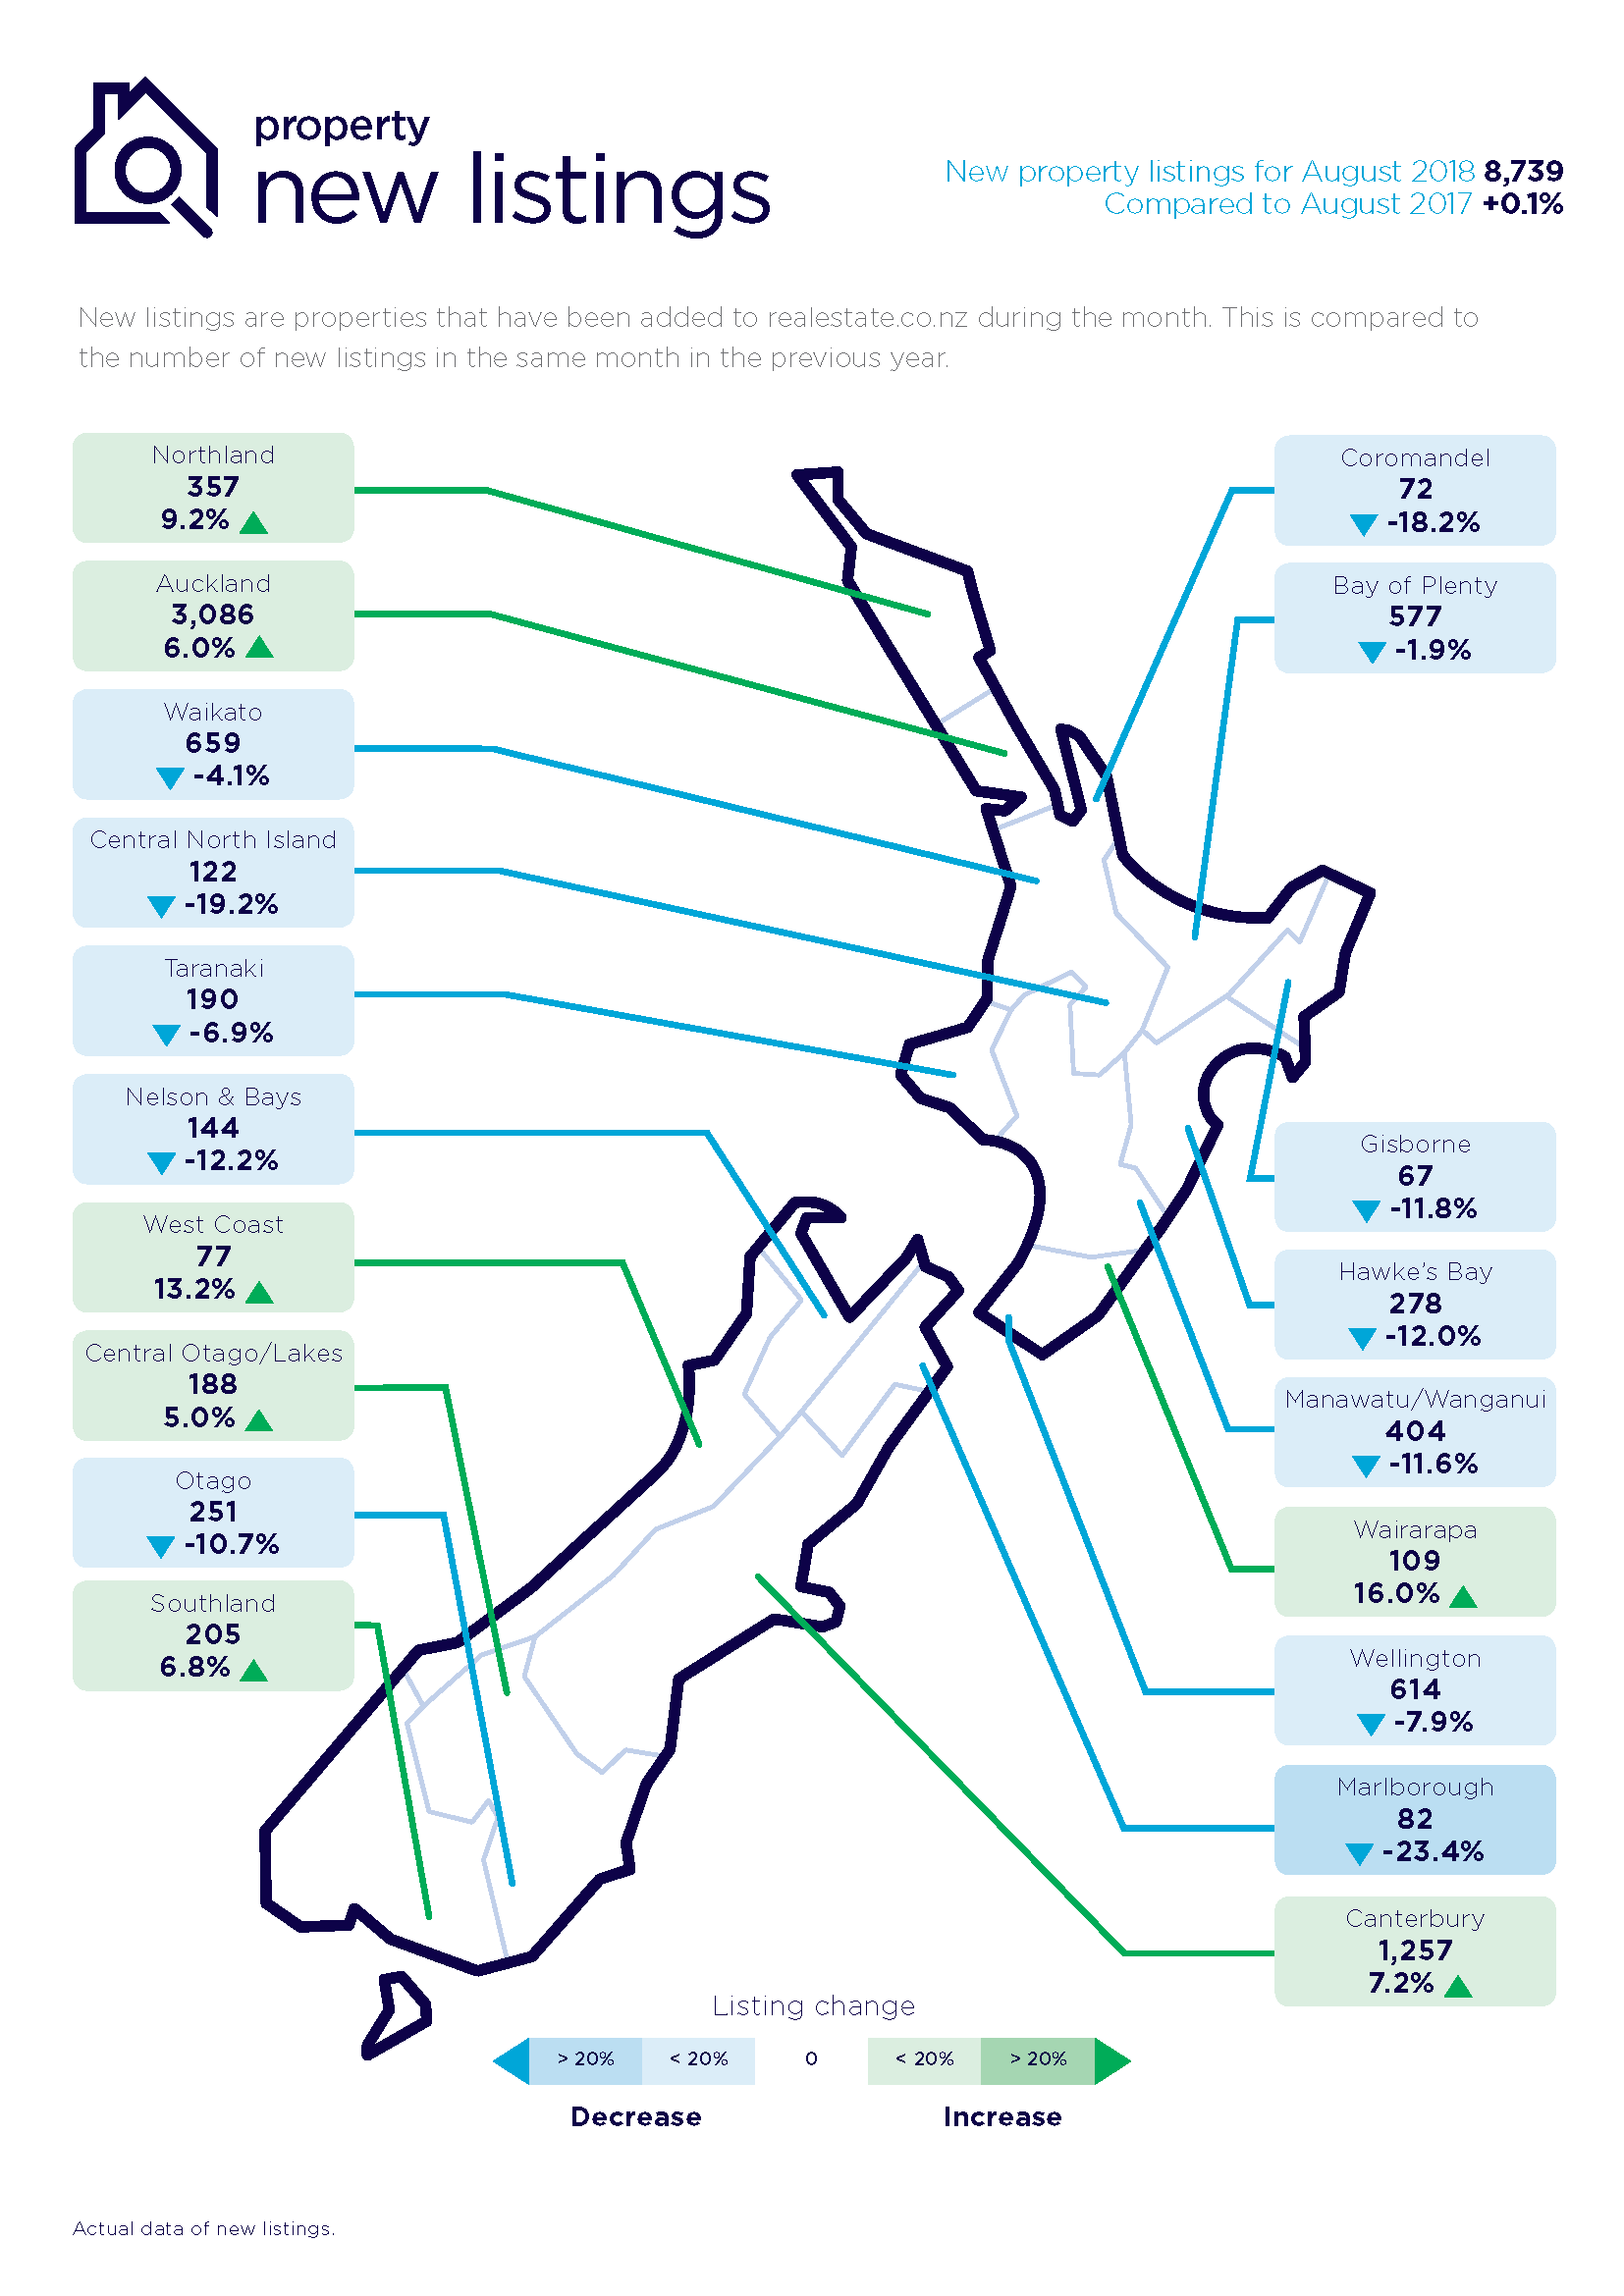
Auckland and Canterbury regions spring into life with new listings
“Spring appears to have come early for the Auckland and Canterbury regions,” says Vanessa Taylor.
“Canterbury has been an active market for some months, but it seems that the Auckland region has now sprung back to life with a surge of new listings,” says Vanessa.
Of the 8,739 new property listings across the country during August, almost half (4,343) were located in either the Auckland or Canterbury regions.
The Auckland region registered a 6.0% increase in new listings compared with August 2017.
“The 3,086 new listings in August are giving Auckland buyers more options,” says Vanessa.
Buyers in the Canterbury region have also got more options, with 1,257 new listings in August, representing a 7.2% increase on the same month last year.
“What we’re seeing is the surge in these regions compensating for the record lows in other regions,” says Vanessa.
Nationally, the number of new listings is static (an increase of 0.1% compared to August 2017).
* Average asking price is not a valuation. It is an indication of current market sentiment. This number is derived from the average price vendors across New Zealand and asking for their properties right now. Statistically, asking prices tend to correlate closely with the sales prices recorded in future months when those properties are sold. As it looks at different data, average asking prices may differ from recorded sales data released at the same time.
For media enquiries, please contact:
Liz Holt, PPR T: 021 042 6590 E: liz.holt@ppr.co.nz
Glossary of terms:
As the only provider of real estate data in real time, realestate.co.nz offers valuable property market information not available from other sources.
• Average asking price gives an indication of current market sentiment. Statistically, asking prices tend to correlate closely with the sales prices recorded in future months when those properties are sold. As it looks at different data, average asking prices may differ from recorded sales data released at the same time.
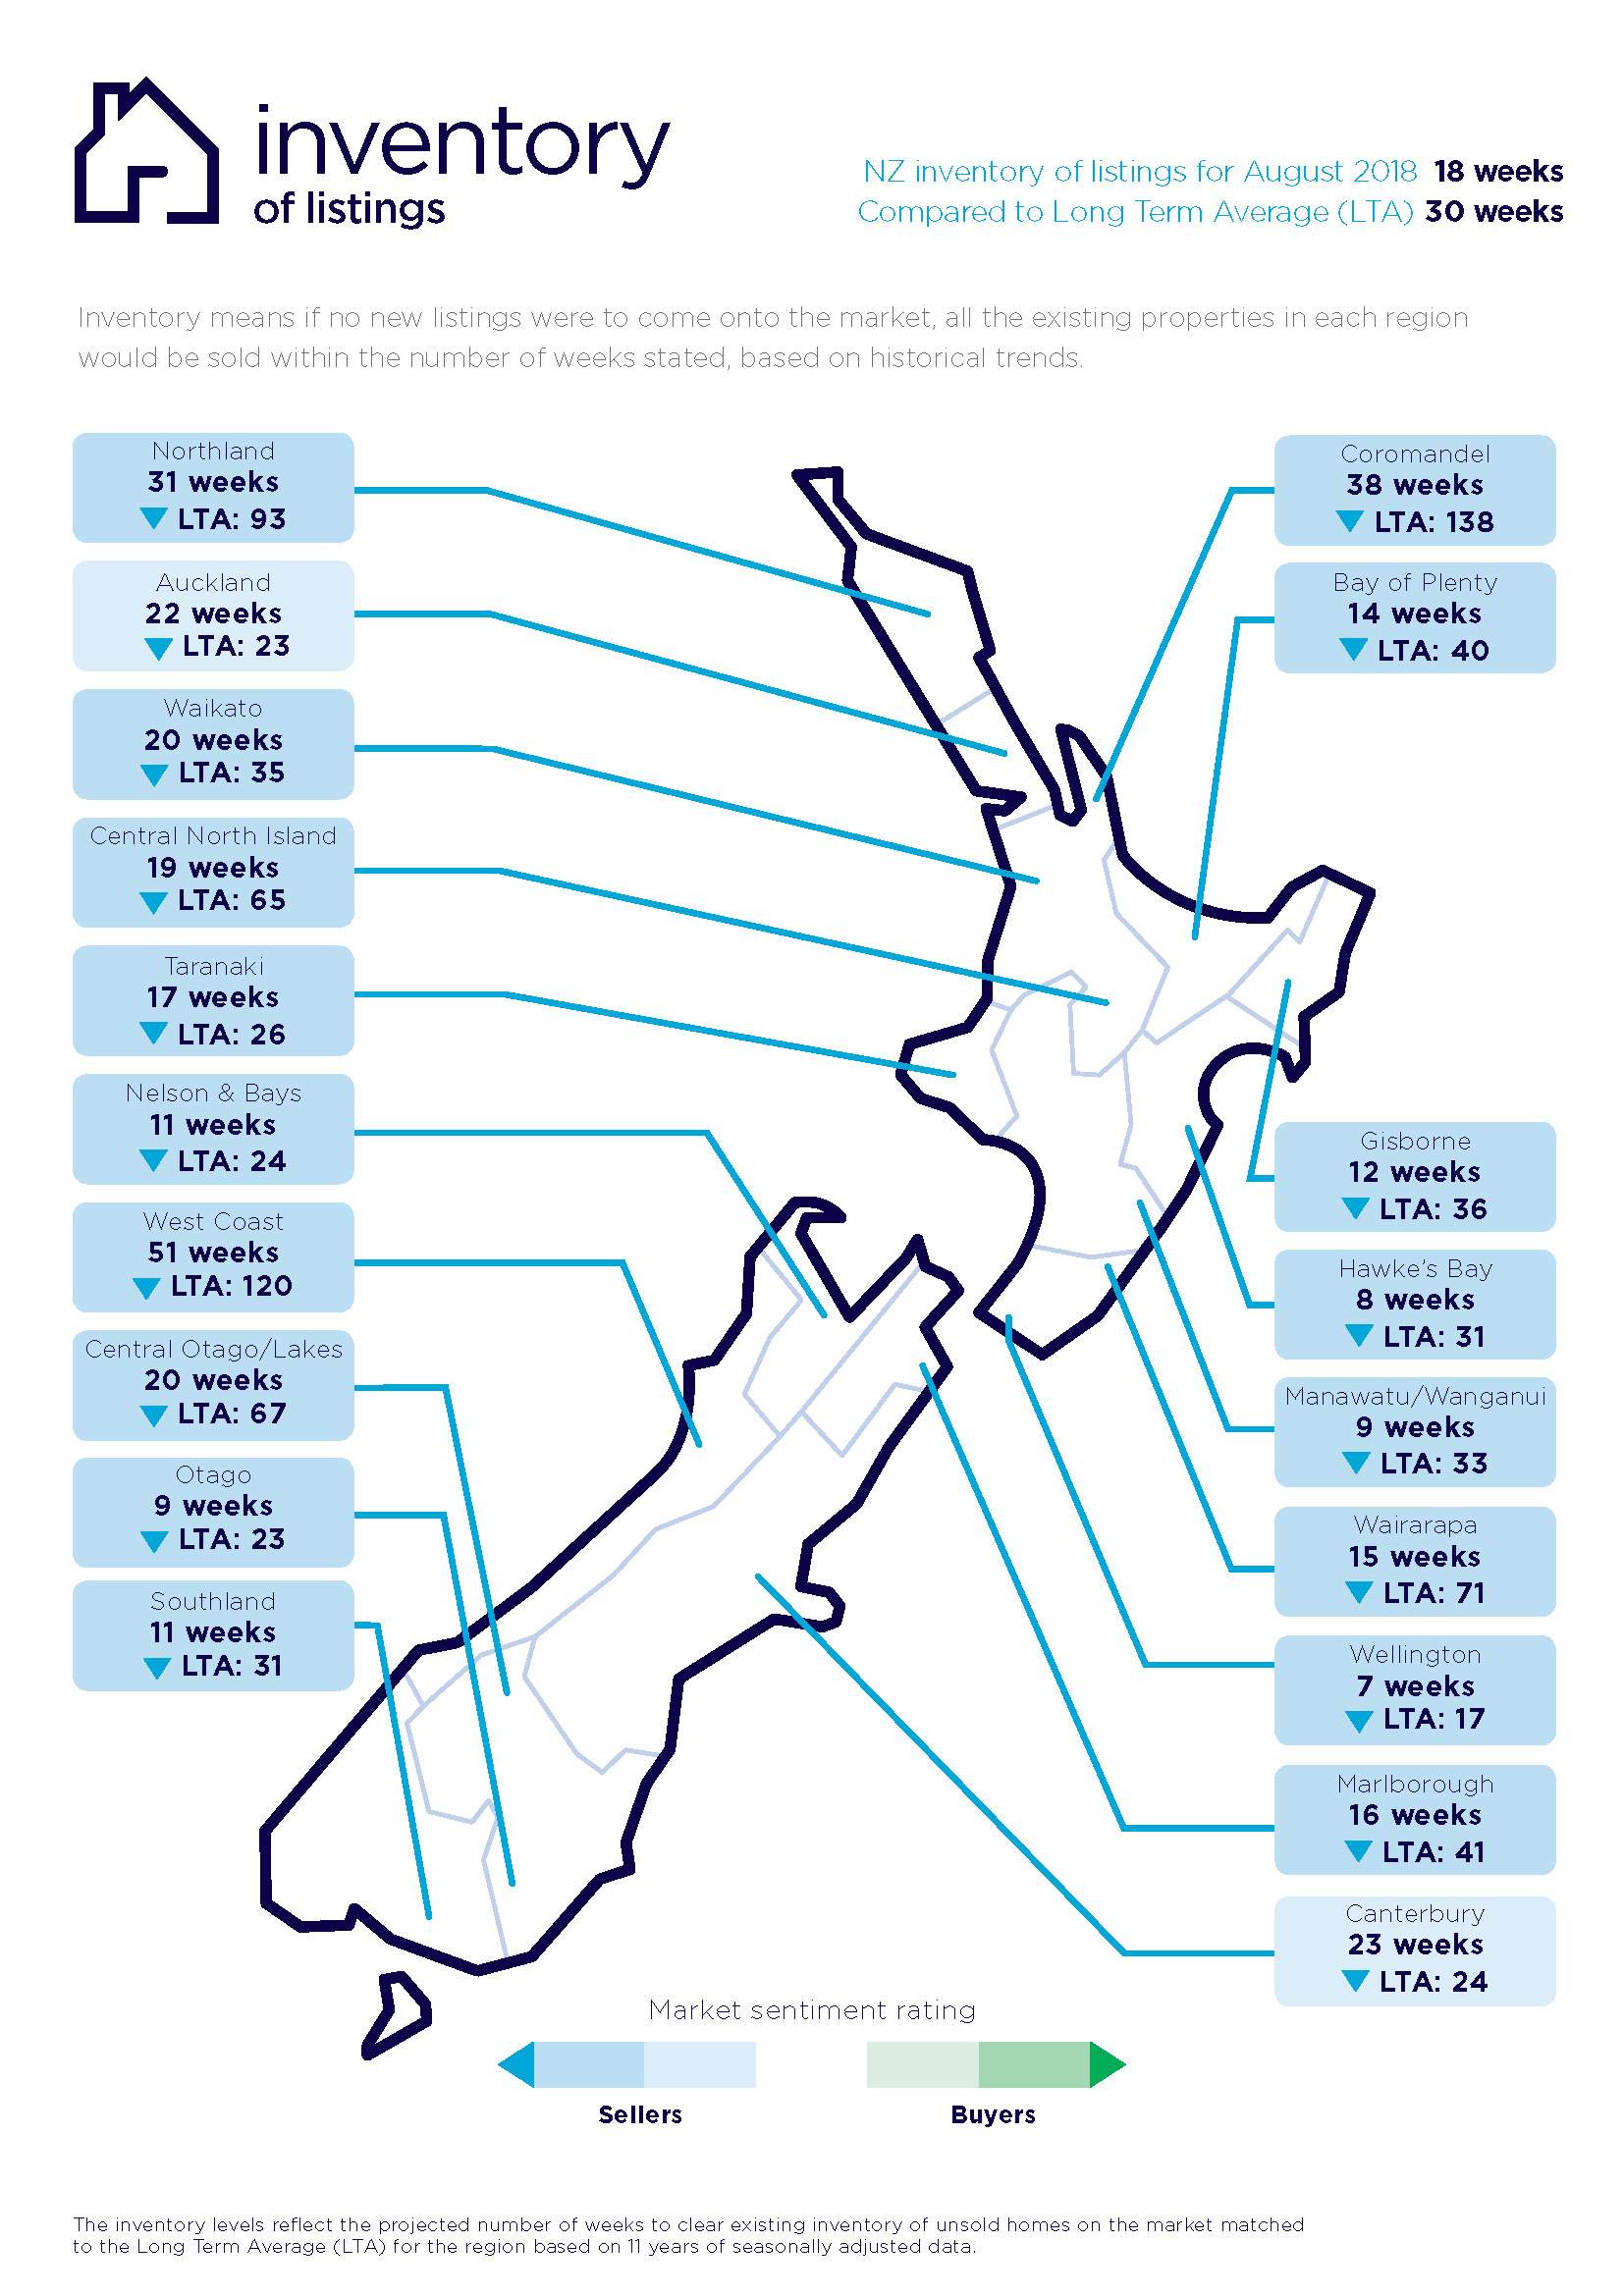
• Inventory is a measure of how long it would take, theoretically, to sell the current stock at current average rates of sale if no new properties were to be listed for sale. It provides a measure of the rate of turnover in the market.
• New listings are a record of all the new listings on realestate.co.nz for the relevant calendar month. As realestate.co.nz reflects 97% of all properties listed through registeredestate agents in New Zealand, this gives a representative view of the New Zealand property market.
• Seasonal adjustment is a method realestate.co.nz uses to better represent the core underlying trend of the property market in New Zealand. This is done using methodology from the New Zealand Institute of Economic Research.
• Truncated mean is the method realestate.co.nz uses to provide statistically relevant asking prices. The top and bottom 10 % of listings in each area are removed before the average is calculated, to prevent exceptional listings from providing false impressions.
Share
-
.svg)
.svg)
.svg)