
.svg)


August saw the lowest stock nationally since records began 13-years ago while asking prices continued to climb.
Real-time data from realestate.co.nz shows that regional New Zealand is driving record house prices with Northland, Bay of Plenty, Taranaki, and Central North Island reaching all-time highs in August.
Following last month’s trend, new property listings were up around the country when compared to the same time last year despite record total stock lows nationally and in nine regions.
Vanessa Taylor, spokesperson for realestate.co.nz, says that several factors will be driving an increase in asking prices.
“I suspect that low-interest rates and the removal of LVR restrictions earlier this year are enabling more people to enter the property market. Plus, many Kiwis are still returning home because of COVID-19 so I don’t think there is a shortage of buyers in New Zealand right now.”
“As we have seen in the cramped rental market, everyone needs somewhere to live. Given our country’s long-term housing shortage, I expect demand will remain high with both owner-occupiers and investors looking to achieve their property goals,” says Vanessa.
In August around 1,300,000 users hit the site which is a 21.0% increase on August last year. Our typical peak summertime month of February saw slightly over 1,200,000 so August demand has certainly outshone the pinnacle property months during 2020.
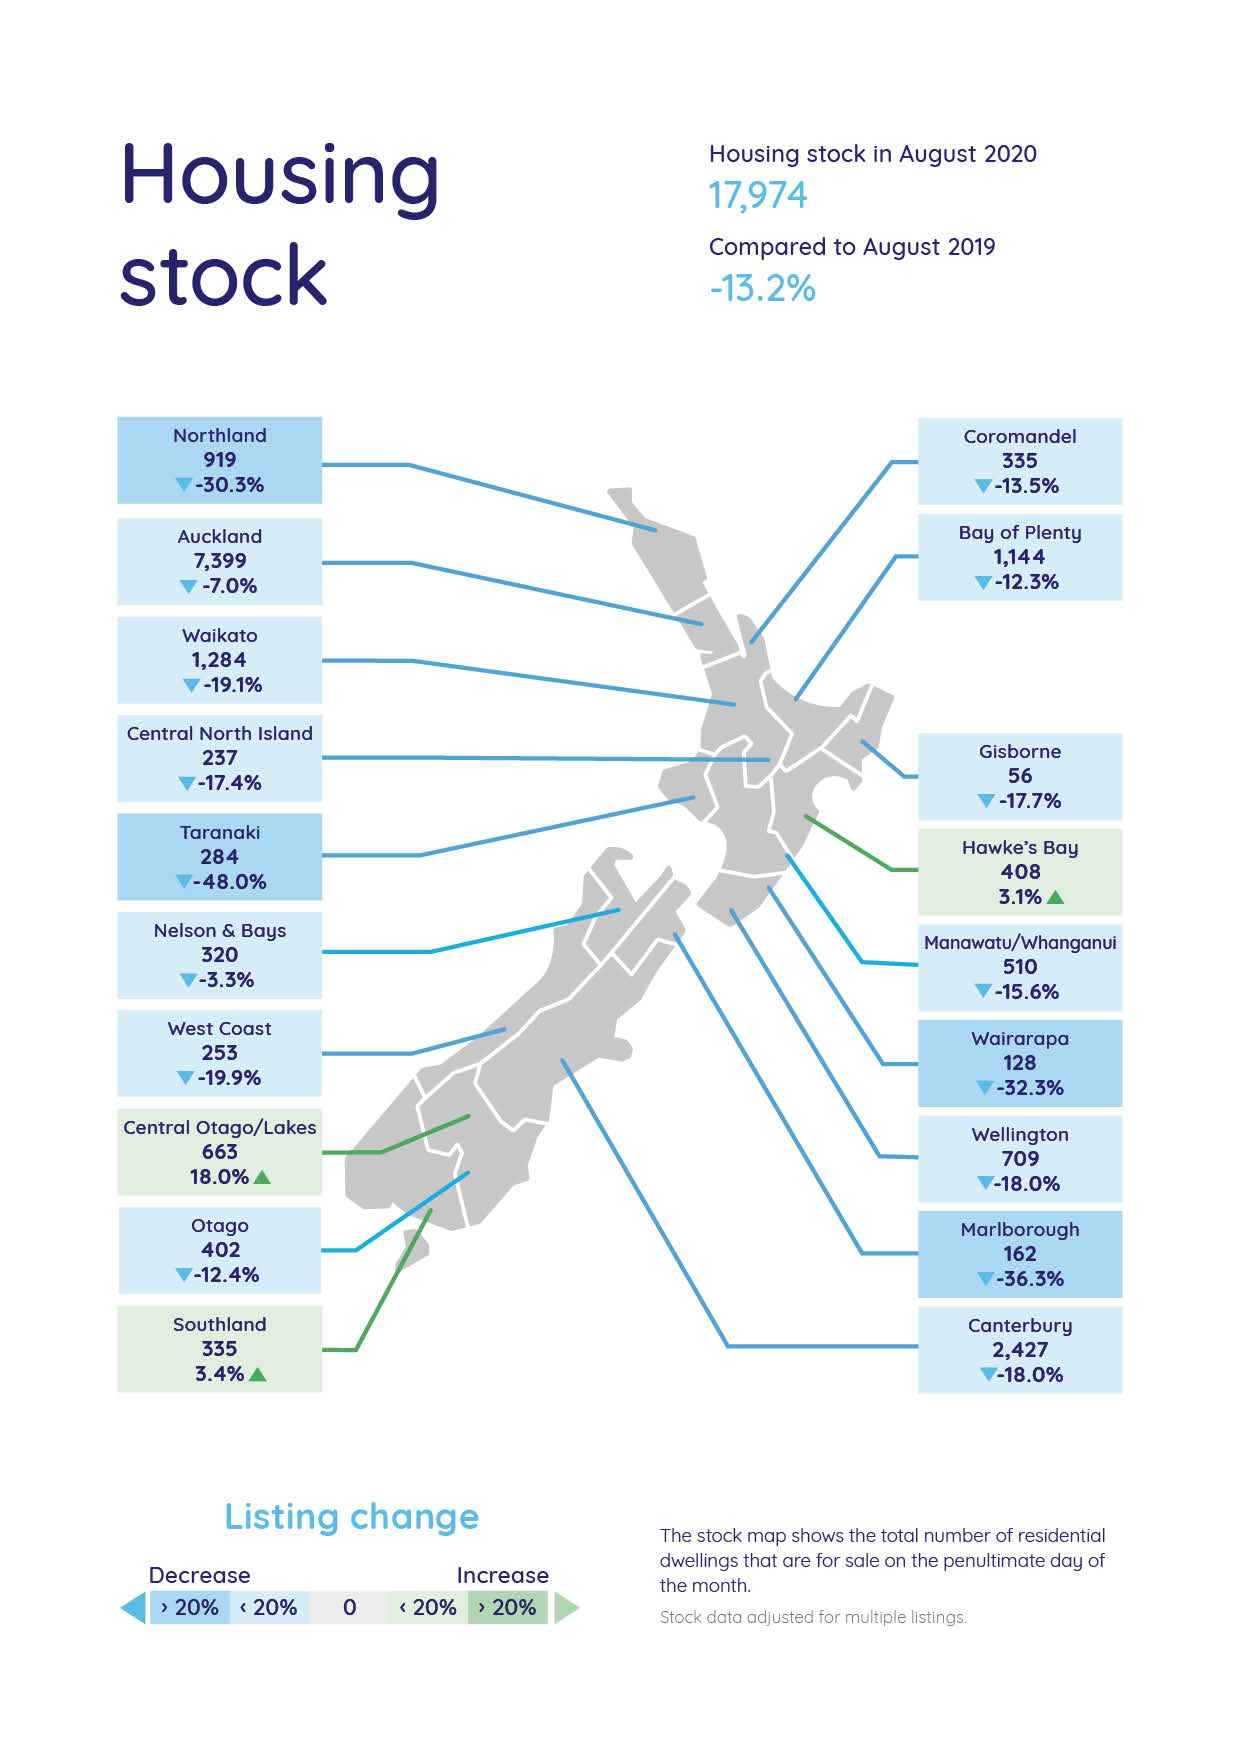
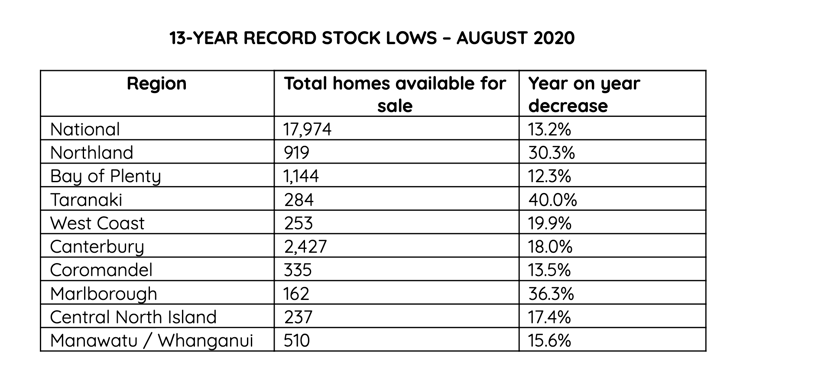
Record low stock nationally and in nine regions
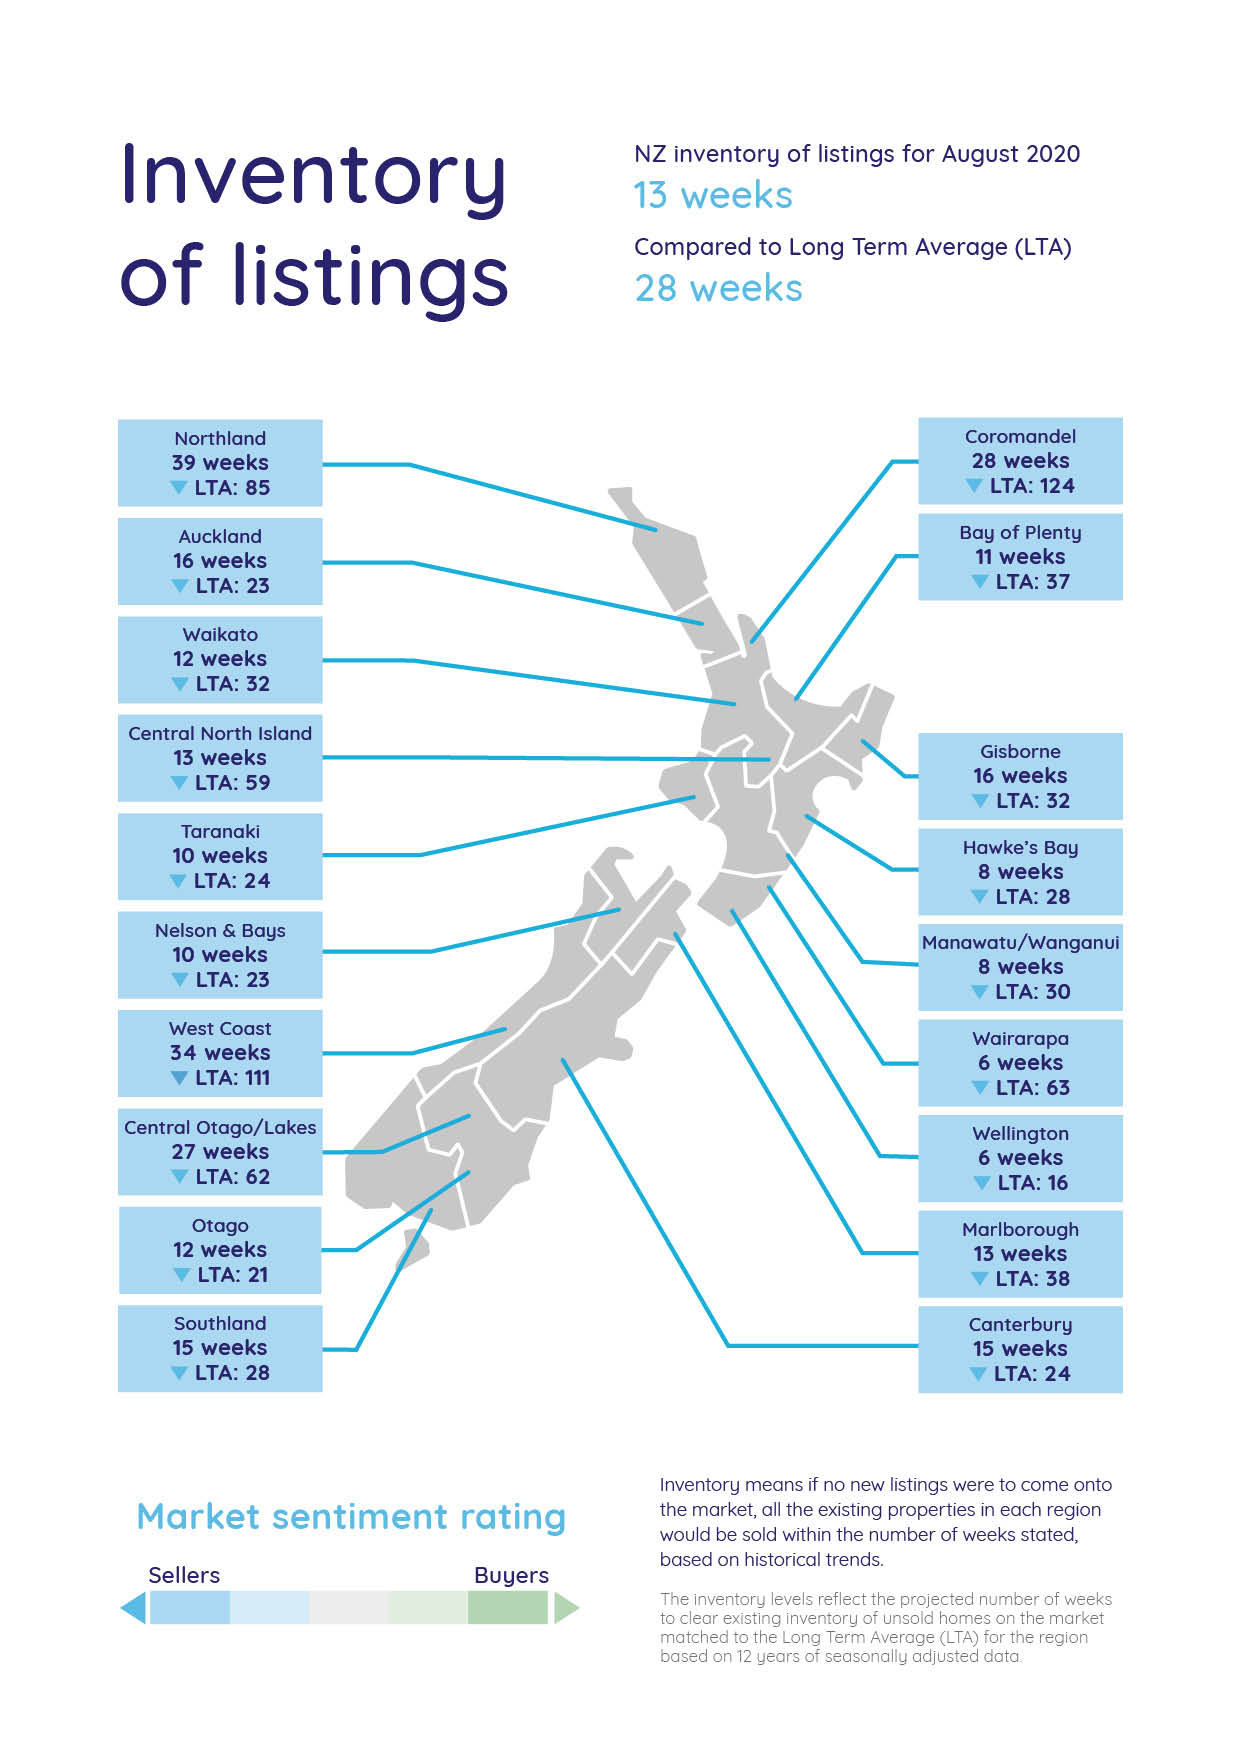
New Zealand’s housing shortage did not let up in August with nine of 19 regions hitting 13-year record total stock lows. Nationally, the total homes available for sale was down 13.2% on August 2019 to just 17,974 listings – a drop of 7.6% compared to the previous month.
The biggest stock decrease was in Taranaki, where just 284 homes were available for buyers - down 47.9% on August 2019. The number of listings in Taranaki has been trending downward since the beginning of 2019 when we were seeing close to 700 listings on the market. Unsurprisingly, as supply has dwindled, the average asking price in the region has increased.
“Our national housing shortage is not getting better and with all-time stock lows in nearly half of our regions, buyers across the country had less choice than ever last month,” says Vanessa.
Earlier this year, New Zealand’s population passed 5 million according to Statistics New Zealand. Vanessa says that our fast-growing population coupled with an increase in New Zealanders returning home is likely increasing demand for property.
“With many Kiwis unable or reluctant to relocate overseas right now, this too is likely putting a strain on the market,” says Vanessa.
The only regions to see year on year increases in total homes available for sale were Hawke’s Bay (up 3.1% to 408), Central Otago/Lakes (up 18.0% to 663) and Southland (up 3.2% to 335).
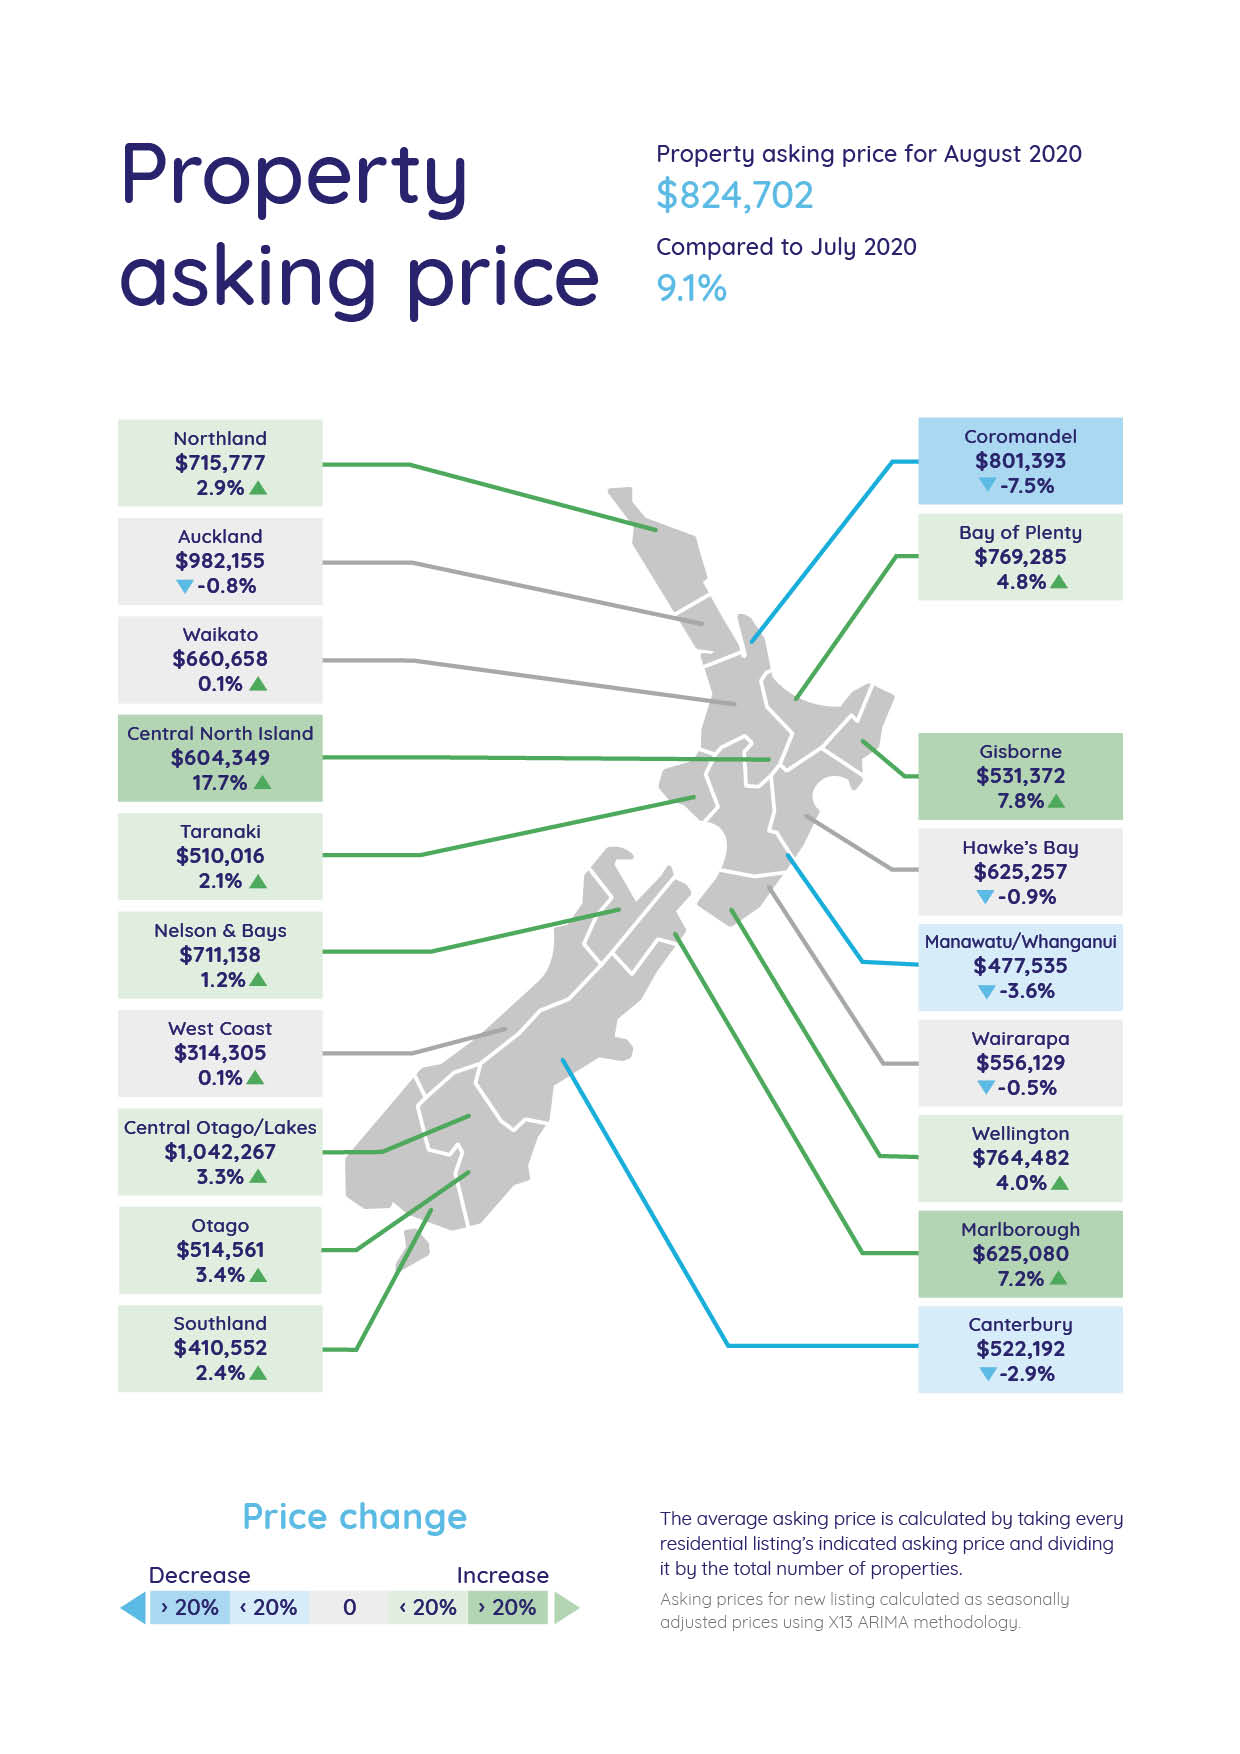
Average asking price up nationally to $824,702 – driven by all-time highs in regional New Zealand
The average asking price nationally was up 21.7% compared to the same time last year and up 9.1% on the previous month.
Omitting the data from the lockdown in April, where prices were skewed upwards because of Kiwis being unable to list their properties, the true national average asking price also tipped over $800,000 for the first time in August 2020.
Vanessa says that, with less than 3,000 new listings coming onto the market in April 2020 compared to almost 9,000 in August 2020, prices in April were inflated by a lack of supply. Removing April’s anomaly prices from the data gives us a better indication of what is happening in the market.
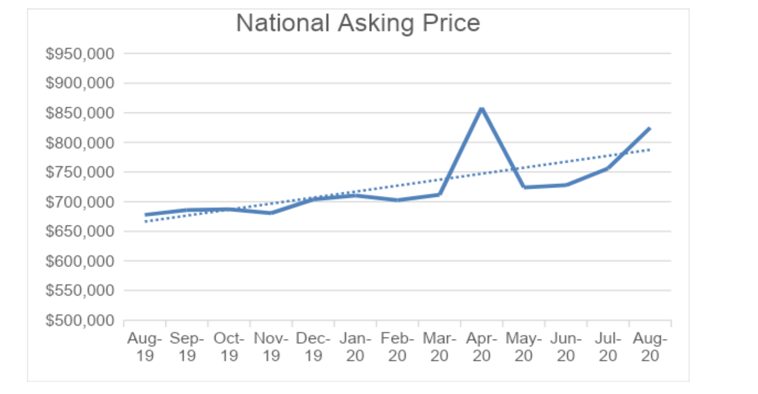
“Up until April’s spike, the national average asking price has been sitting in the low to mid $700,000s throughout 2020 so it is significant to see an almost $70,000 increase in August 2020 compared to July 2020,” says Vanessa.
This jump is most likely driven by regional New Zealand, with Northland, Bay of Plenty, Taranaki, and Central North Island reaching all-time highs since records began in 2007, says Vanessa.
No winter slump for new listings this year
Typically, we see new listings coming onto the market decrease during winter as vendors wait until the spring/summer months to sell, says Vanessa.
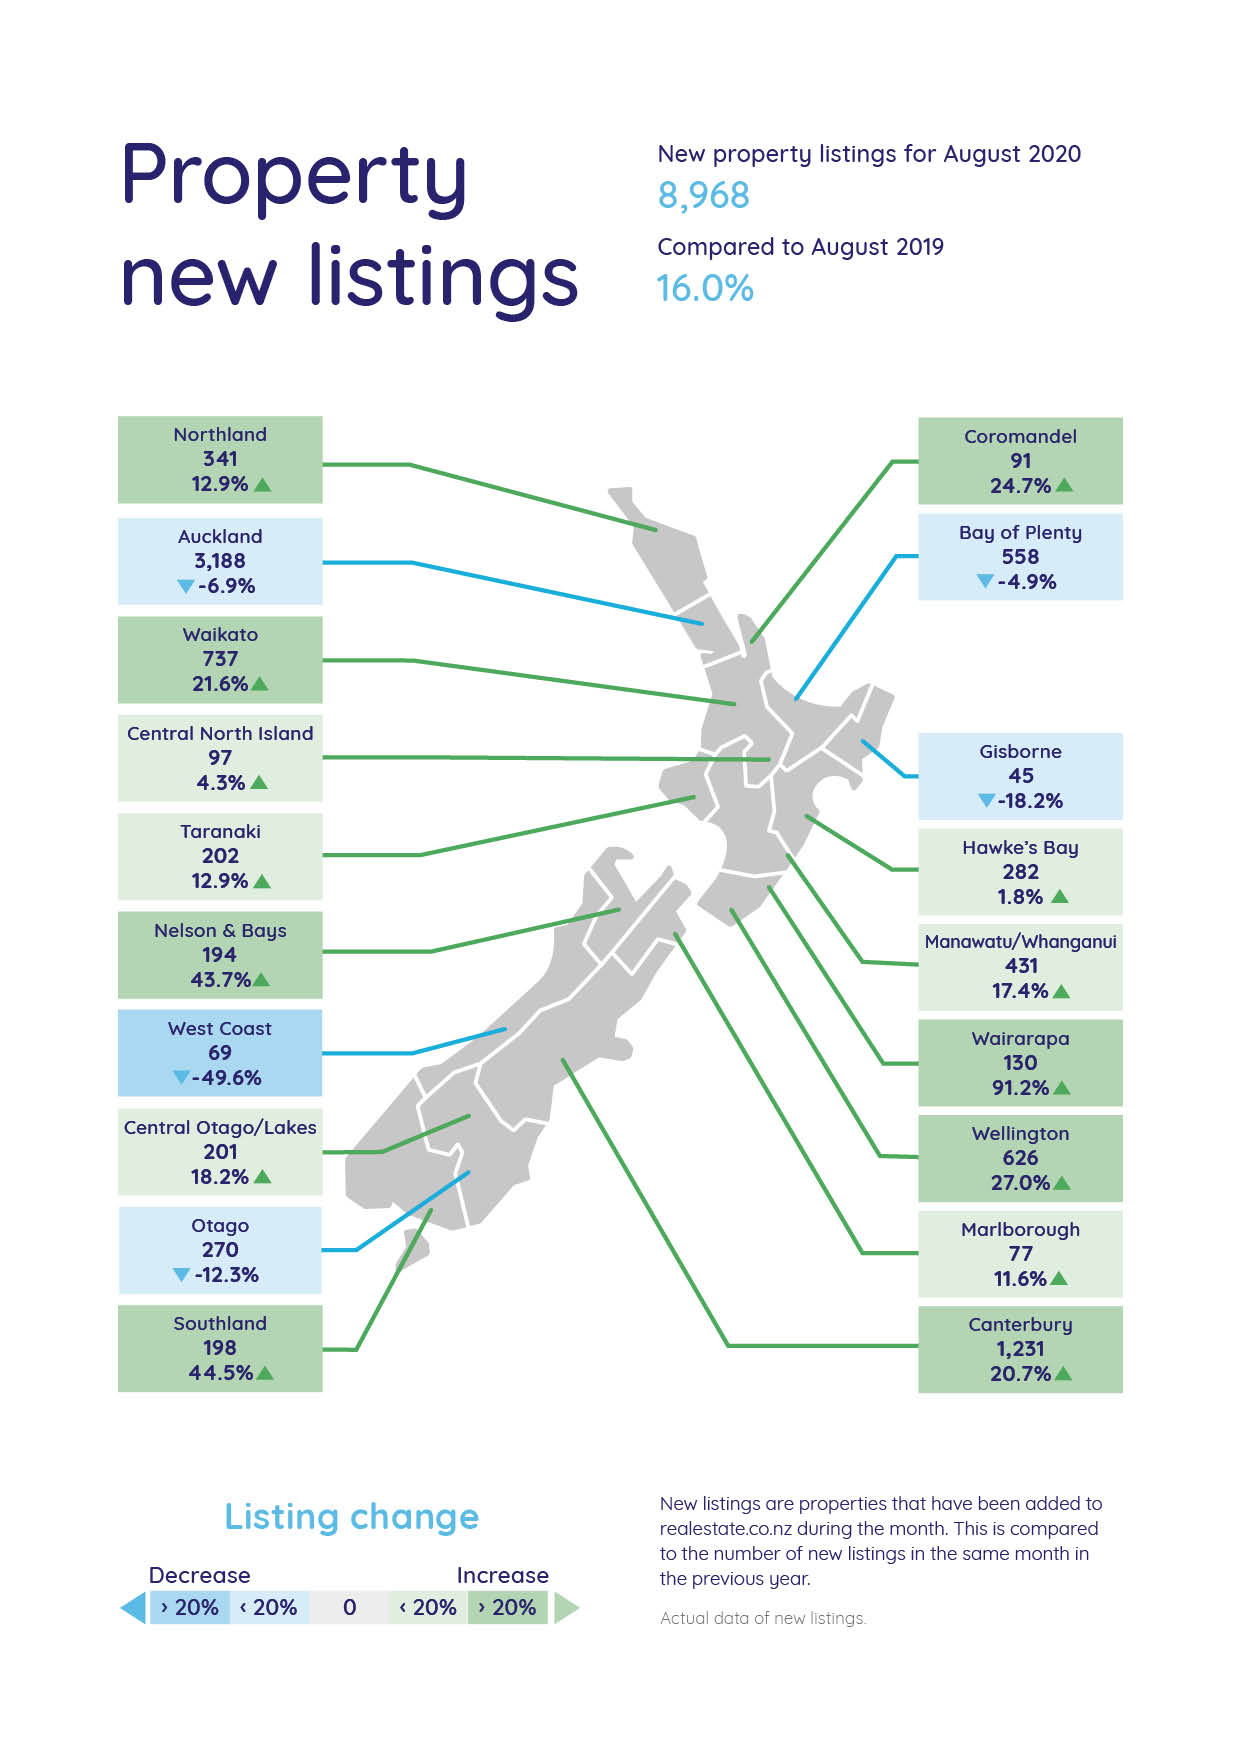
However, real-time data from realestate.co.nz shows that this has not been the case in 2020. Nationally, new listings coming onto the market in August were up 16.0% on the same time last year – a trend reflected in all but four of 19 regions last month.
Vanessa says “It could be that the lockdown in April, when vendors were unable to list their homes, has caused a backlog of properties around the country. But it might also be the result of people’s changing circumstances.”
“COVID-19 has changed the way a lot of people work. I wouldn’t be surprised if Kiwis want more from their homes and if where they want to live is changing as remote working becomes more widespread,” says Vanessa.
The biggest year on year increases to new listings coming onto the market were in Wairarapa (91.2% to 130), Southland (44.5% to 198), and Nelson and Bays (43.7% to 194).
“These three regions have been particularly tight on new listings during much of 2019 and 2020, so it is good to see vendors coming to market in these areas,’ says Vanessa.
Central North Island average asking price tips $600,000 for the first time since records began 13-years ago
Increasing almost $100,000 since last month, the average asking price in the Central North Island reached $604,349 in August – a 17.8% increase on July’s average asking price of $513,257 and a 20.2% increase on the same time last year.
Following the national stock trend, the total homes available for sale in the region were also at an all-time low for the second consecutive month in August, with just 237 total listings in the region. This is a 17.4% year-on-year decrease and a 16.0% drop on July this year.
“When supply decreases, we tend to see prices increase and I suspect that, despite a 4.3% year on year increase in new listings in the region, this is the case in Central North Island.”
Real-time data from realestate.co.nz shows that Taumaranui, Ohakune, Turangi, Kinloch, and Taupo were the most searched in the region during August.
For media enquiries, please contact:
Trish Fitzsimons | 021 022 96927 | trish@realestate.co.nz
About realestate.co.nz
Established before Google, in 1996, realestate.co.nz is New Zealand’s longest-standing property site. With residential, lifestyle, rural and commercial property listings available, realestate.co.nz is the place where serious buyers look for property. Dedicated to property, realestate.co.nz has no private sales and has search functionality that’s second to none to get you to your perfect property faster.
Glossary of terms: As the only provider of real estate data in real-time, realestate.co.nz offers valuable property market information not available from other sources.
- Average asking price is not a valuation. It is an indication of current market sentiment. Statistically, asking prices tend to correlate closely with the sales prices recorded in future months when those properties are sold. As it looks at different data, average asking prices may differ from recorded sales data released at the same time.
- Inventory is a measure of how long it would take, theoretically, to sell the current stock at current average rates of sale if no new properties were to be listed for sale. It provides a measure of the rate of turnover in the market.
- New listings are a record of all the new listings on realestate.co.nz for the relevant calendar month. As realestate.co.nz reflects 97% of all properties listed through registered estate agents in New Zealand, this gives a representative view of the New Zealand property market.
- Demand: the increase or decrease in the number of views per listing in that region, taken over a rolling three-month time frame, compared to the same three-month time frame the previous year – including the current month.
- Seasonal adjustment is a method realestate.co.nz uses to better represent the core underlying trend of the property market in New Zealand. This is done using methodology from the New Zealand Institute of Economic Research.
- Truncated mean is the method realestate.co.nz uses to provide statistically relevant asking prices. The top and bottom 10% of listings in each area are removed before the average is calculated, to prevent exceptional listings from providing false impressions.
Share
-
.svg)
.svg)
.svg)