
.svg)


Asking prices up 16.9% nationally; 14-year record highs in 14 regions
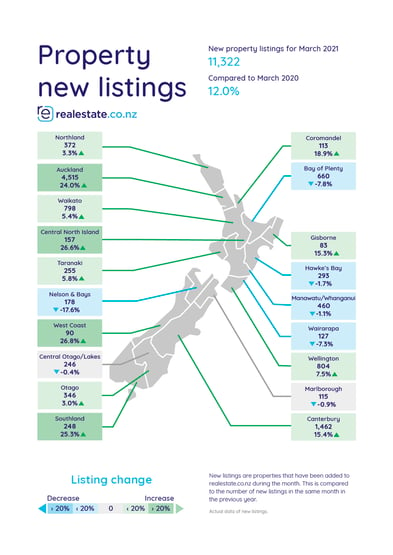
Lift in new listings welcome news for buyers
Property prices showed no signs of slowing down during March, according to latest figures from realestate.co.nz.
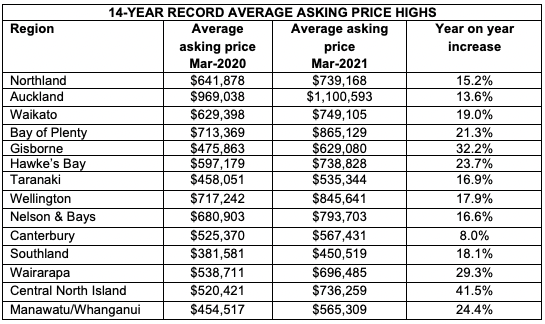
Real-time data shows that average asking prices were up 16.9% year-on-year in March, with 14 of 19 regions hitting record asking price highs.
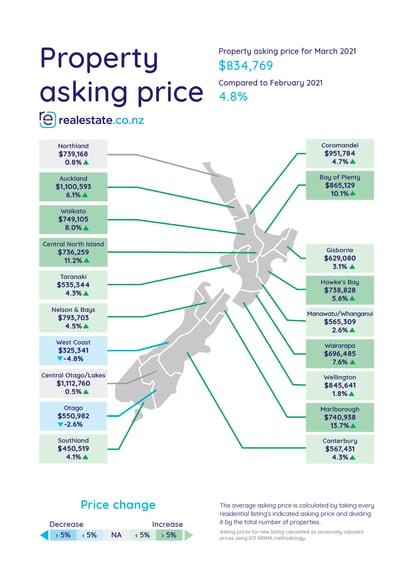
The national average asking price for Kiwi properties last month was $834,769 – costing on average $120,449 more than the same time last year.
However, there is good news for buyers in some parts of New Zealand.
“12 of our 19 regions saw a lift in new listings last month compared to March 2020,” says Sarah Wood, CEO of realestate.co.nz.
“Although we still have a stock shortage around the country, it was encouraging to see pockets of increased vendor activity during March.”
Record high asking prices in 14 of 19 regions
Average asking prices were up year-on-year in every region across the country last month, with all but five regions reaching all-time asking price highs.
“We’ve rarely seen this many record highs in one month,” says Sarah.
“Only time will tell what impact the Government’s recent housing announcement will have, but these figures highlight the need for measures to help cool the market.”
Northland, Auckland, Waikato, Bay of Plenty, Gisborne, Hawke’s Bay, Taranaki, Wellington, Nelson & Bays, Canterbury, Southland, Wairarapa, Central North Island and Manawatu/Whanganui all reached peak asking prices since records began 14 years ago.
The biggest increase was seen in Central North Island, where the average asking price climbed to $736,259 – up 41.5% from $520,421 in March 2020.
“Although this might be welcome news for sellers, Central North Island is a small region and when we see a number of large, high-value lifestyle properties coming onto the market that can push the average asking price up,” cautions Sarah.
While Marlborough didn’t achieve a record high in March, the region showed the next largest growth with prices up 37.6% year-on-year. This was followed by Gisborne, where average asking prices were up 32.2%, and Wairarapa, which showed a 29.3% year-on-year increase.
In Auckland, the average asking price tipped over $1.1 million for the first time, despite a 24.0% increase in new listings. A property in the super-city now costs on average $1,100,593.
Vendors active around the country – but will buyers get any relief?
Data from realestate.co.nz shows that vendors were busy putting their homes on the market last month, with 11,322 properties listed for sale during March.
Nationally, new listings were up 12.0% on the same time last year; 12 of 19 regions saw a lift in new listings compared to March 2020.
The most significant year-on-year increases were seen in West Coast, Central North Island and Southland, where new listings were up 26.8%, 26.6% and 25.3% respectively.
“This will be welcome news for buyers, who have been faced with little choice over recent months,” says Sarah.
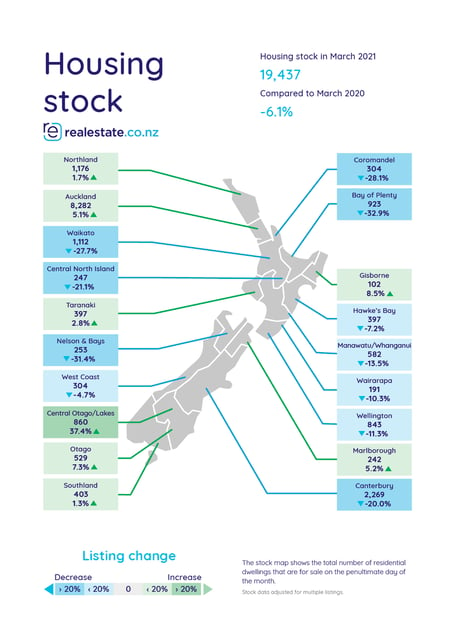
Eight regions saw year-on-year increases in total stock: Northland, Auckland, Gisborne, Taranaki, Otago, Southland, Central Otago/Lakes and Marlborough.
“Over the last year we’ve repeatedly been seeing total stock lows across the country. So, although our national inventory of properties is still down 6.1% compared to March 2020, it’s promising to see stock starting to level out in parts of New Zealand,” says Sarah.
Prices in Taranaki reach 14-year high; lift in listings silver lining for buyers
Mirroring national trends, average asking prices in Taranaki have increased 16.9% over the last year. Reaching an all-time high in March, the average price tag for a home in the region is now $535,344.
“Home buyers in Taranaki can expect to pay on average $77,293 more for a home than they did at the same time last year,” says Sarah.
But there is some positive news for those in the market to buy: 255 new listings came onto the market in March, a 15.9% increase on February and up 5.8% compared to the same time last year.
“Buyers in Taranaki had a lot more choice last month, with the highest inventory we’ve seen since June last year,” Sarah notes.
“Total stock was up 41.3% on February; that’s welcome news for buyers, who will be hoping that more listings will ease price pressures.”
During the month more than 27,500 users searched for property in the Taranaki region on realestate.co.nz – with Hawera, Waitara and Opunake the most sought-after locations.
ENDS
For media enquiries, please contact:
Trish Fitzsimons | 021 022 96927 | trish@realestate.co.nz
About realestate.co.nz
Established before Google, in 1996, realestate.co.nz is New Zealand’s longest-standing property site. With residential, lifestyle, rural and commercial property listings available, realestate.co.nz is the place where serious buyers look for property. Dedicated to property, realestate.co.nz has no private sales and has search functionality that’s second to none to get you to your perfect property faster.
Glossary of terms:
As the only provider of real estate data in real-time, realestate.co.nz offers valuable property market information not available from other sources.
- • Average asking price is not a valuation. It is an indication of current market sentiment. Statistically, asking prices tend to correlate closely with the sales prices recorded in future months when those properties are sold. As it looks at different data, average asking prices may differ from recorded sales data released at the same time.
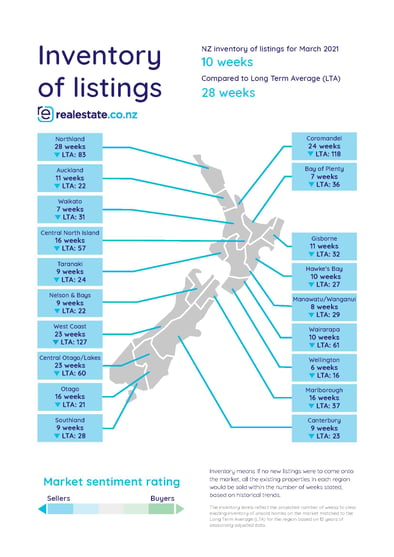
- • Inventory is a measure of how long it would take, theoretically, to sell the current stock at current average rates of sale if no new properties were to be listed for sale. It provides a measure of the rate of turnover in the market.
- • New listings are a record of all the new listings on realestate.co.nz for the relevant calendar month. As realestate.co.nz reflects 97% of all properties listed through registered estate agents in New Zealand, this gives a representative view of the New Zealand property market.
- • Demand: the increase or decrease in the number of views per listing in that region, taken over a rolling three-month time frame, compared to the same three-month time frame the previous year – including the current month.
- • Seasonal adjustment is a method realestate.co.nz uses to better represent the core underlying trend of the property market in New Zealand. This is done using methodology from the New Zealand Institute of Economic Research.
- • Truncated mean is the method realestate.co.nz uses to provide statistically relevant asking prices. The top and bottom 10% of listings in each area are removed before the average is calculated, to prevent exceptional listings from providing false impressions.
Share
-
.svg)
.svg)
.svg)