
.svg)


Download the full New Zealand Property Report as a PDF.
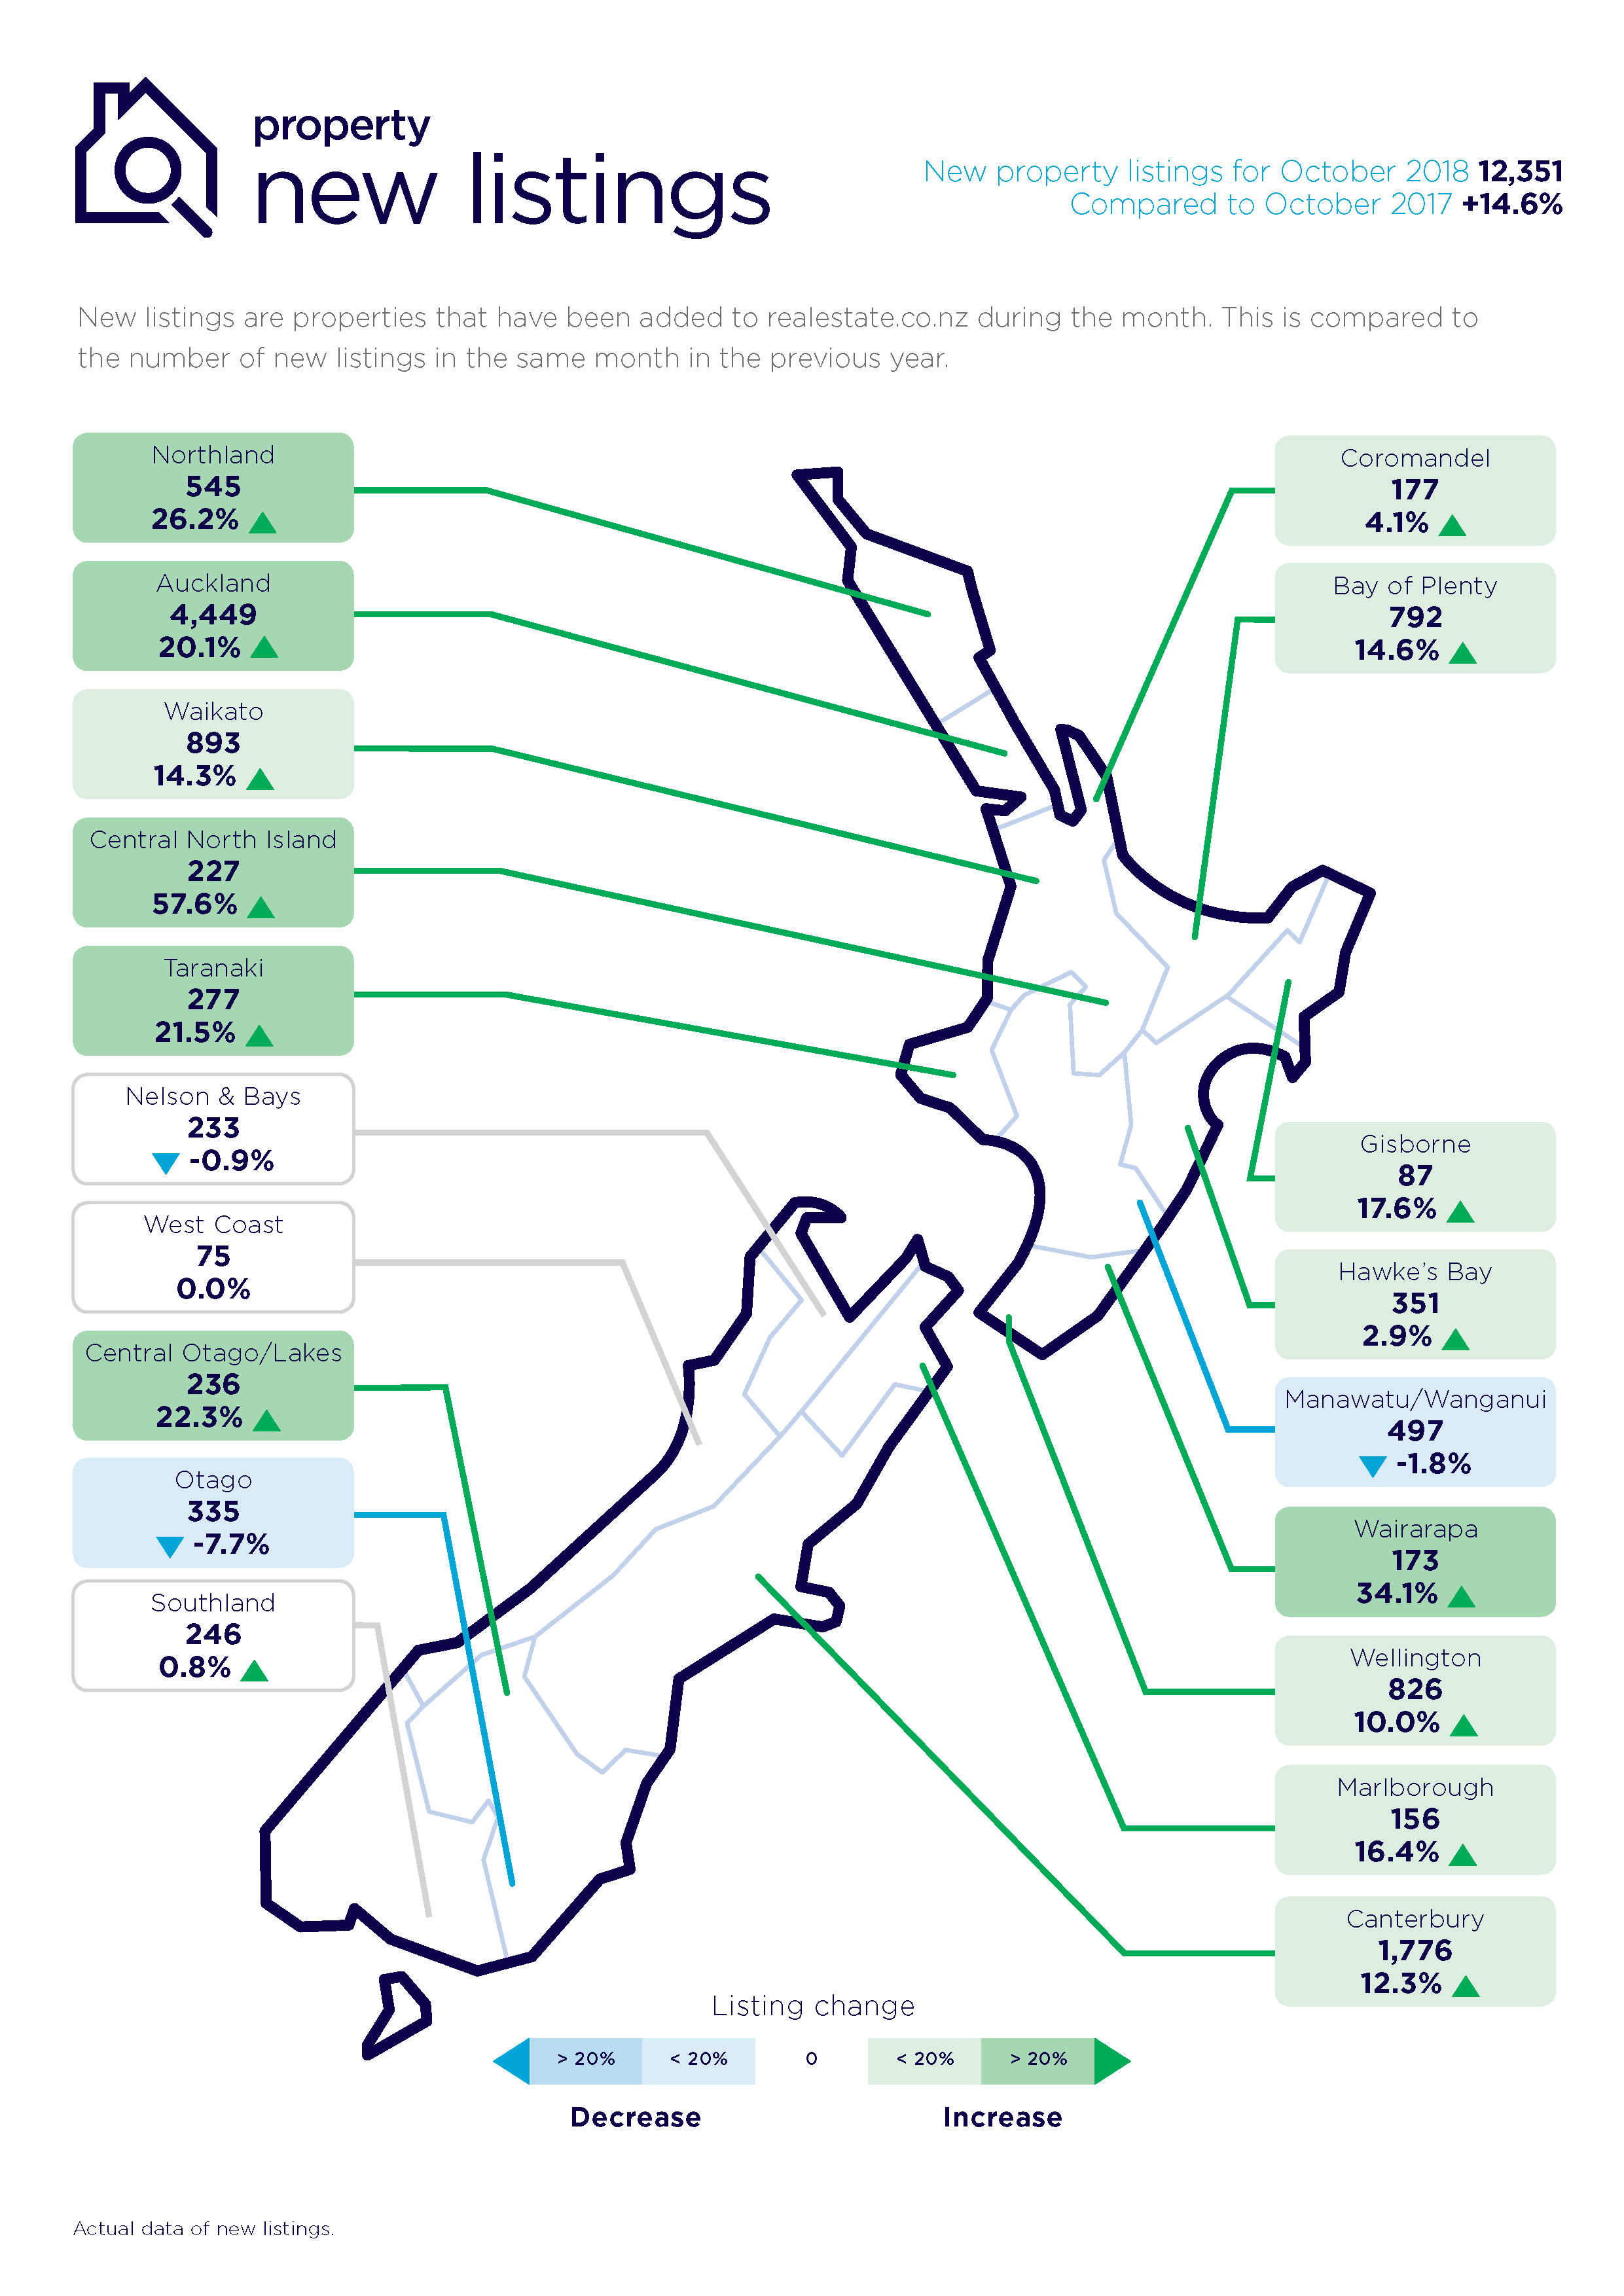
The Auckland region favours buyers for the first time since 2011. New listings are up 14.6% across New Zealand and the national average asking price falls by 2.1%, driven by major centres.
Real-time statistics from realestate.co.nz show that our biggest region, Auckland, is looking fresh and healthy for buyers, with a large injection of new listings (up 20.1% on last year).
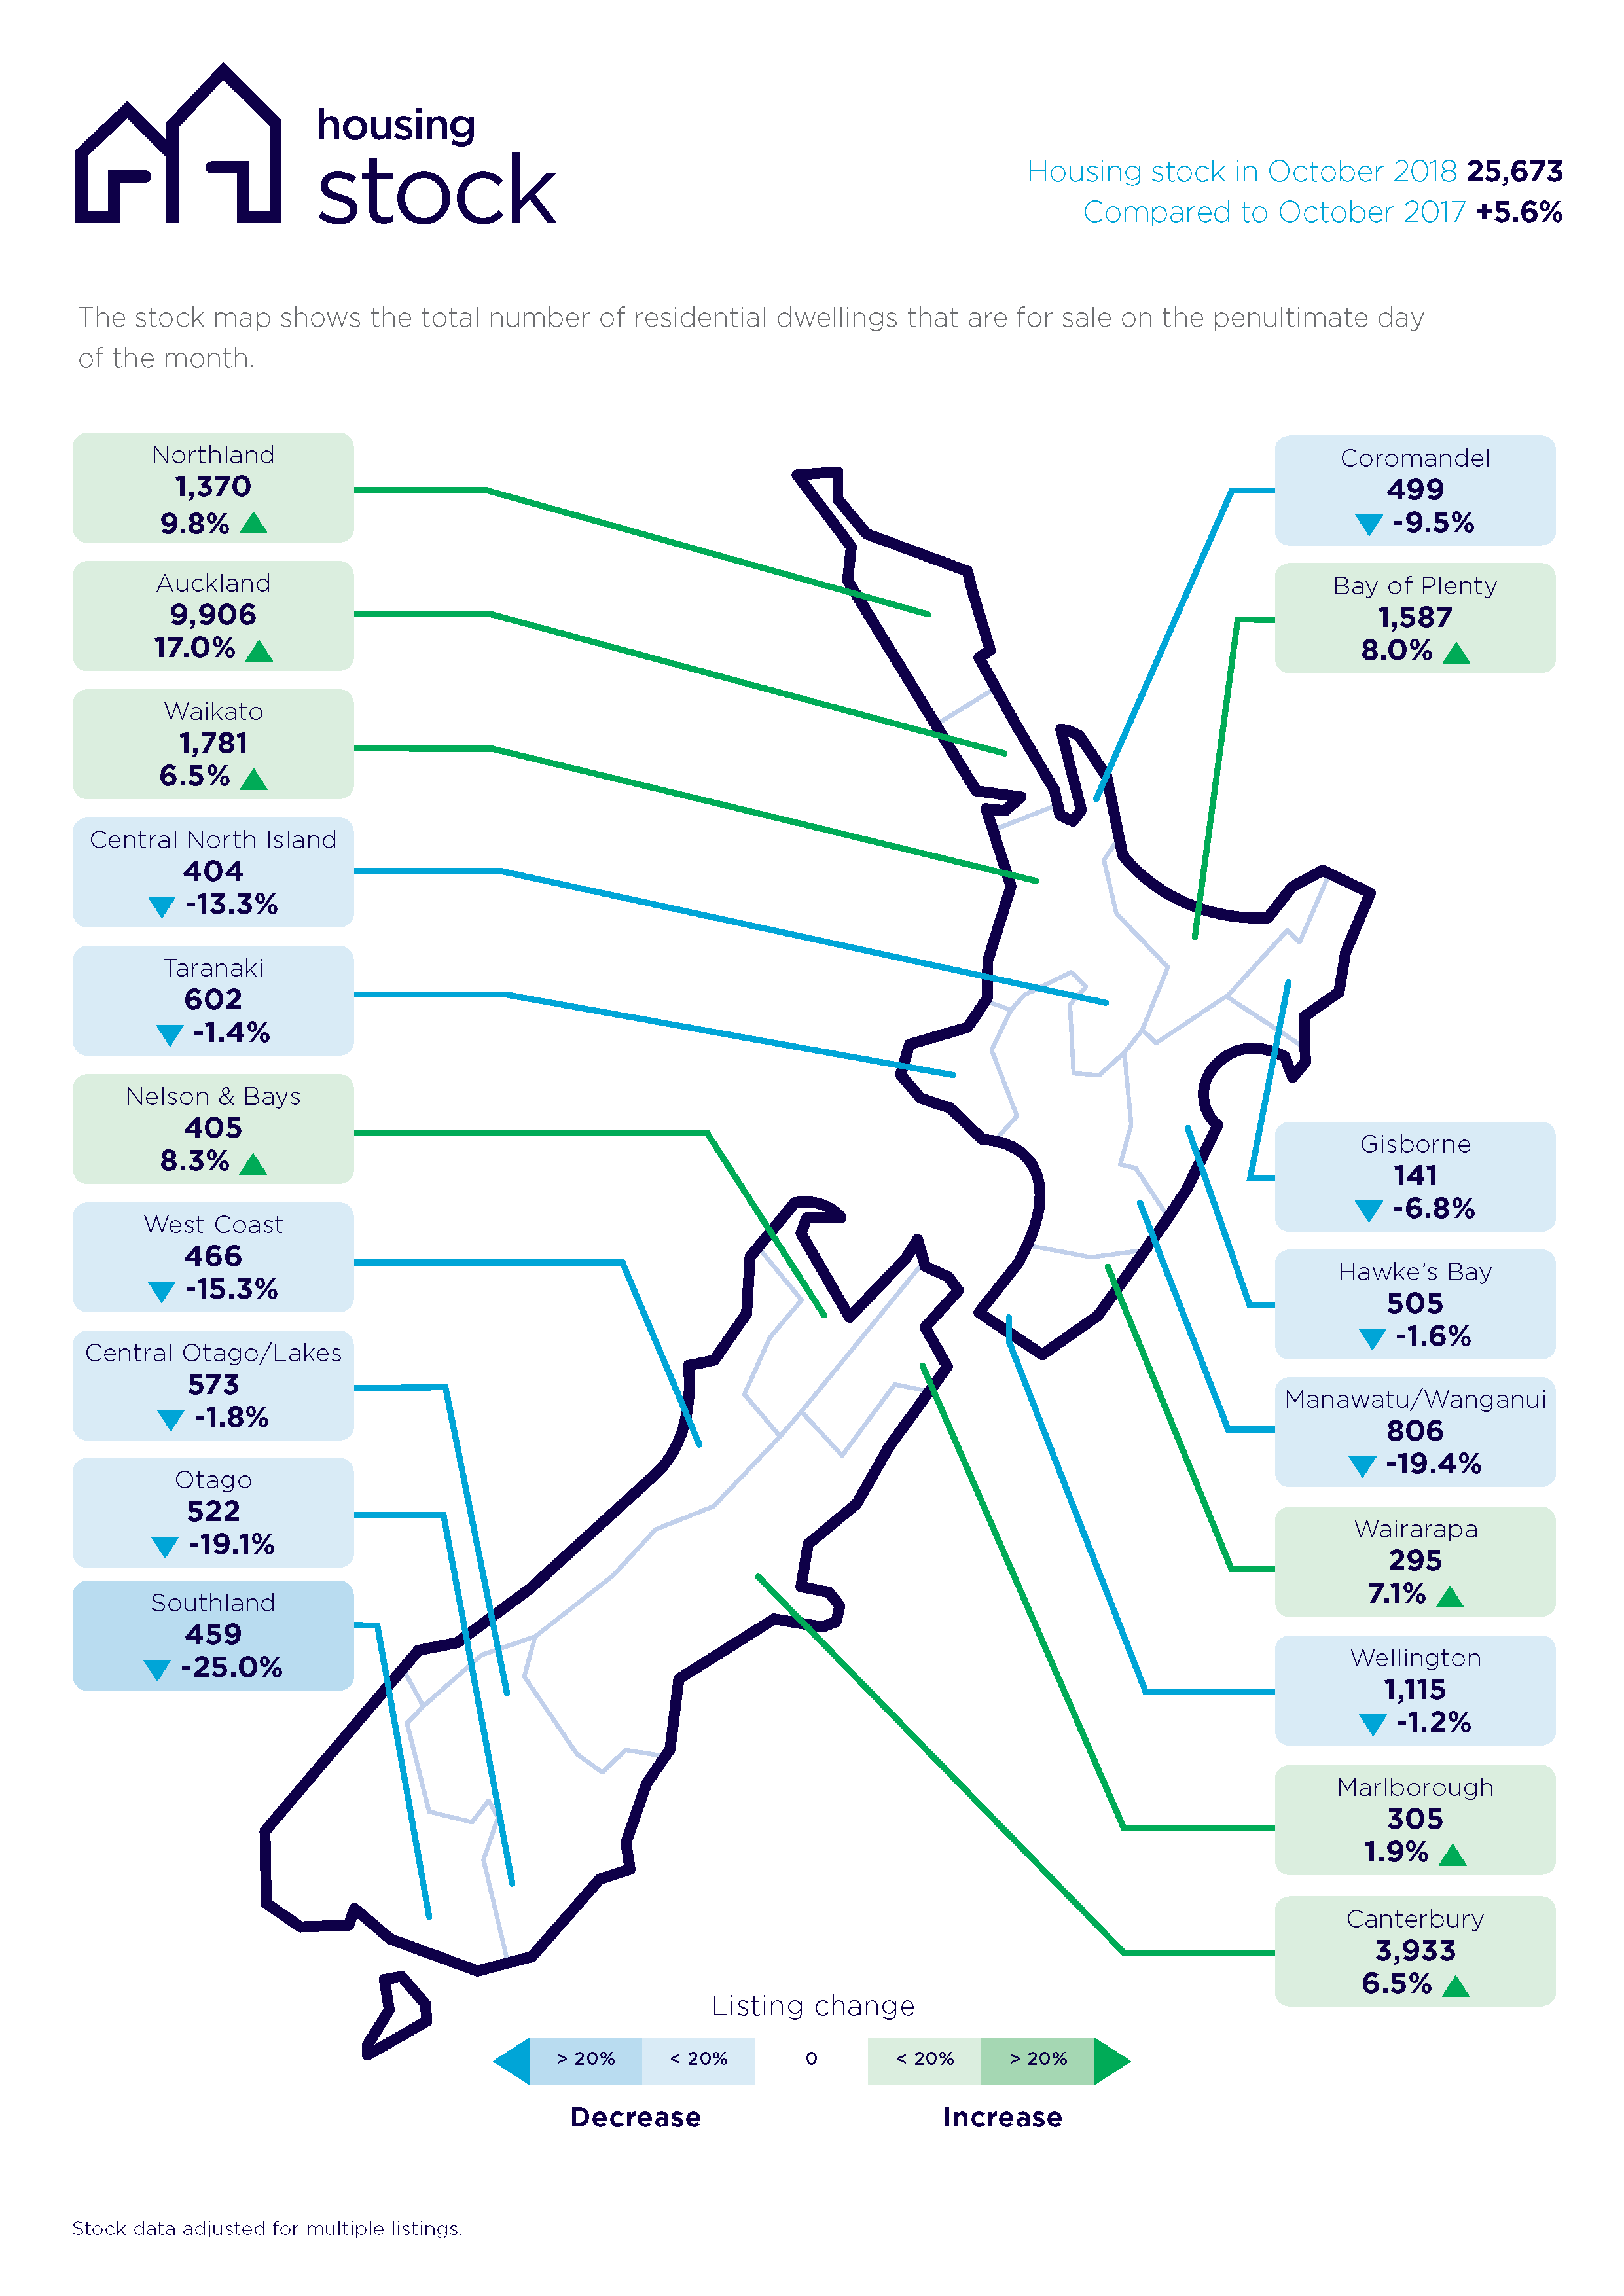
The total number of homes for sale is up 17.0% to 9,906 when compared to October 2017.
“Given the level of new listings, the total amount of stock for sale and a slowing of sales rates, the Auckland market is favouring buyers to an extent we haven’t seen for nearly nine years.
“It means that buyers have a lot more choice and can take a considered approach to their buying process,” says spokesperson Vanessa Taylor.
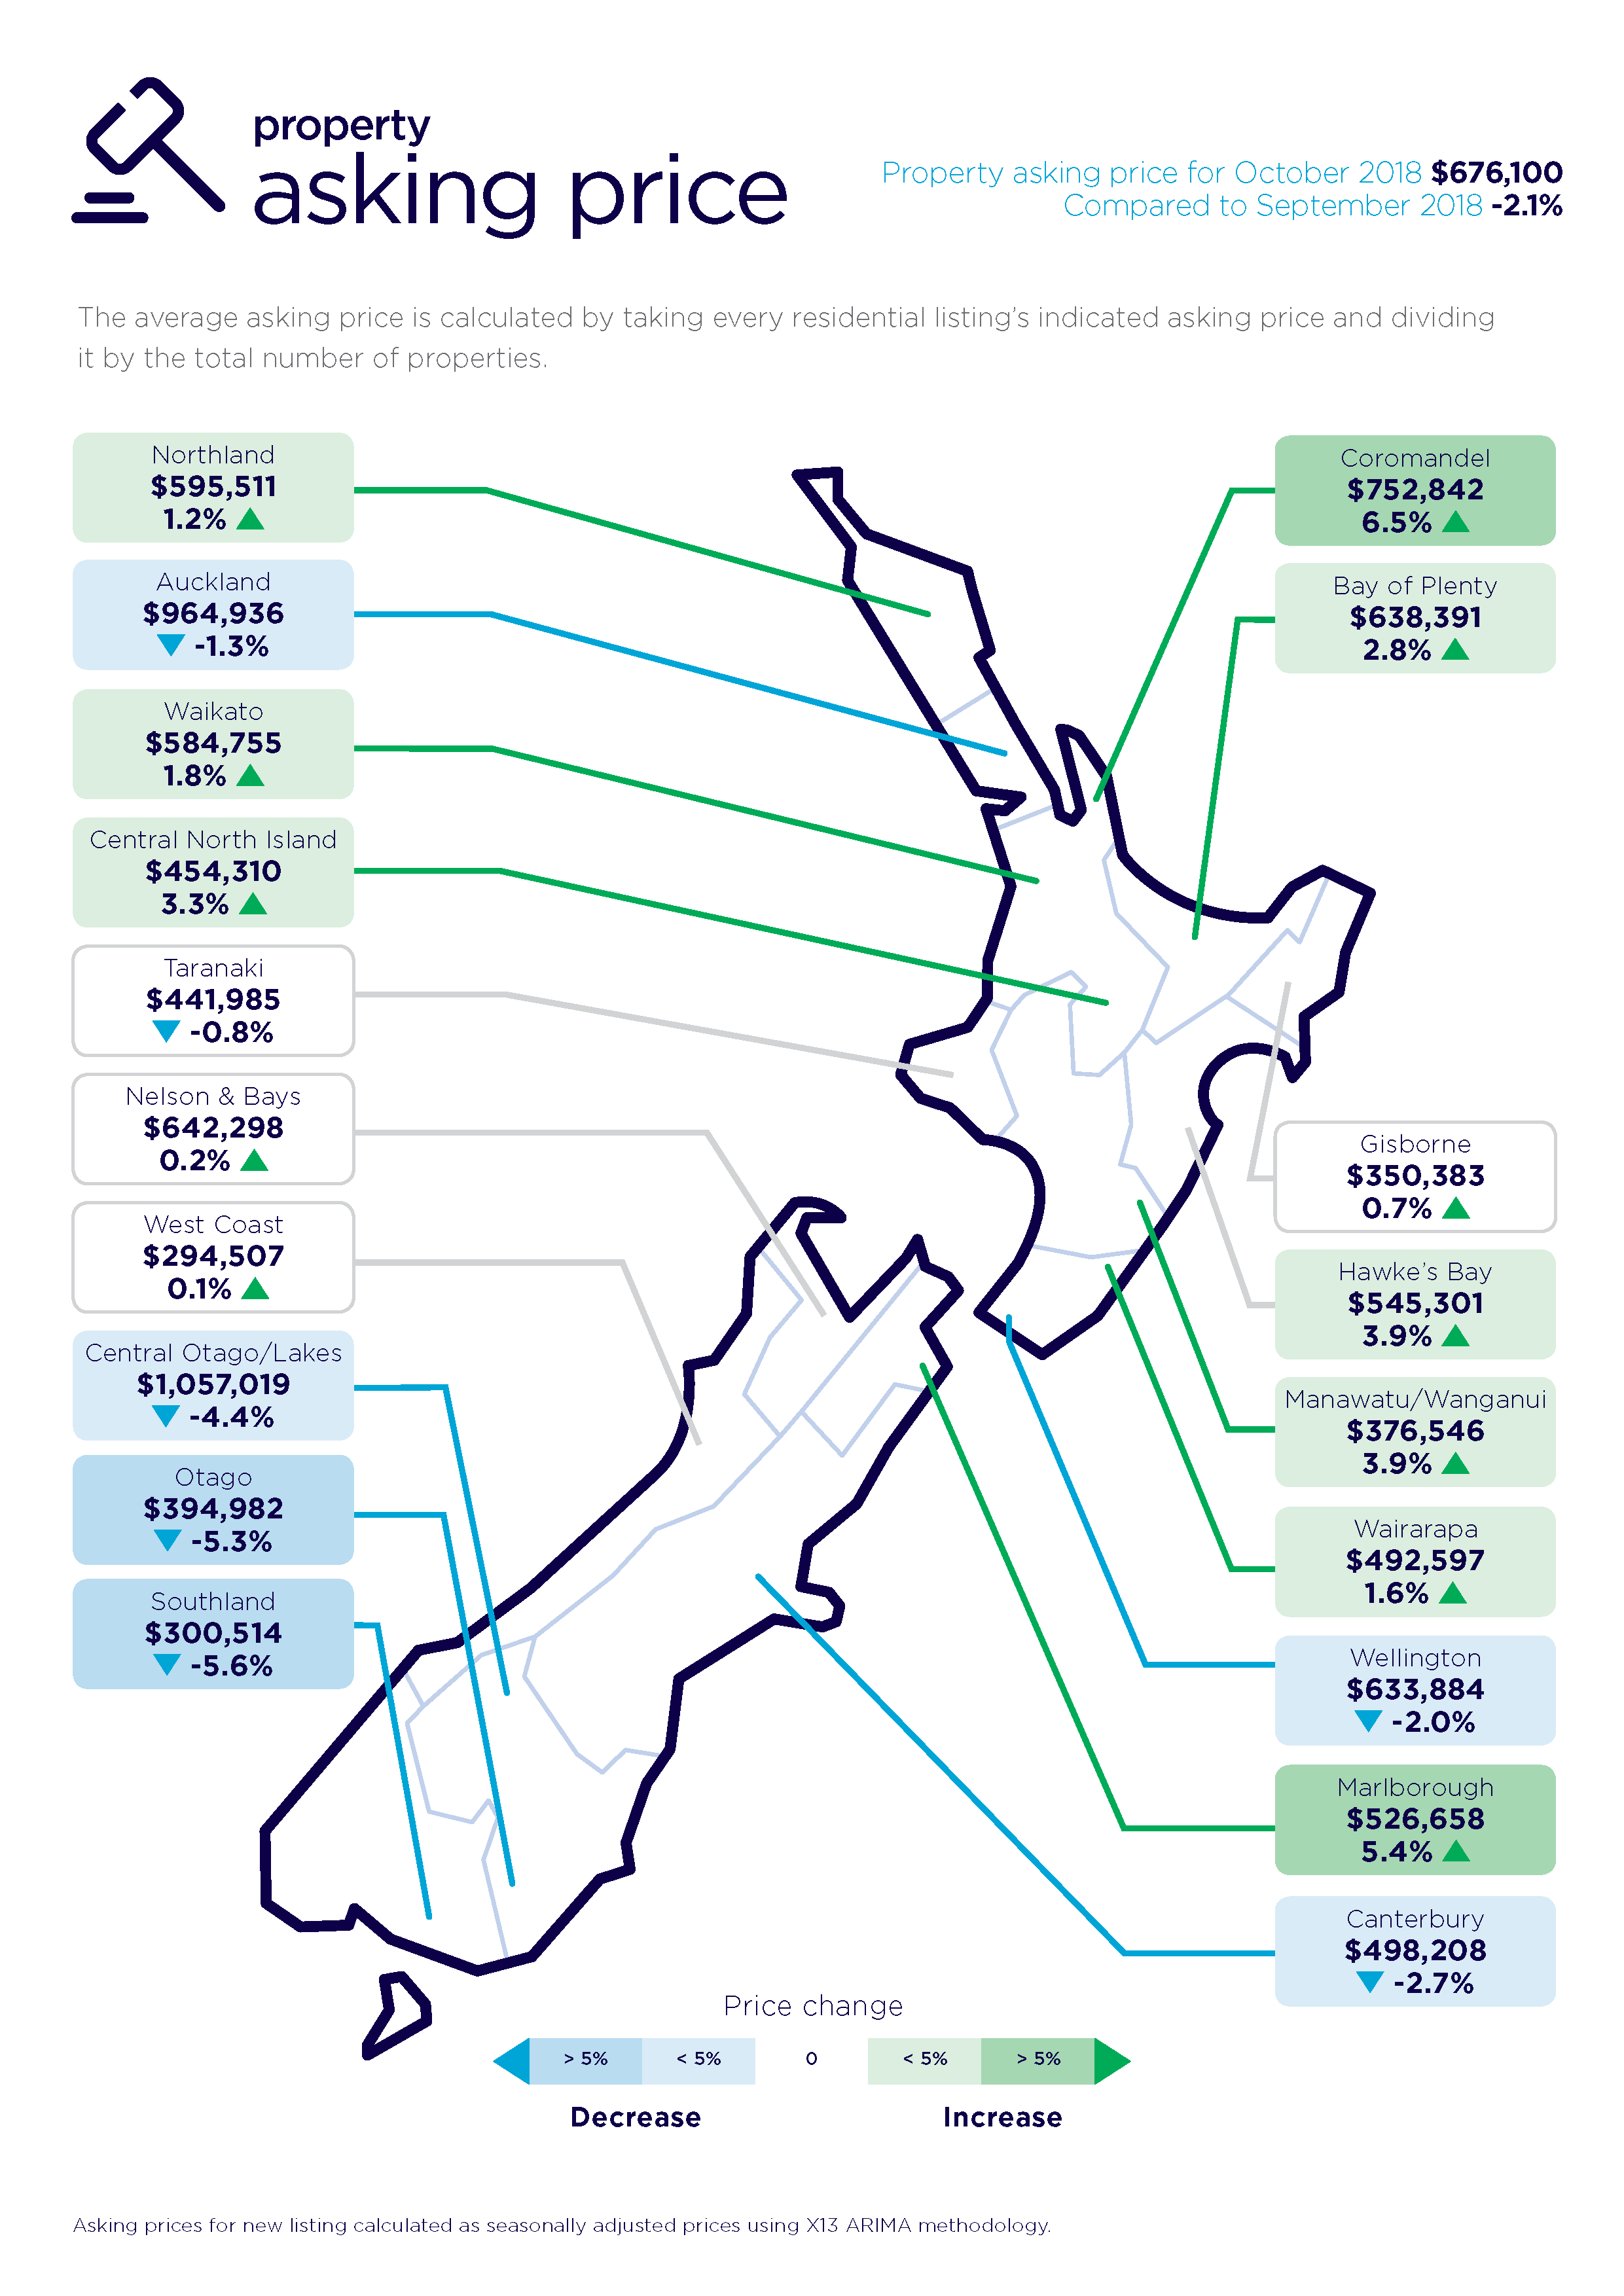
Average asking prices in the Auckland region dipped 1.3% compared to September 2018, dropping to $964,936.
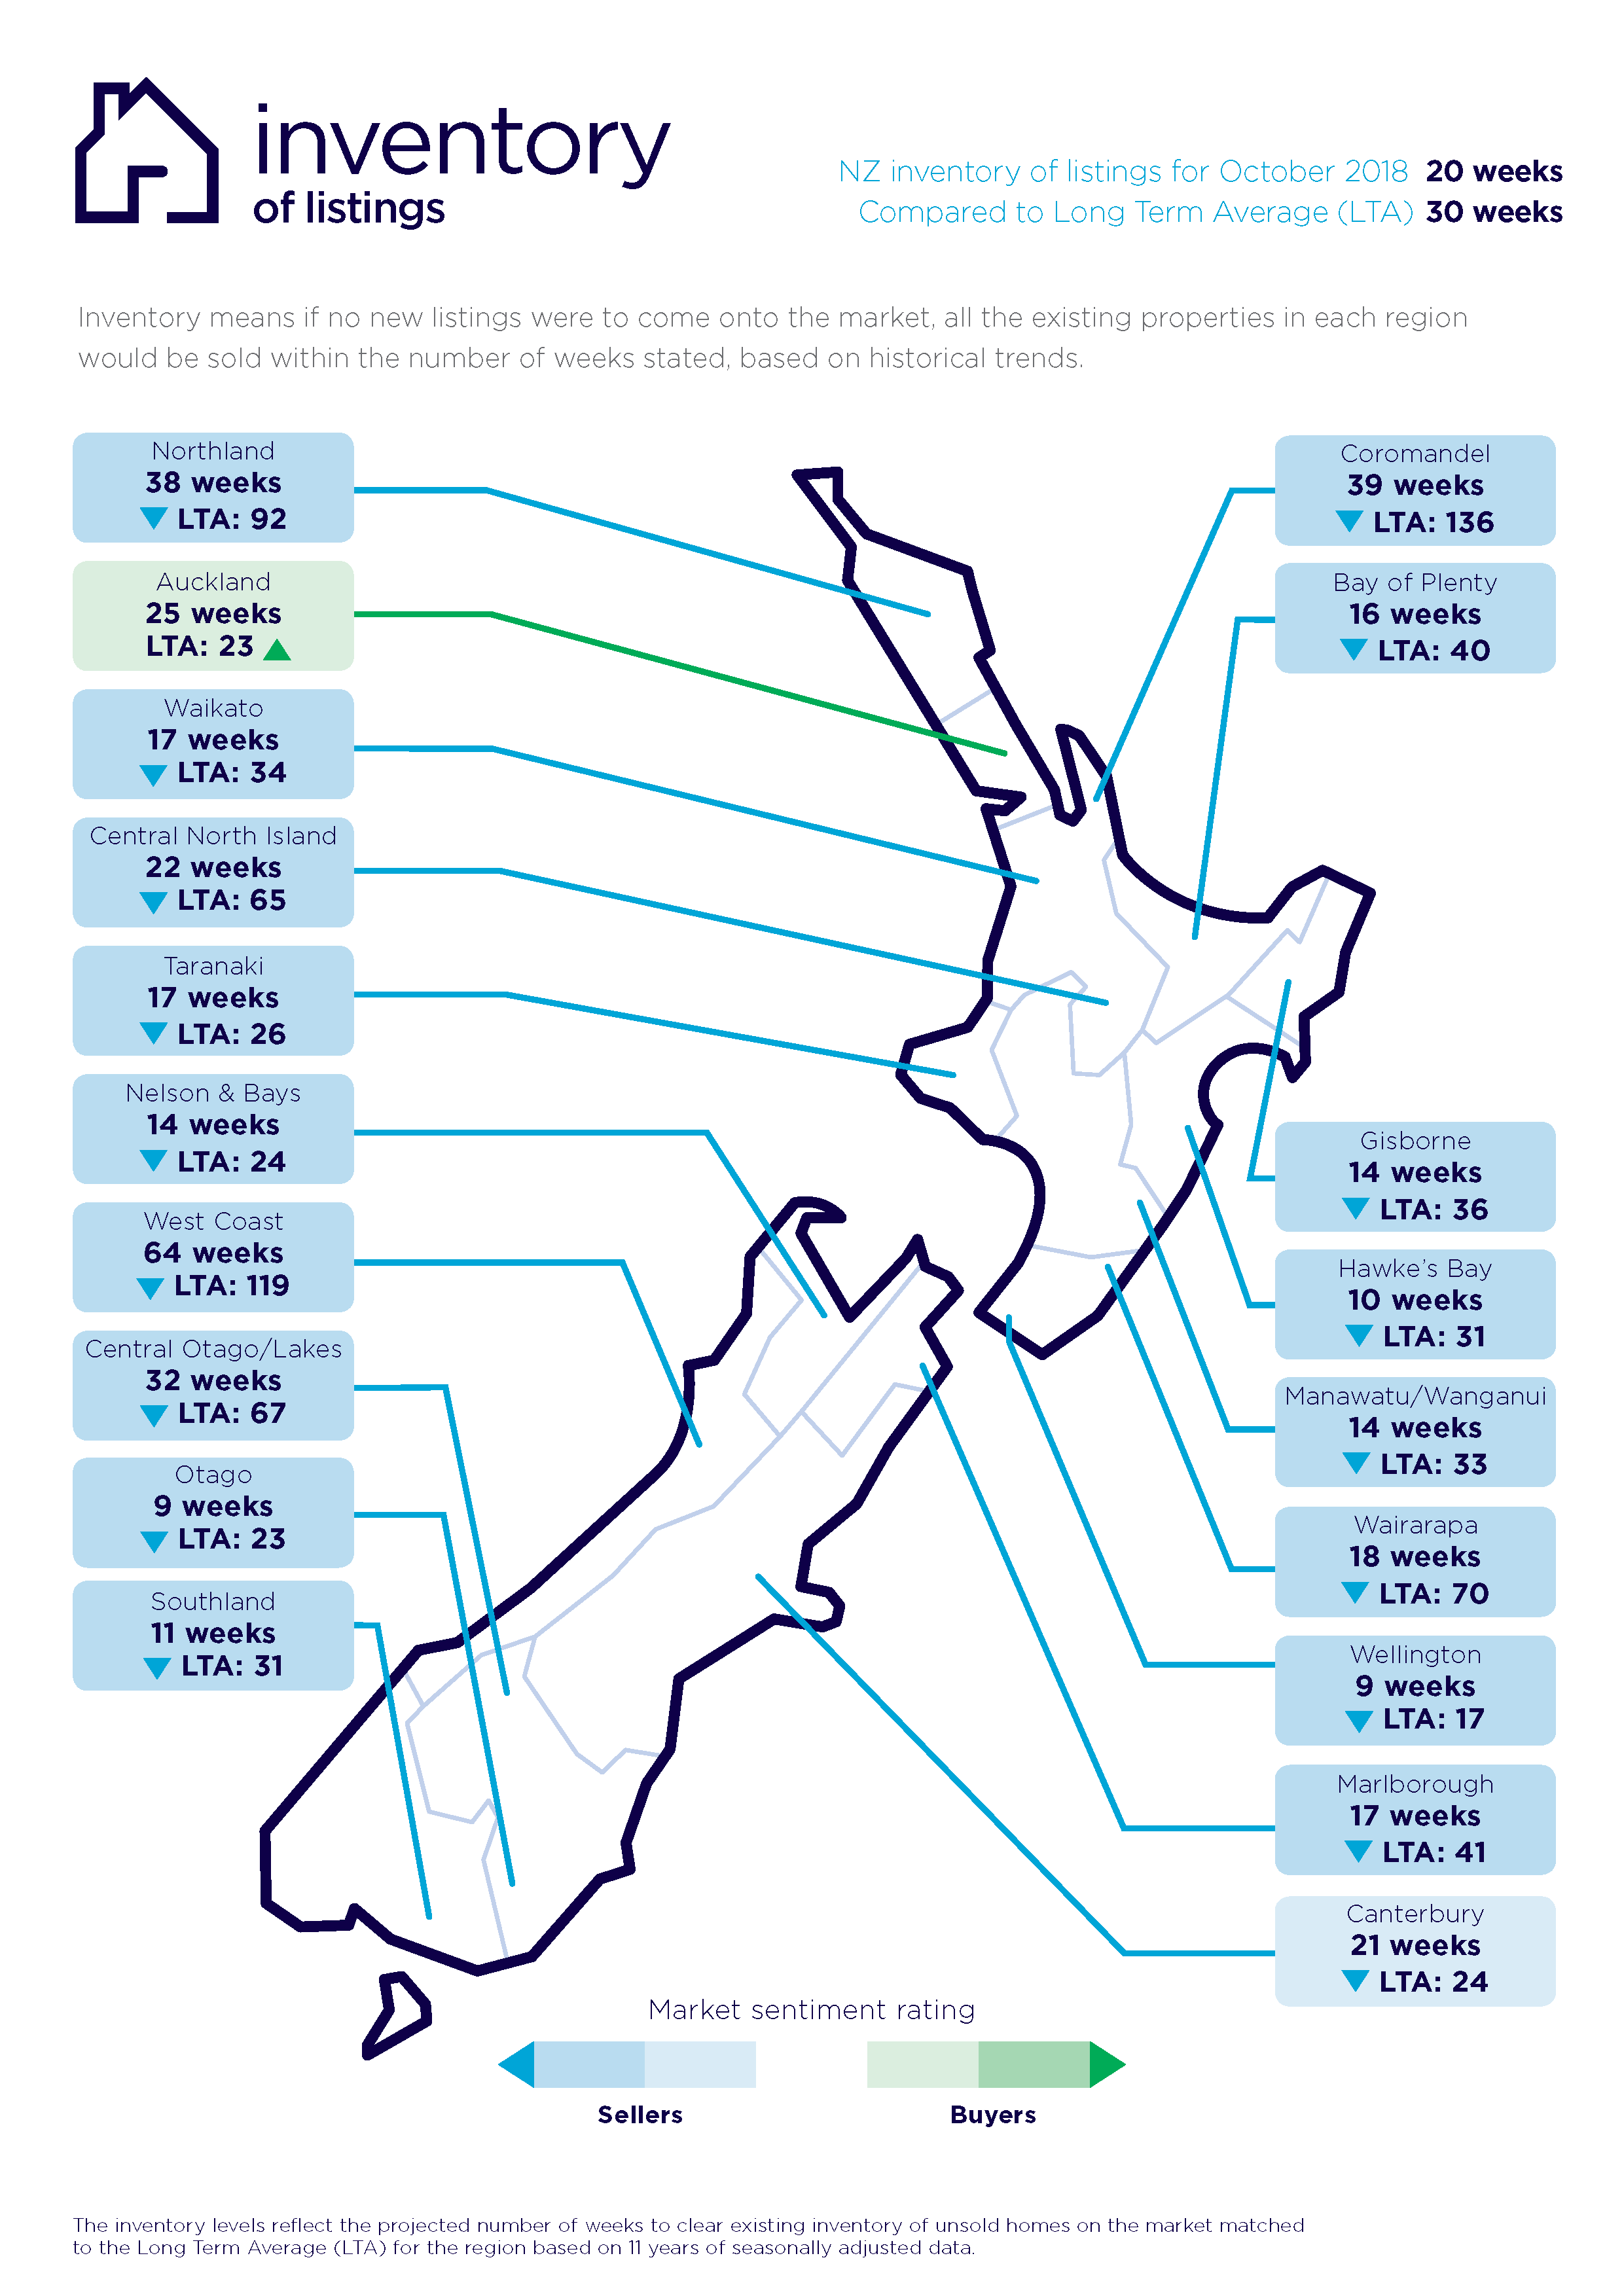
This injection of new listings and increase in total stock shows us that if theoretically no new homes were to come onto the market, at the current sale rate, the total pool of houses for sale on the market would sell out in 25 weeks – which is two weeks more than the long-term average of 23 weeks in the Auckland region.
“There’s plenty of homes for buyers to choose from, without having to deal with the frantic market that we’ve seen in past years” says Vanessa.
“It’s not just the Auckland region which is alive and well,” says Vanessa.
Across the country interest is high, with 901,919 unique browsers visiting the realestate.co.nz site during October. Of this, 94,955 were searching in the Auckland region alone.
All-time asking price highs - Marlborough, Hawke’s Bay, Manawatu/Wanganui, Waikato regions
Although nationally the average asking price dropped by 2.1% (mostly driven by the major centres), bucking the trend were three provincial regions which recorded all-time asking price highs.
“This year regional New Zealand has often shown to be more optimistic,” says Vanessa.
The Marlborough region’s average asking price has lifted to $526,658 (up 5.4%), followed by Hawke’s Bay $545,301 (up 3.9%) and Manawatu/Wanganui $376,546 (up 3.9%).
The Waikato region also recorded an all-time asking price high at $584,755 (up 1.8%).
Central Otago/Lakes District, Canterbury and Wellington regions have been busy
Typically, the Auckland and the Central Otago/Lakes regions dance for the top spot on the asking price table, however the South Island is clearly the winner. This month the gap between the two regions narrowed, but both regions experienced a fall.
The average asking price in Central/Otago Lakes fell 4.4%, compared to Auckland’s fall of 1.3%.
Central Otago/Lakes remains the only region to top the ‘one million dollar’ average asking price across the country at $1,057,019.
“Coming into summer, this small drop in average asking price for the popular outdoor playground of Queenstown was counterbalanced by a significant lift in the choice of homes for sale,” says Vanessa.
New listings are up 22.3% in the region, representing 236 homes.
Also in the South Island, the Canterbury region continues to be one of the most active markets in the country.
“It’s a unique region,” says Vanessa.
“There have been a number of times this year when the Canterbury region has bucked other main city trends, but this month it has a similar profile to the Auckland, Central Otago/Lakes and Wellington regions,” says Vanessa.
“A big climb in new listings and a small drop in asking price will make it an attractive market for home buyers,” says Vanessa.
New listings in the Canterbury region lifted 12.3% to 1,776, while the average asking price dropped 2.7% to $498,208.
In the past month the Canterbury region had more than 44,000 unique browsers looking at property.
“Cantabrians remain the biggest searchers for property within the region, which is no surprise. They’re followed by property seekers from the Auckland, Otago and Wellington regions.
“However, there is also interest from Australia, with New South Wales and Queensland registering the next highest levels of seekers after the main New Zealand centres,” says Vanessa.
The most popular suburbs searched were Fendalton, Rangiora, Christchurch Centre, Cashmere, then Rolleston.
Back to the north, the Wellington region has been traditionally a tightly held market with relatively fewer stock options, influenced by the condensed size of the market, says Vanessa Taylor.
“However, in October new listings in the region lifted 10.0% which is very timely, considering the level of new listings has been sluggish since April,” says Vanessa.
The total number of new listings for November was 826 across the Wellington region.
The Wellington region also followed the property asking price trend seen across the Auckland, Central Otago-Lakes and Canterbury regions. The Wellington region registered a 2.0% fall in its average asking price ($633,884).
Central North Island region the “wild card”
“Central North Island is going all out to get the buyers,” says Vanessa.
The number of new property listings in October surged by 57.6% in the month compared to the same period in 2017.
The 227 new listings in October made up over half of the total number of homes available for sale in the region (404).
“However, the total number of listings is down 13.3% from the October last year.
“It’s all go in the Central North Island,” says Vanessa.
For media enquiries, please contact:
Alex Dudley, PPR T: 027 5399 555 E: alex.dudley@ppr.co.nz
Glossary of terms:
As the only provider of real estate data in real time, realestate.co.nz offers valuable property market information not available from other sources.
• Average asking price is not a valuation. It is an indication of current market sentiment. Statistically, asking prices tend to correlate closely with the sales prices recorded in future months when those properties are sold. As it looks at different data, average asking prices may differ from recorded sales data released at the same time.
• Inventory is a measure of how long it would take, theoretically, to sell the current stock at current average rates of sale if no new properties were to be listed for sale. It provides a measure of the rate of turnover in the market.
• New listings are a record of all the new listings on realestate.co.nz for the relevant calendar month. As realestate.co.nz reflects 97% of all properties listed through registered real estate agents in New Zealand, this gives a representative view of the New Zealand property market.
• Demand: the increase or decrease in the number of views per listing in that region, taken over a rolling three-month time frame, compared to the same three-month time frame the previous year – including the current month.
• Seasonal adjustment is a method realestate.co.nz uses to better represent the core underlying trend of the property market in New Zealand. This is done using methodology from the New Zealand Institute of Economic Research.
• Truncated mean is the method realestate.co.nz uses to provide statistically relevant asking prices. The top and bottom 10% of listings in each area are removed before the average is calculated, to prevent exceptional listings from providing false impressions.
Share
-
.svg)
.svg)
.svg)