
.svg)


Property market heats up across the regions - but Auckland isn’t one of them
Nine out of 19 regions in New Zealand recorded an all-time high asking price in January, while prices in Auckland remained static.
“Several regions recorded spikes in the average asking price in January, most notably Central Otago/Lakes, where a 17.6 per cent increase saw the average asking price reach $888,567.
“While the national average asking price climbed just 1.1 per cent last month, this is still an all-time high of $624,709. However, the full set of statistics would suggest that seasonality is still in full swing,” says realestate.co.nz CEO Brendon Skipper.
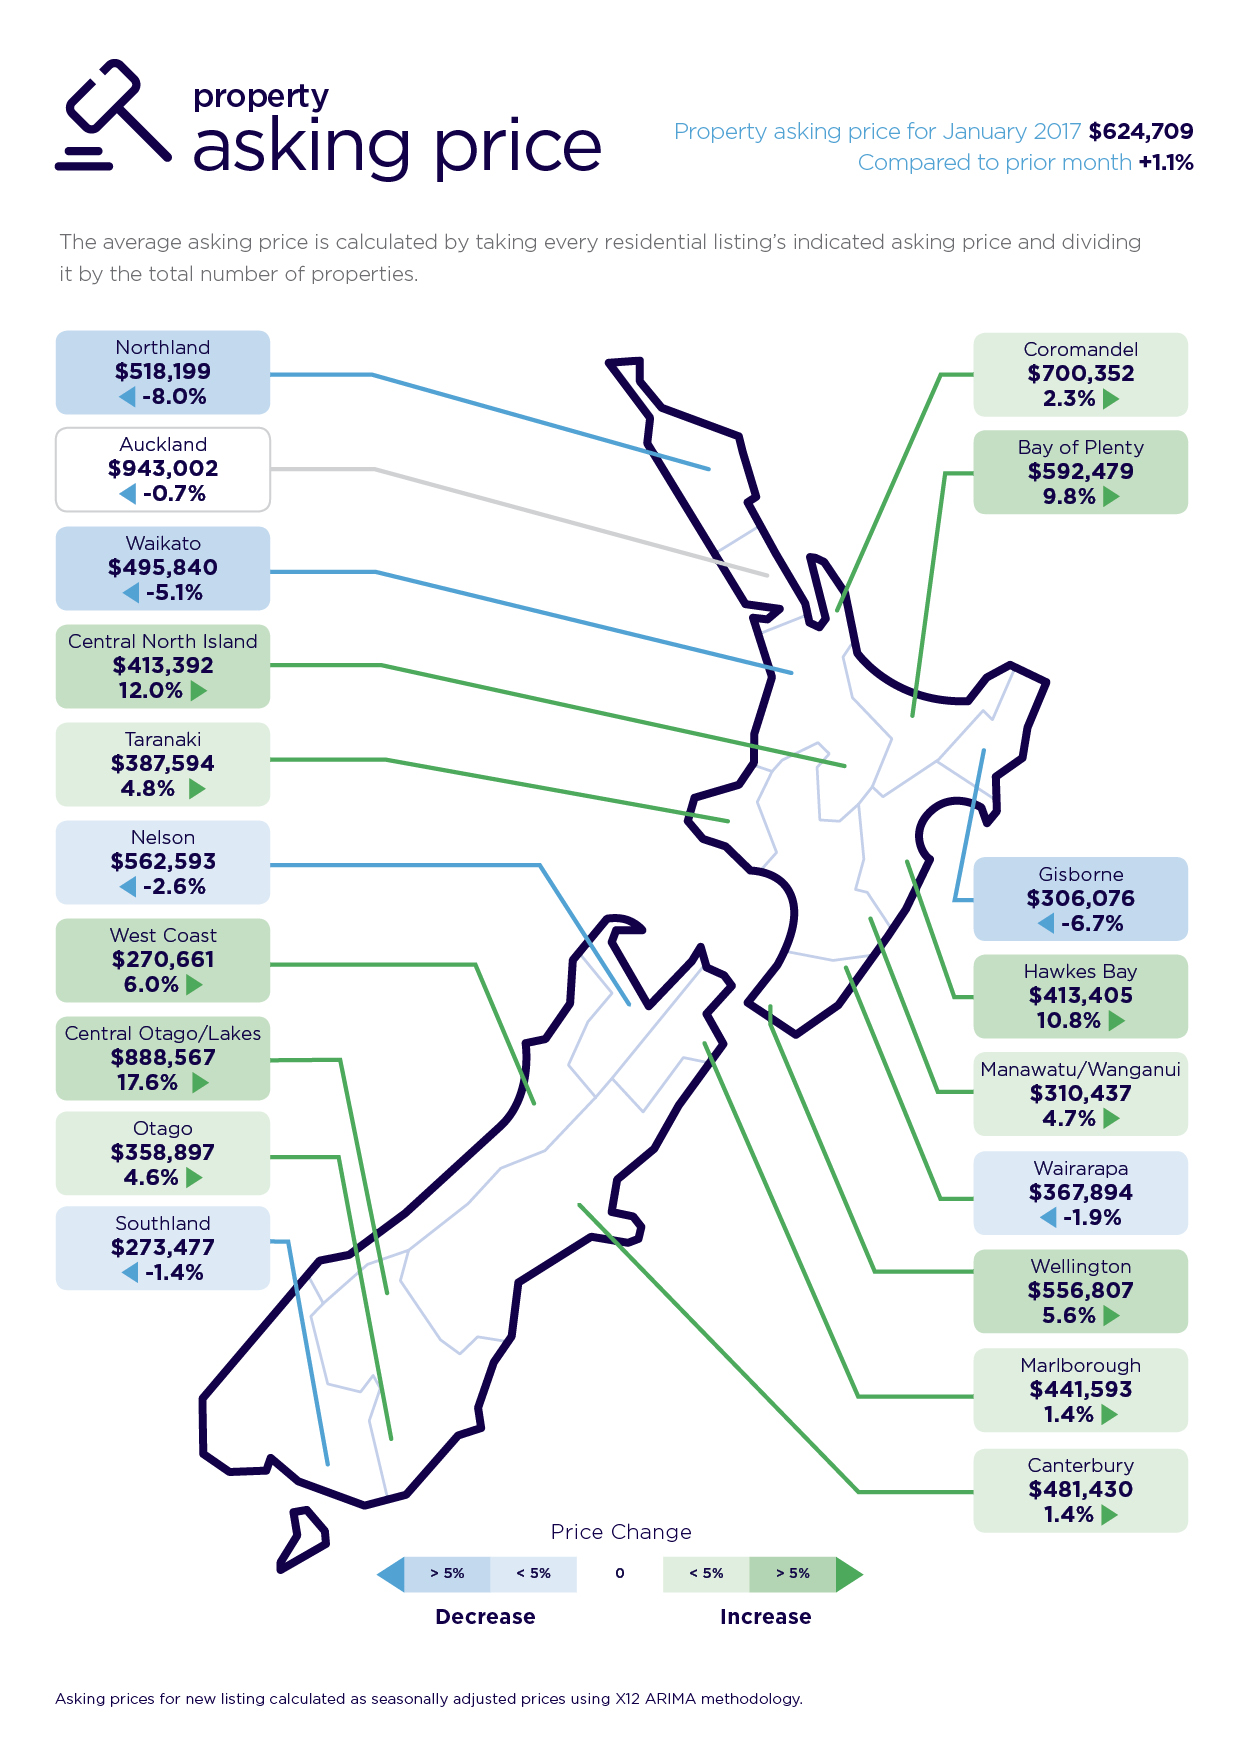
Real-time market statistics from realestate.co.nz show that Central Otago/Lakes recorded the biggest average asking price increase, followed by Central North Island at 12 per cent ($413,392), Hawkes Bay at 10.8 per cent ($413,405) and Bay of Plenty at 9.8 per cent ($592,479).
“Wellington is always an interesting market to watch and in January was another region showing an all-time high in terms of asking price at 5.6 per cent ($556,807). However, it’s looking light in terms of listings with only six weeks’ worth of inventory, compared to 16 weeks in Auckland,” says Brendon.
Other upward movers included Taranaki at 4.8 per cent ($387,594); Manawatu/Wanganui up 4.7 per cent ($310,437); Otago up 4.6 per cent ($358,897) and Coromandel up 2.3 per cent ($700,352).
“At this point it’s too early to tell if this upward spike will be a trend for 2017,” says Brendon.
The average asking price in Auckland in January was $943,002 compared with the previous month at $949,898.
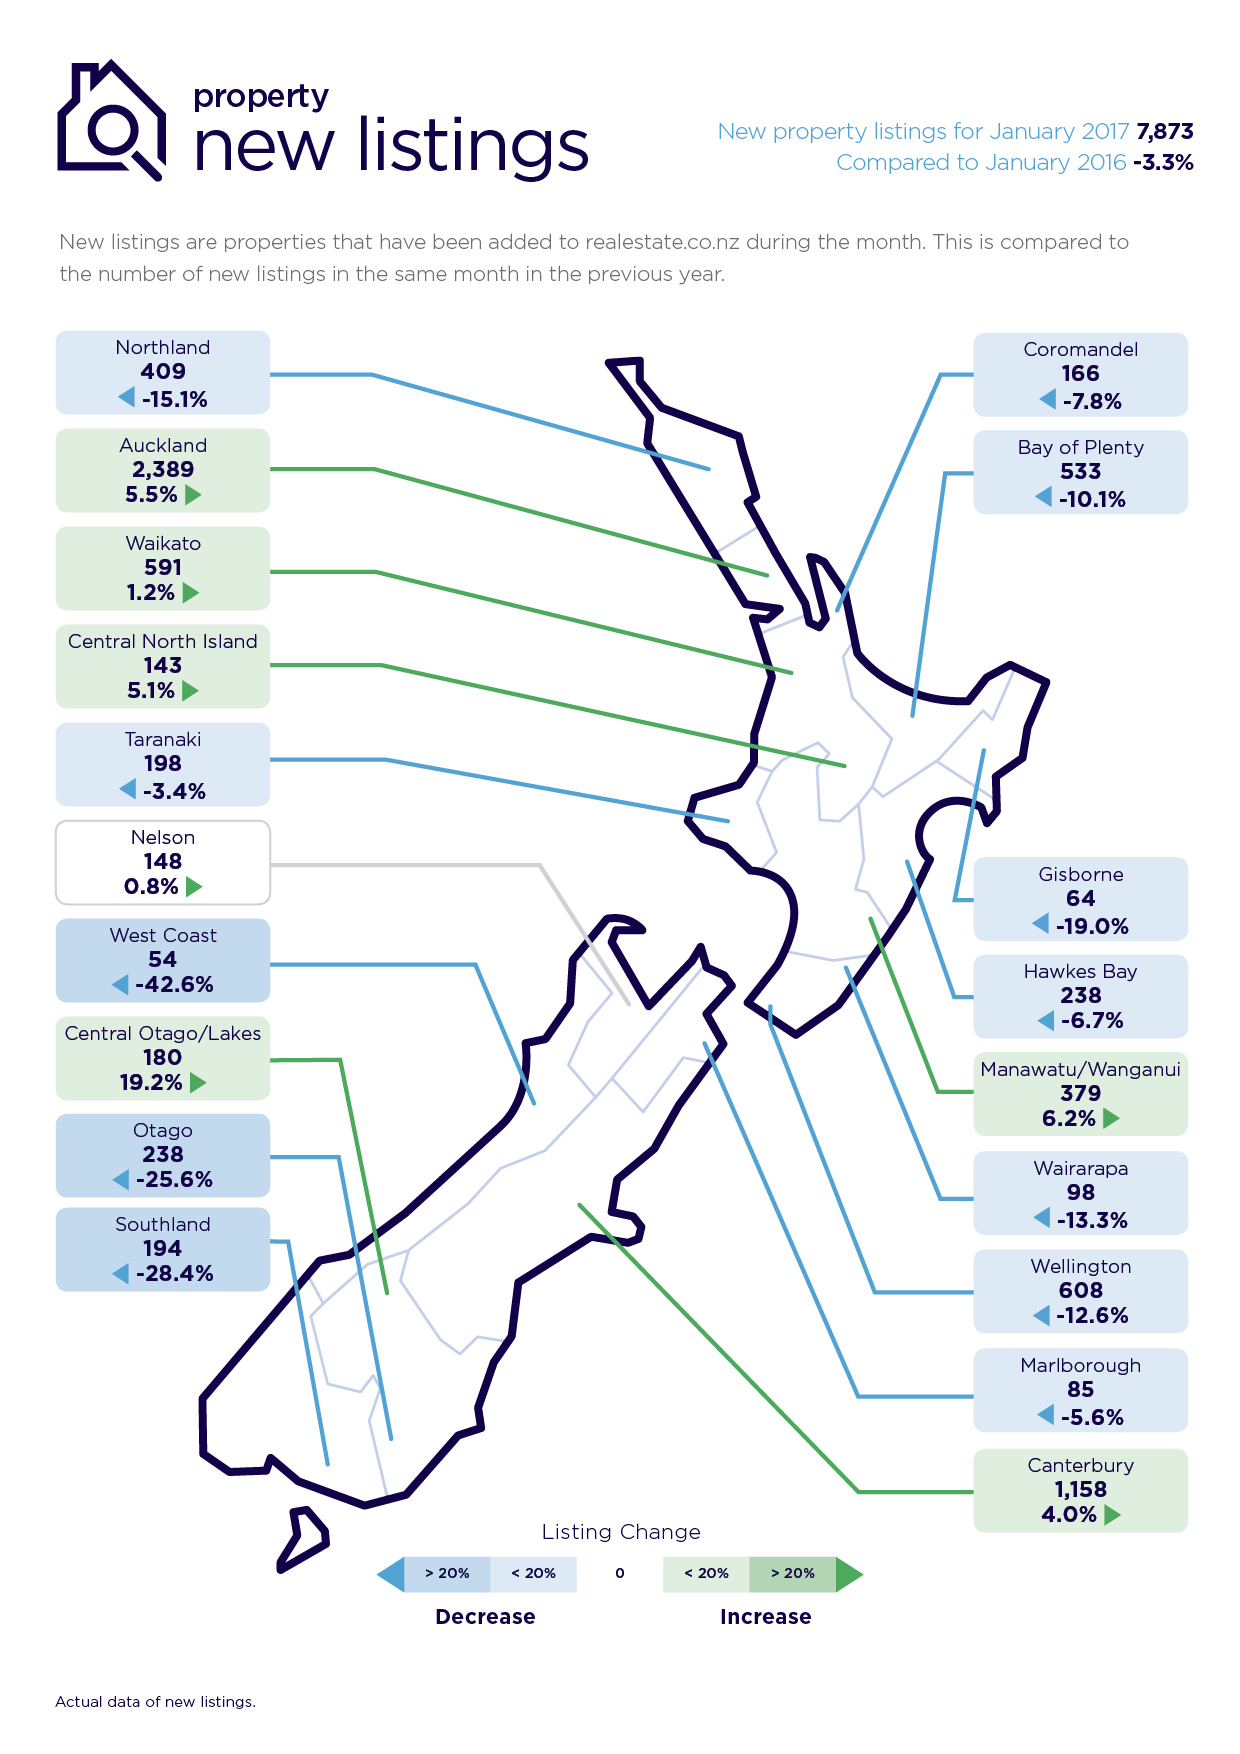
“In Auckland it’s too early to say whether asking prices have been affected by the traditional seasonality, as the asking price remained quite static in January. However, new listings are up 5.5 per cent compared to January 2016. We have seen another drop in demand in Auckland, down 25.39 per cent, meaning buyers can approach the market with more choice,” says Brendon.
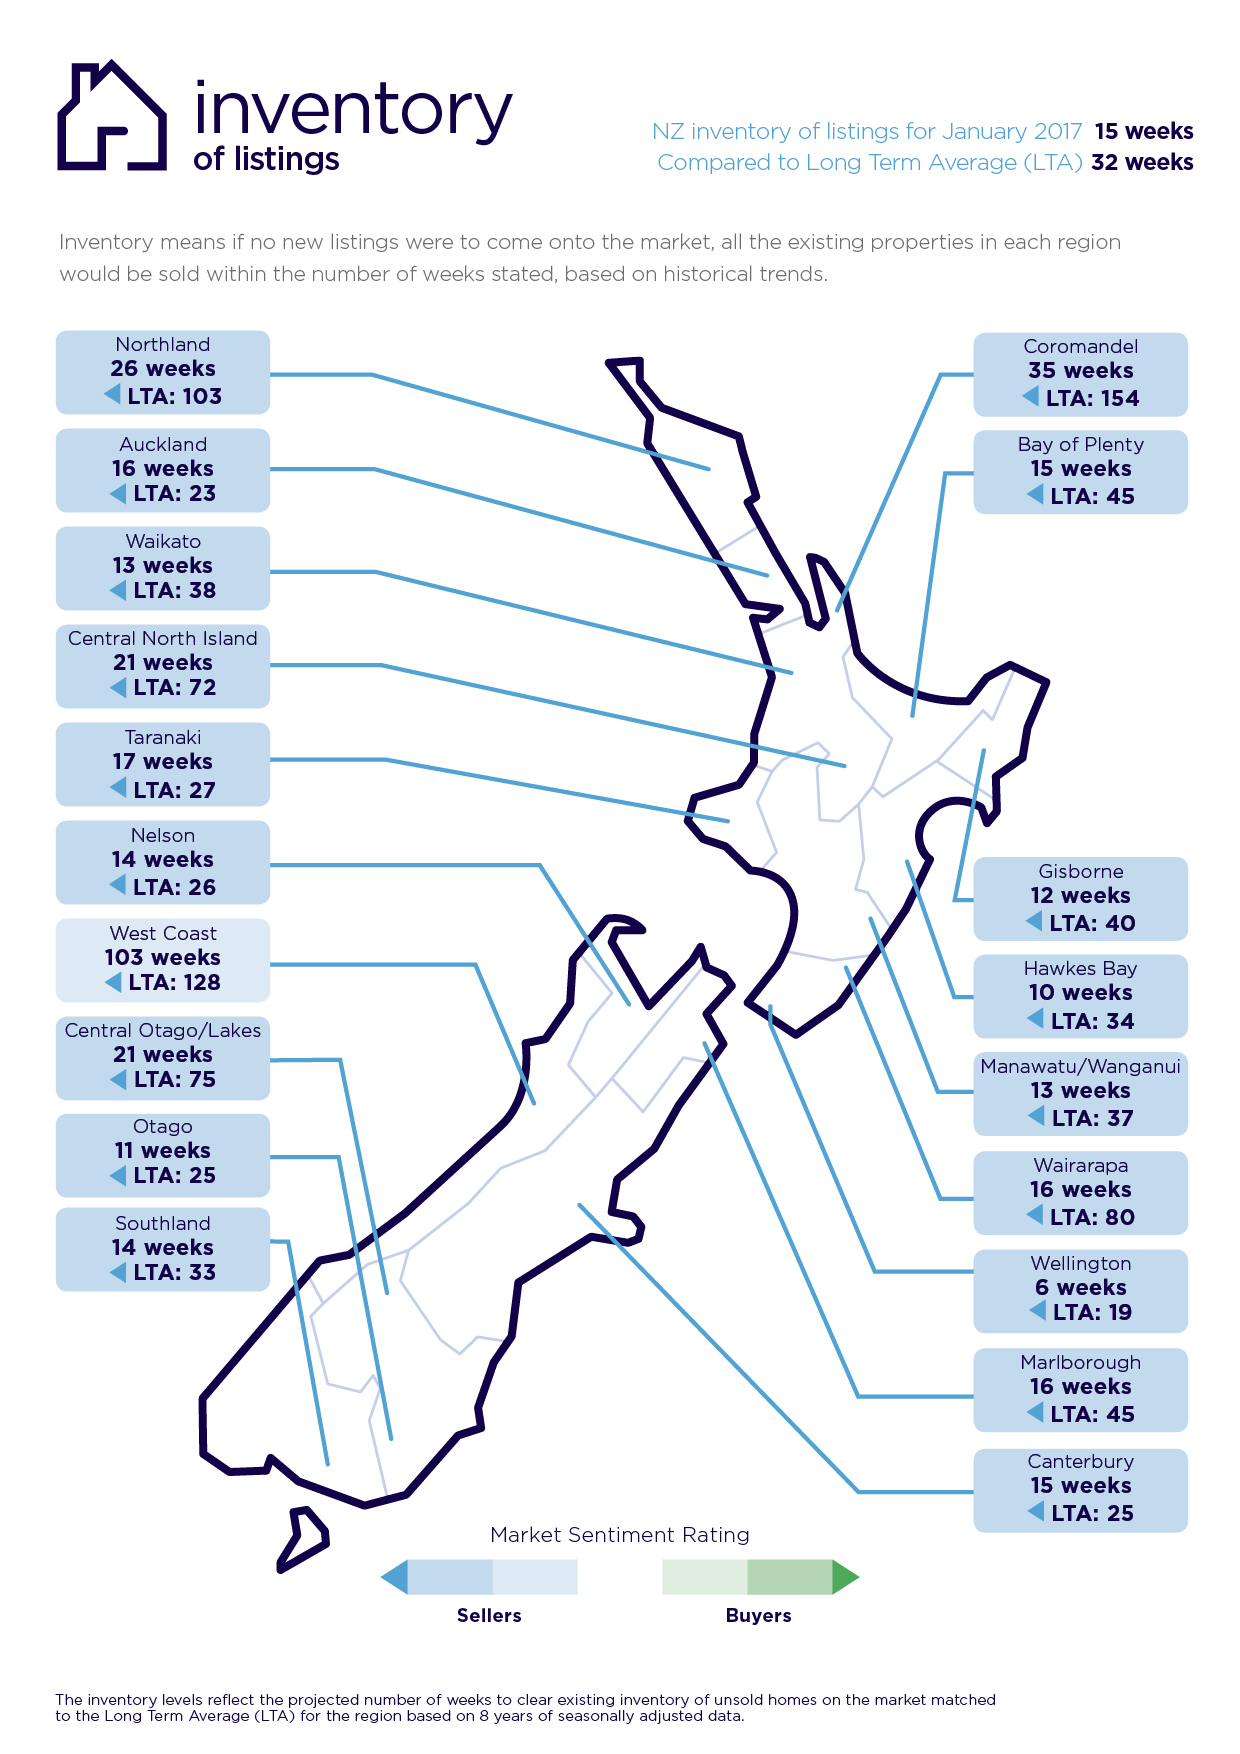
In terms of inventory around New Zealand, Auckland is sitting at 16 weeks; Taranaki is sitting at 17 weeks; Manawatu/Wanganui is sitting at 13 weeks; Otago at 11 weeks and Coromandel at 35 weeks.
Inventory provides a measure of the rate of turnover in the market, by calculating how long it would take for current property stock to sell out if, theoretically, no new properties were to be listed after today.
“Next month should give us a clearer indication of trends across all measures,” says Brendon.
Regions that reached an all-time high in average asking price in January 2017:
Central Otago/Lakes +17.6% ($888,567)
Central North Island +12.0% ($413,392)
Hawkes Bay +10.8% ($413,405)
Bay of Plenty +9.8% ($592,479)
Wellington +5.6% per cent ($556,807)
Taranaki +4.8% ($387,594)
Manawatu/Wanganui +4.7% ($310,437)
Otago +4.6% ($358,897)
Coromandel +2.3% ($700,352)
For media enquiries, please contact:
Kate Carter, PPR
T: +64 21 514 004 E: kate.carter@ppr.co.nz
Share
-
.svg)
.svg)
.svg)