
.svg)


Property market on hold as Kiwis wait for election outcome
The New Zealand property market is in a ‘wait and see’ mode, as negotiations start in earnest to determine the shape of the government for the next parliamentary term, says realestate.co.nz spokesperson Vanessa Taylor.
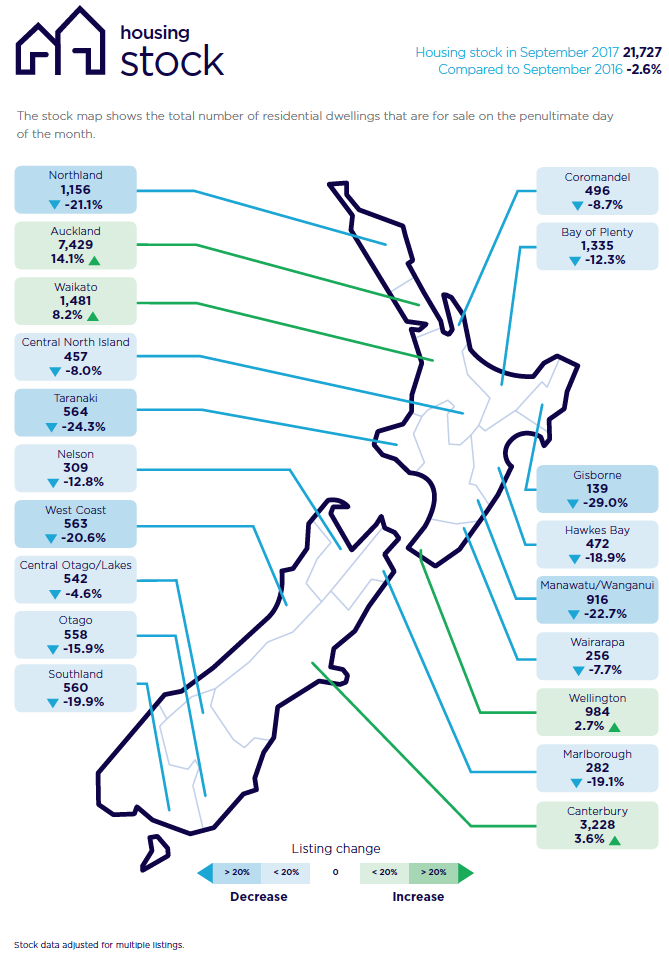
Real time statistics from realestate.co.nz show that September new listings, total stock and demand are all down across the country.
“Home ownership has been a hot topic leading up to these elections and people have adopted a wait-and-see position,” she says.
Across the nation, new property listings for the month of September fell 11.8 per cent to 9,283 when compared to September 2016.

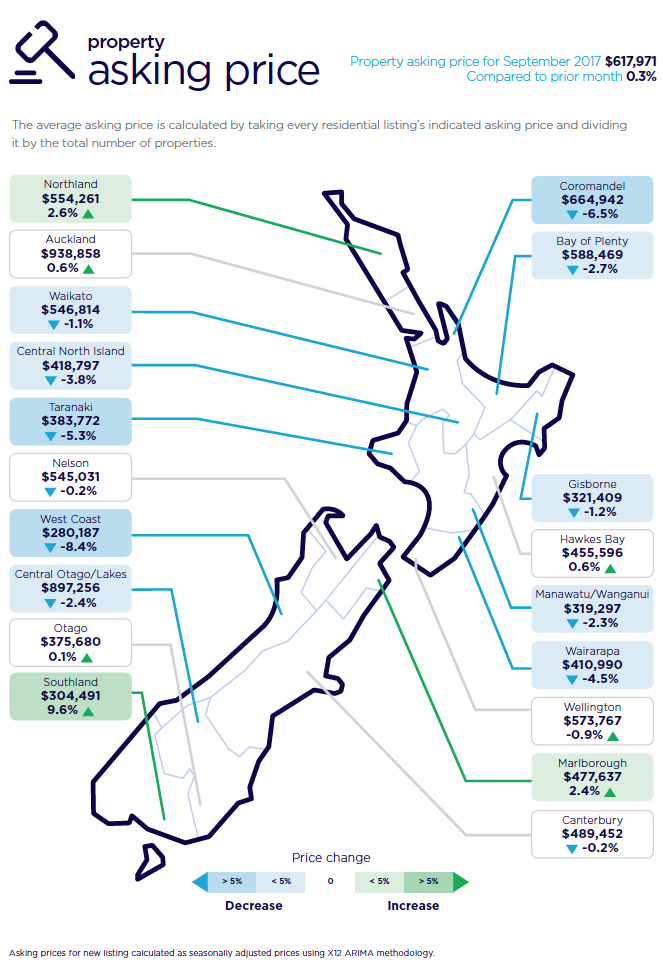
There has also been little movement in the average asking price across the country, which is sitting at $617,971 nationally.
“Prices have generally remained static, with only the Southland, Northland and Marlborough regions registering significant increases in asking prices when compared to last month,” she says.
“In a tight supply environment where there is a shortage of stock, it would be natural for buyers and sellers to assume that asking prices would be more likely to trend upwards.
However, sellers are tending to be realistic in the current environment, with buyers also in a ‘wait and see mode,’ says Vanessa Taylor.
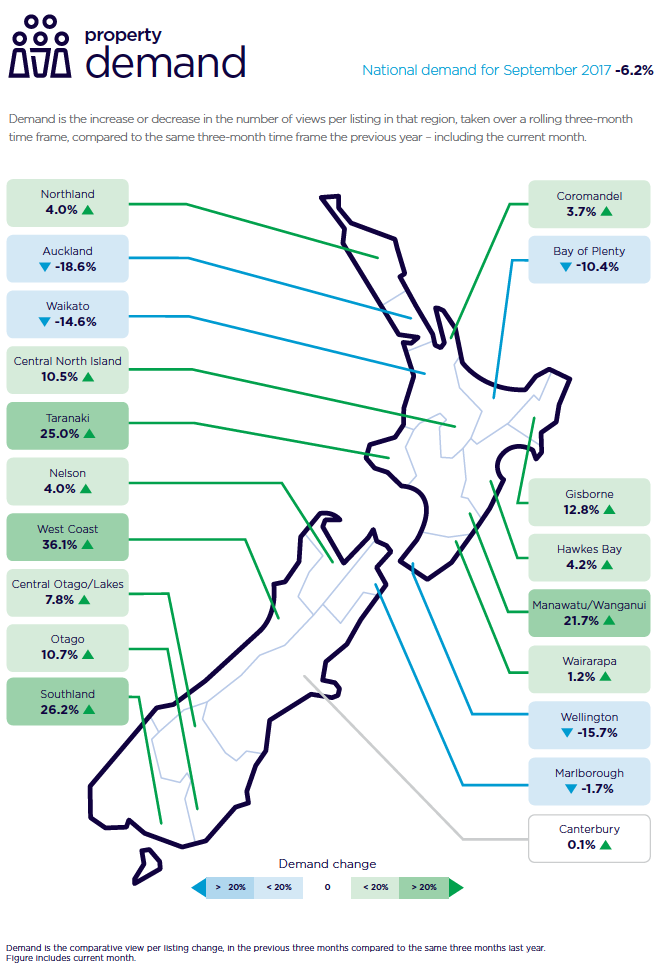
Auckland, Waikato, Wellington and Bay of Plenty bottom of the demand table
The fall in demand was particularly obvious in four regions which have previously been ‘buyer hot spots’, says Vanessa Taylor.
The Auckland region took bottom spot on the demand table (-18.6 per cent), with Wellington (-15.7 per cent), Waikato (-14.6per cent) and the Bay of Plenty (-10.4 per cent), close behind.
New listings in those same four regions (compared to September 2016) were also down.
The Bay of Plenty showed a 21.7 per cent drop in new listings, followed by Auckland (down 17.1 per cent), Wellington (down 13.7 per cent) and the Waikato (down 12.4 per cent).
Wairarapa, Central North Island, Marlborough and Canterbury buck new listings trend
While there was a major drop in new listings across the country compared to the same period last year (down 11.8 per cent) four regions bucked the trend.
The Wairarapa region showed a 29.8 per cent lift in new listings, followed by the Central North Island (19.3 per cent), Marlborough (4.2 per cent) and Canterbury (4.0 per cent).
Asking prices lift in just three of the 19 New Zealand regions
Of the 19 regions, only Southland, Northland and Marlborough recorded a lift in asking prices (up 9.6 per cent, 2.6 per cent and 2.4 per cent respectively) compared to August 2017).
Asking prices were static in six regions, recording increases in the zero to one per cent range. This included Auckland with a 0.6 per cent increase, taking the average asking price to $938,858, still under the one-million-dollar mark.
Of the remaining 10 regions, West Coast registered the largest fall in asking price compared with the previous month, dropping 8.4 per cent to $280,187.
• Average asking price gives an indication of current market sentiment. Statistically, asking prices tend to correlate closely with the sales prices recorded in future months when those properties are sold. As it looks at different data, average asking prices may differ from recorded sales data released at the same time.
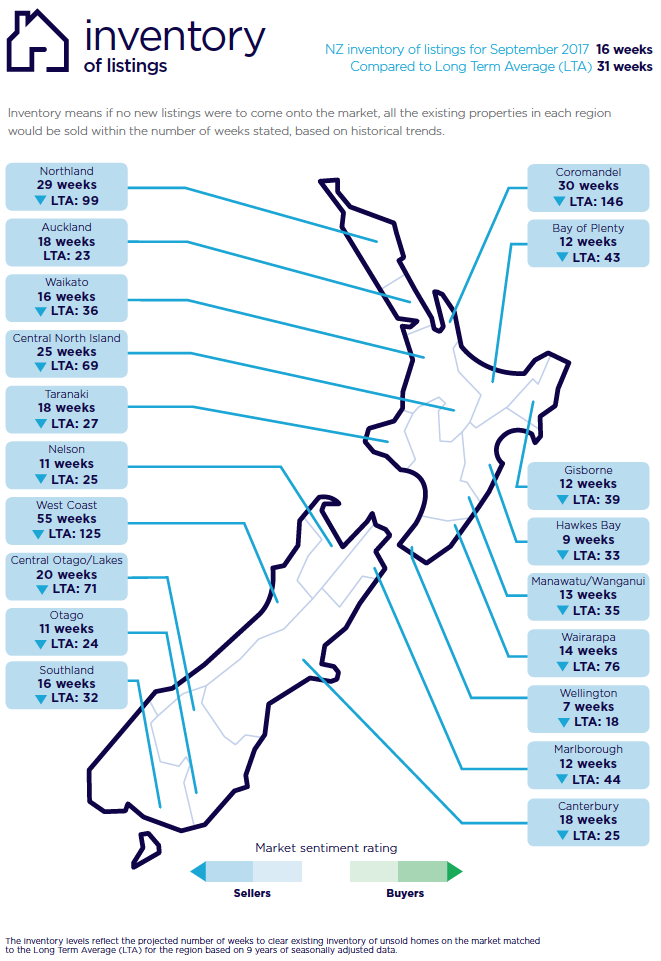
• Inventory is a measure of how long it would take, theoretically, to sell the current stock at current average rates of sale if no new properties were to be listed for sale. It provides a measure of the rate of turnover in the market.
• New listings are a record of all the new listings on realestate.co.nz for the relevant calendar month. As realestate.co.nz reflects 97 per cent of all properties listed through registered real estate agents in New Zealand, this gives a representative view of the New Zealand property market.
• Demand is the increase or decrease in the number of views per listing in that region, taken over a rolling three-month time frame, compared to the same three-month time frame the previous year – including the current month.
• Seasonal adjustment is a method realestate.co.nz uses to better represent the core underlying trend of the property market in New Zealand. This is done using methodology from the New Zealand Institute of Economic Research.
• Truncated mean is the method realestate.co.nz uses to provide statistically relevant asking prices.The top and bottom 10 per cent of listings in each area are removed before the average is calculated, to prevent exceptional listings from providing false impressions.
Share
-
.svg)
.svg)
.svg)