
.svg)


Download the New Zealand Property Report as a print-ready PDF.
Lifestyle property a potential option in a relatively static housing market
“A surge in the number of lifestyle properties listed for sale nationally offers alternative options for home owners,” says realestate.co.nz spokesperson Vanessa Taylor.
Real-time statistics from realestate.co.nz show the number of lifestyle properties for sale in February across the country is up 15% compared to the same time a year ago.
“Since 2015 we have seen Kiwis moving to regional cities which are typically more affordable than the big cities.
“We have also seen people renovate their existing homes rather than take the next step on the ladder, which can represent a significant financial leap in investment.
“Lifestyle properties have been a dream for many people and there’s significant diversity in what’s currently available,” says Vanessa.
Depending on which stage of the property cycle buyers are currently sitting in, lifestyle properties could well be another option, particularly for those wanting to get out of the cities.
The average asking price for lifestyle listings nationally sits at $998,275. In the Auckland region average asking prices are just over $1.86m.
“These are average, not the minimum prices, and there are still good options across the country,” says Vanessa Taylor.
Examples of lifestyle properties 80 kilometres from the quoted location to the region’s main city are:-
Auckland region:
Wellsford home on 10 acres (with an asking price of $875,000)
https://www.realestate.co.nz/3266924
Waikato region:
Matamata home on 1,237 sq.m, (with an asking price of $520,000)
https://www.realestate.co.nz/3236389
Wellington region:
Otaki home on 1.2 hectares, (with an asking price of $595,000)
https://www.realestate.co.nz/3241776
Canterbury region:
Amberly, contemporary home on 5.66 hectares (enquiries over $850,000).
https://www.realestate.co.nz/3266194
Otago region:
Middlemarch, Mosgiel, home & sleepout on 2979 sq.m (enquiries over $380,000)
https://www.realestate.co.nz/3240609
In November, realestate.co.nz introduced Natural Language Use Technology to its site, so visitors can search for properties just like you would on Google.
“It means site visitors can ask for a combination of tailored property attributes they would ideally like and the options will automatically come up on screen.
“Our top search term for February was ‘pool’, which is great news for those with a pool or who have room for a pool and are thinking of selling,” says Vanessa.
Asking prices across the country relatively static, but cool in the “hot” January holiday spots
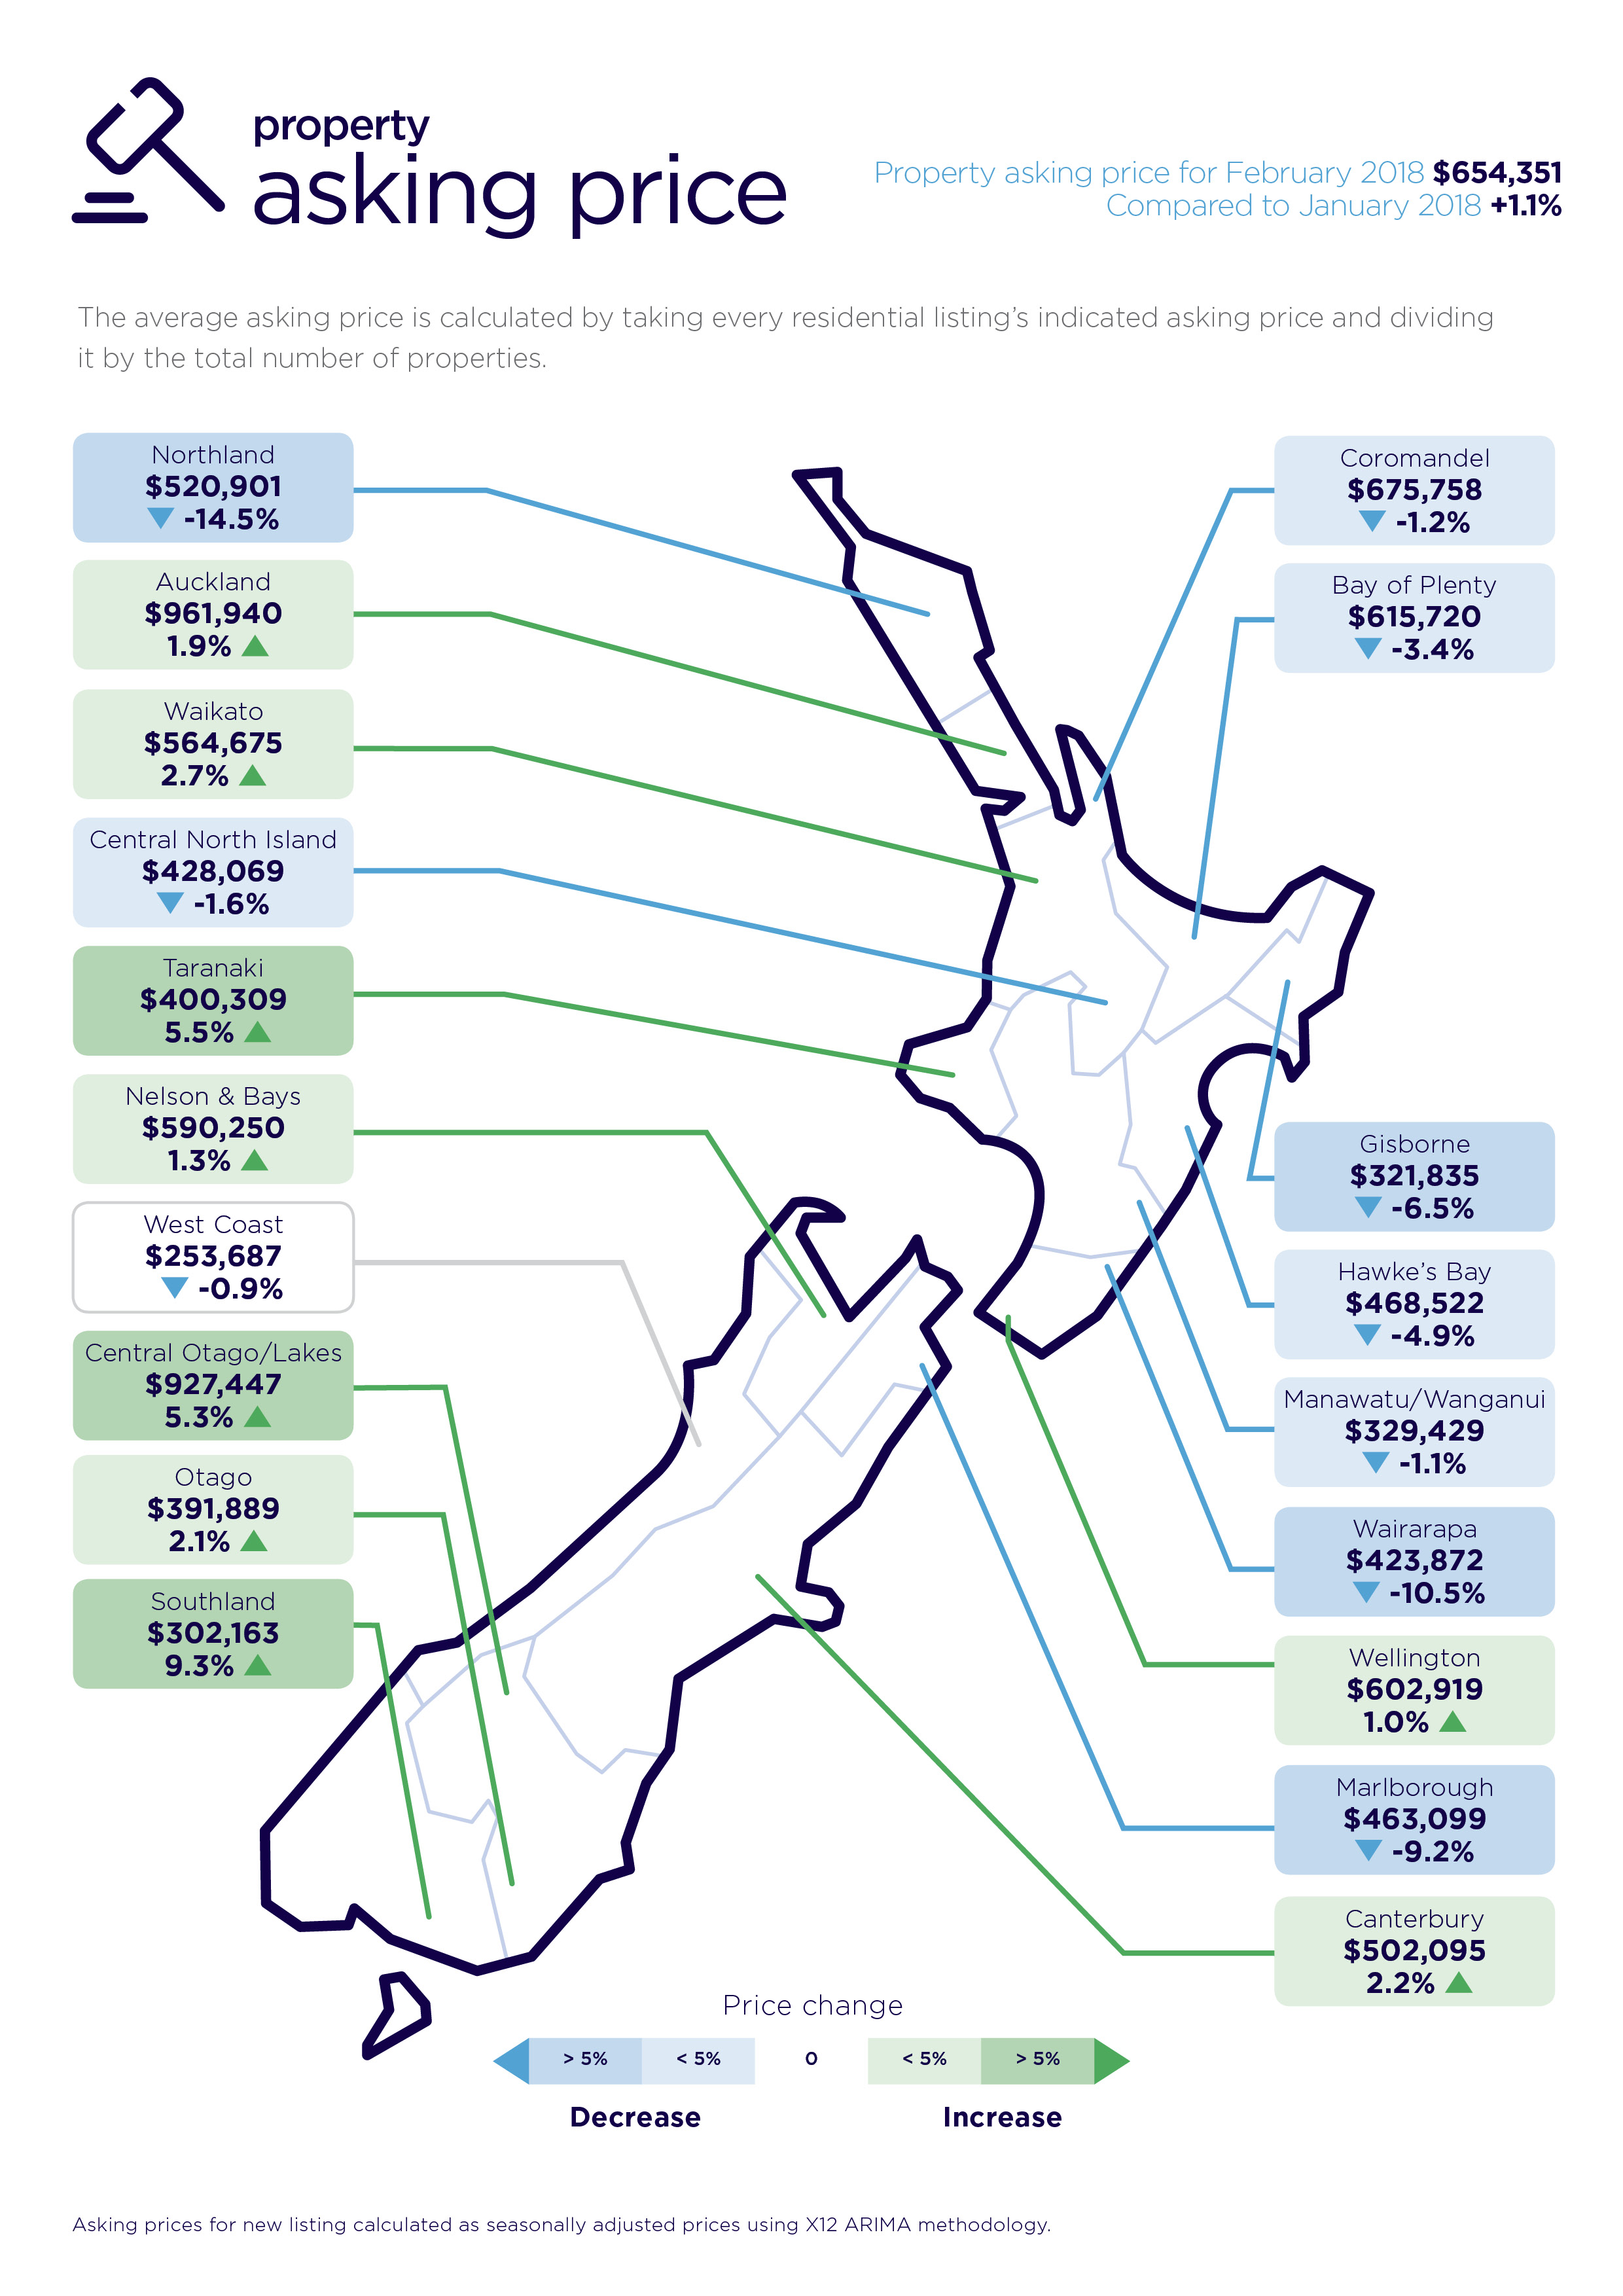
Nationally, asking prices were relatively static compared with the previous month, sitting at $654,351, representing a 1.1% increase on January.
The biggest falls in February asking prices were in the holiday hot spots which featured in realestate.co.nz’s January market report.
“The January highs in asking prices in those regions have come back as the holiday season ends,” says Vanessa Taylor.
They were:
Northland (down 14.5% to $520,901), Wairarapa (down 10.5% to $423,872), Marlborough (down 9.2% to $463,099), Gisborne (down 6.5% to $321,835), Hawke’s Bay (down 4.9% to $468,522), Bay of Plenty (down 3.4% to $615,720) and Central North Island (down 1.6% to $428,069).
In addition to the six regions above which recorded falls in February asking prices, a further two regions also recorded falls. The Coromandel region fell 1.2% to $675,758 and Manawatu-Wanganui (down 1.1% to $329,429).
By contrast, asking prices were up in all of the main regions.
The Waikato region led the asking price increase, up 2.7% to $564,675, Canterbury up 2.2% to $502,095, Otago up 2.1% to $391,889, Auckland up 1.9% to $961,940 and Wellington up 1%to $602,919.
The highest increases in asking prices across the country were from Southland (up 9.3% to $302,163), Taranaki (5.5% to $400,309) and Central Otago/Lakes (up 5.3% to $927,447).
NB: The data was collated on the penultimate day of the month.
Glossary of terms
Being the only provider of real estate data in real time, realestate.co.nz offers valuable property market information not available from other sources.
• Average asking price gives an indication of current market sentiment. Statistically, asking prices tend to correlate closely with the sales prices recorded in future months when those properties are sold. As it looks at different data, average asking prices may differ from recorded sales data released at the same time.
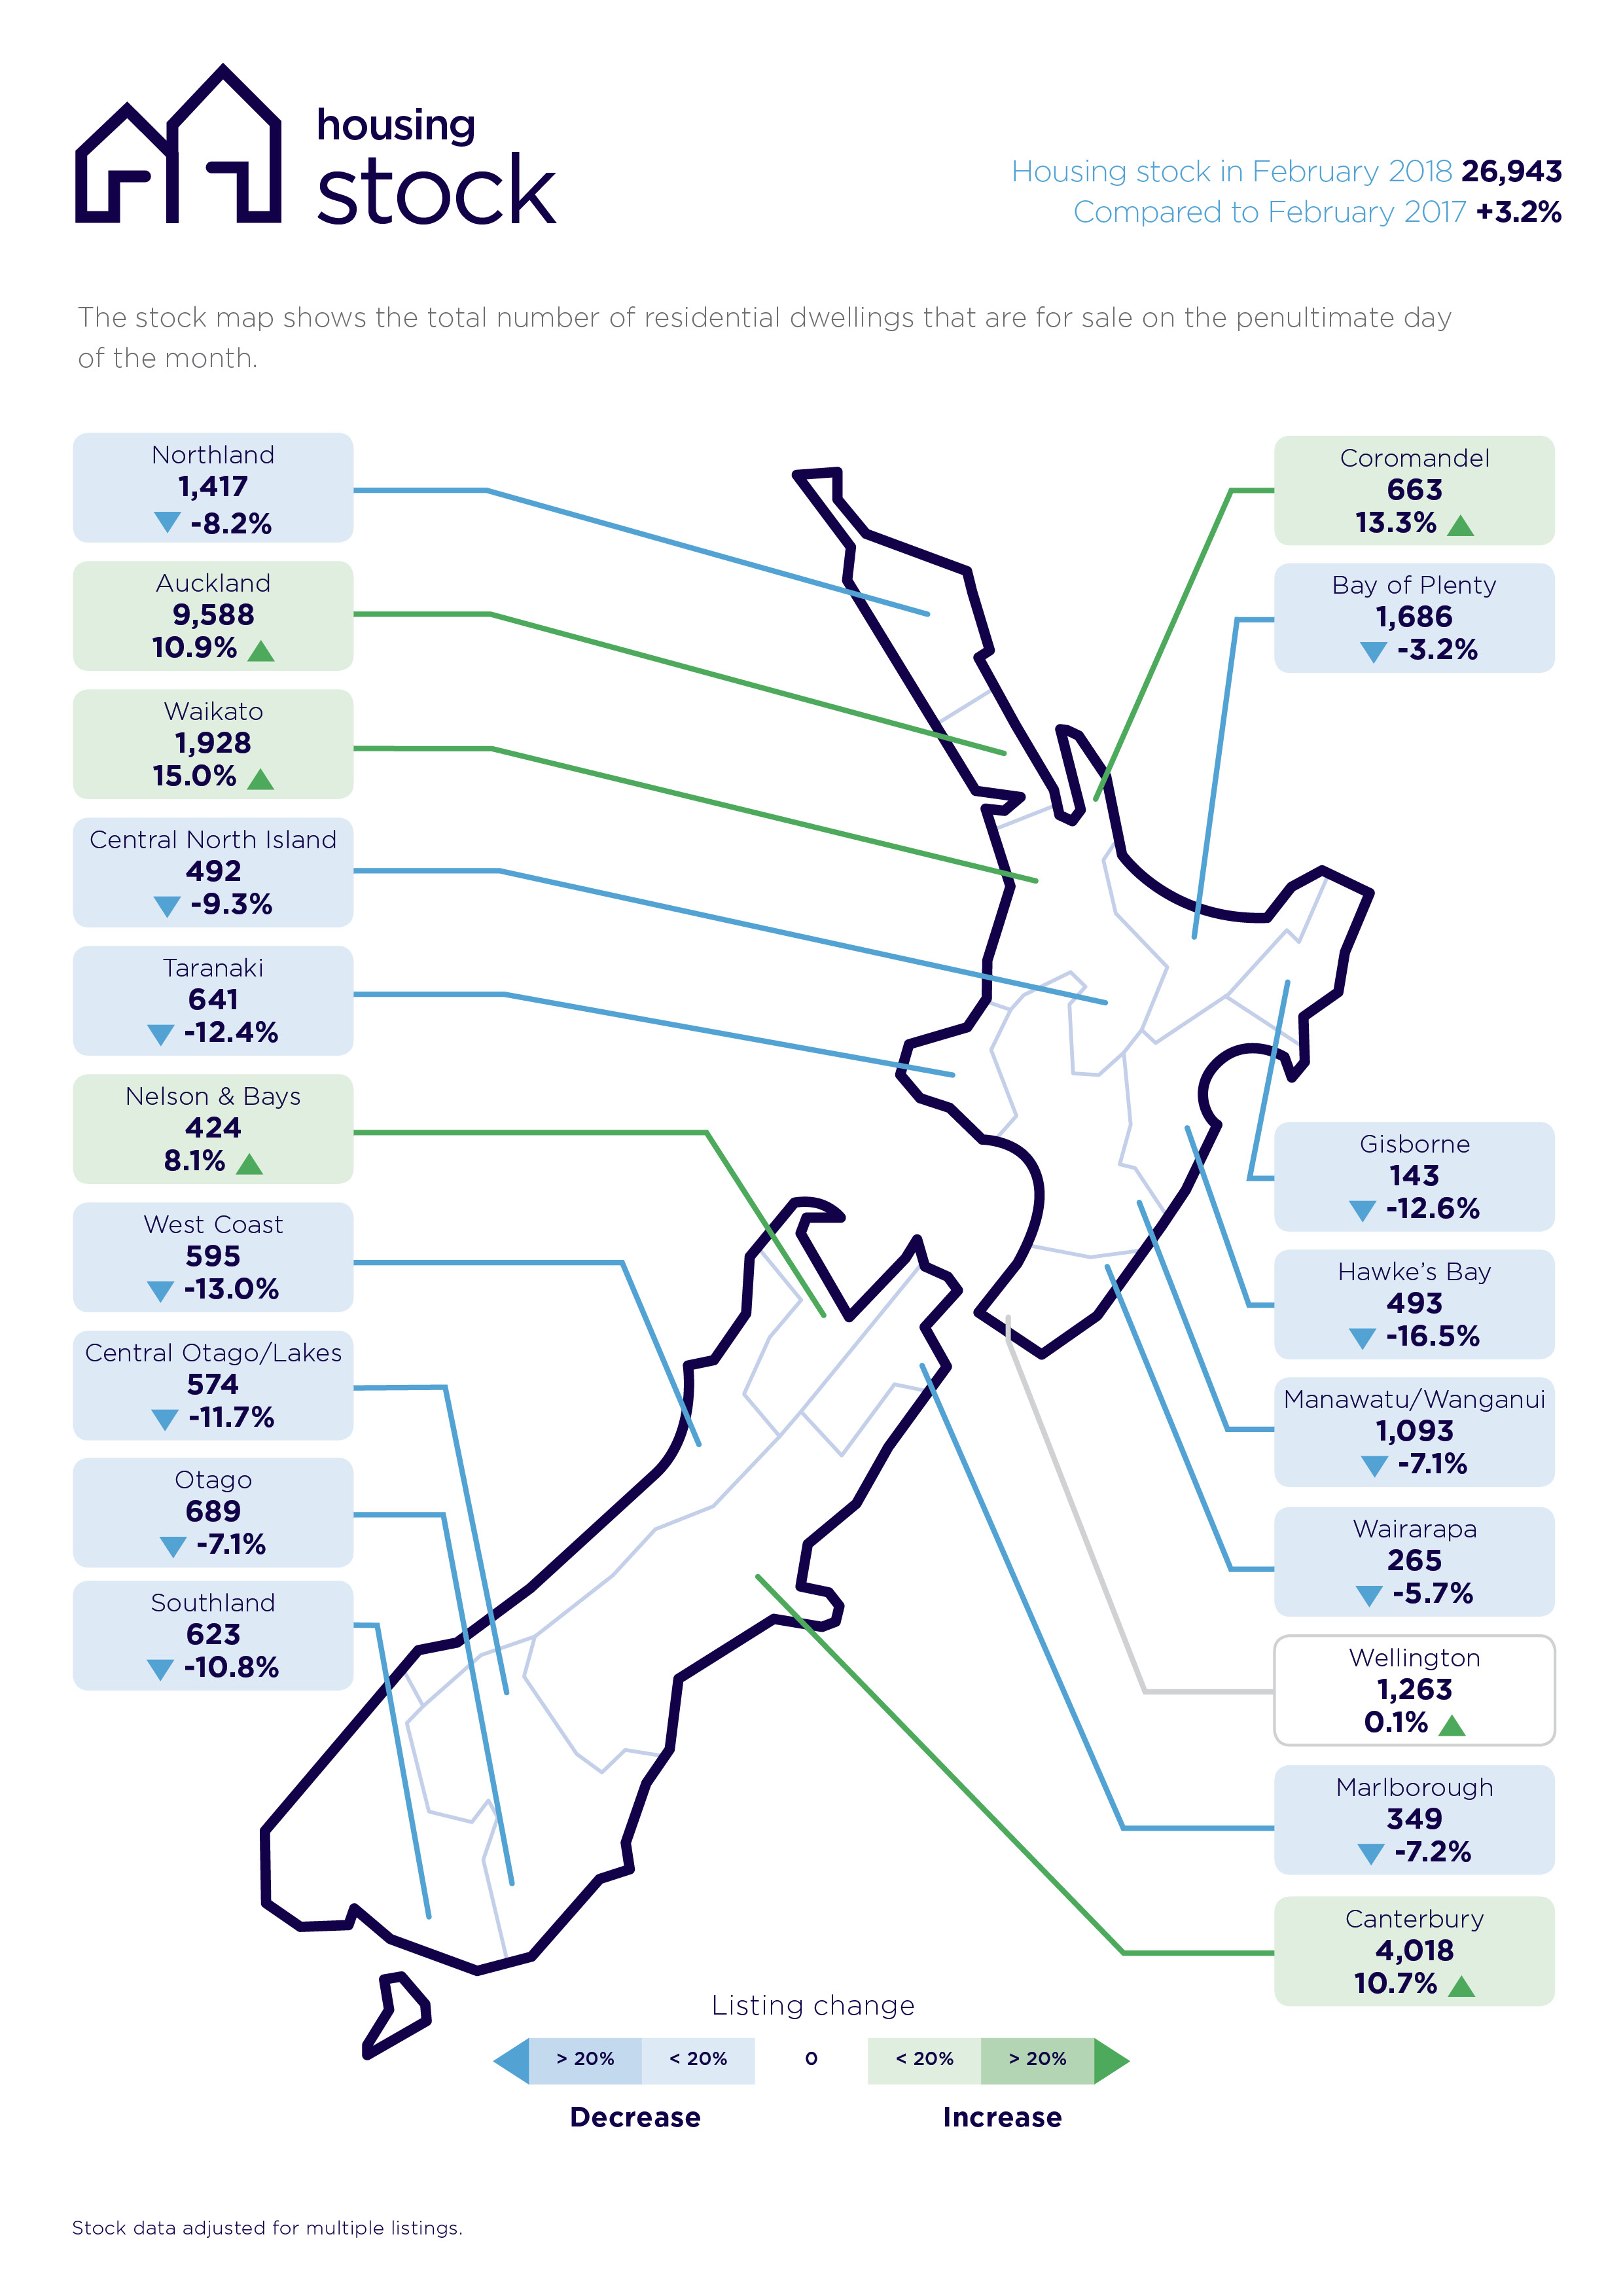
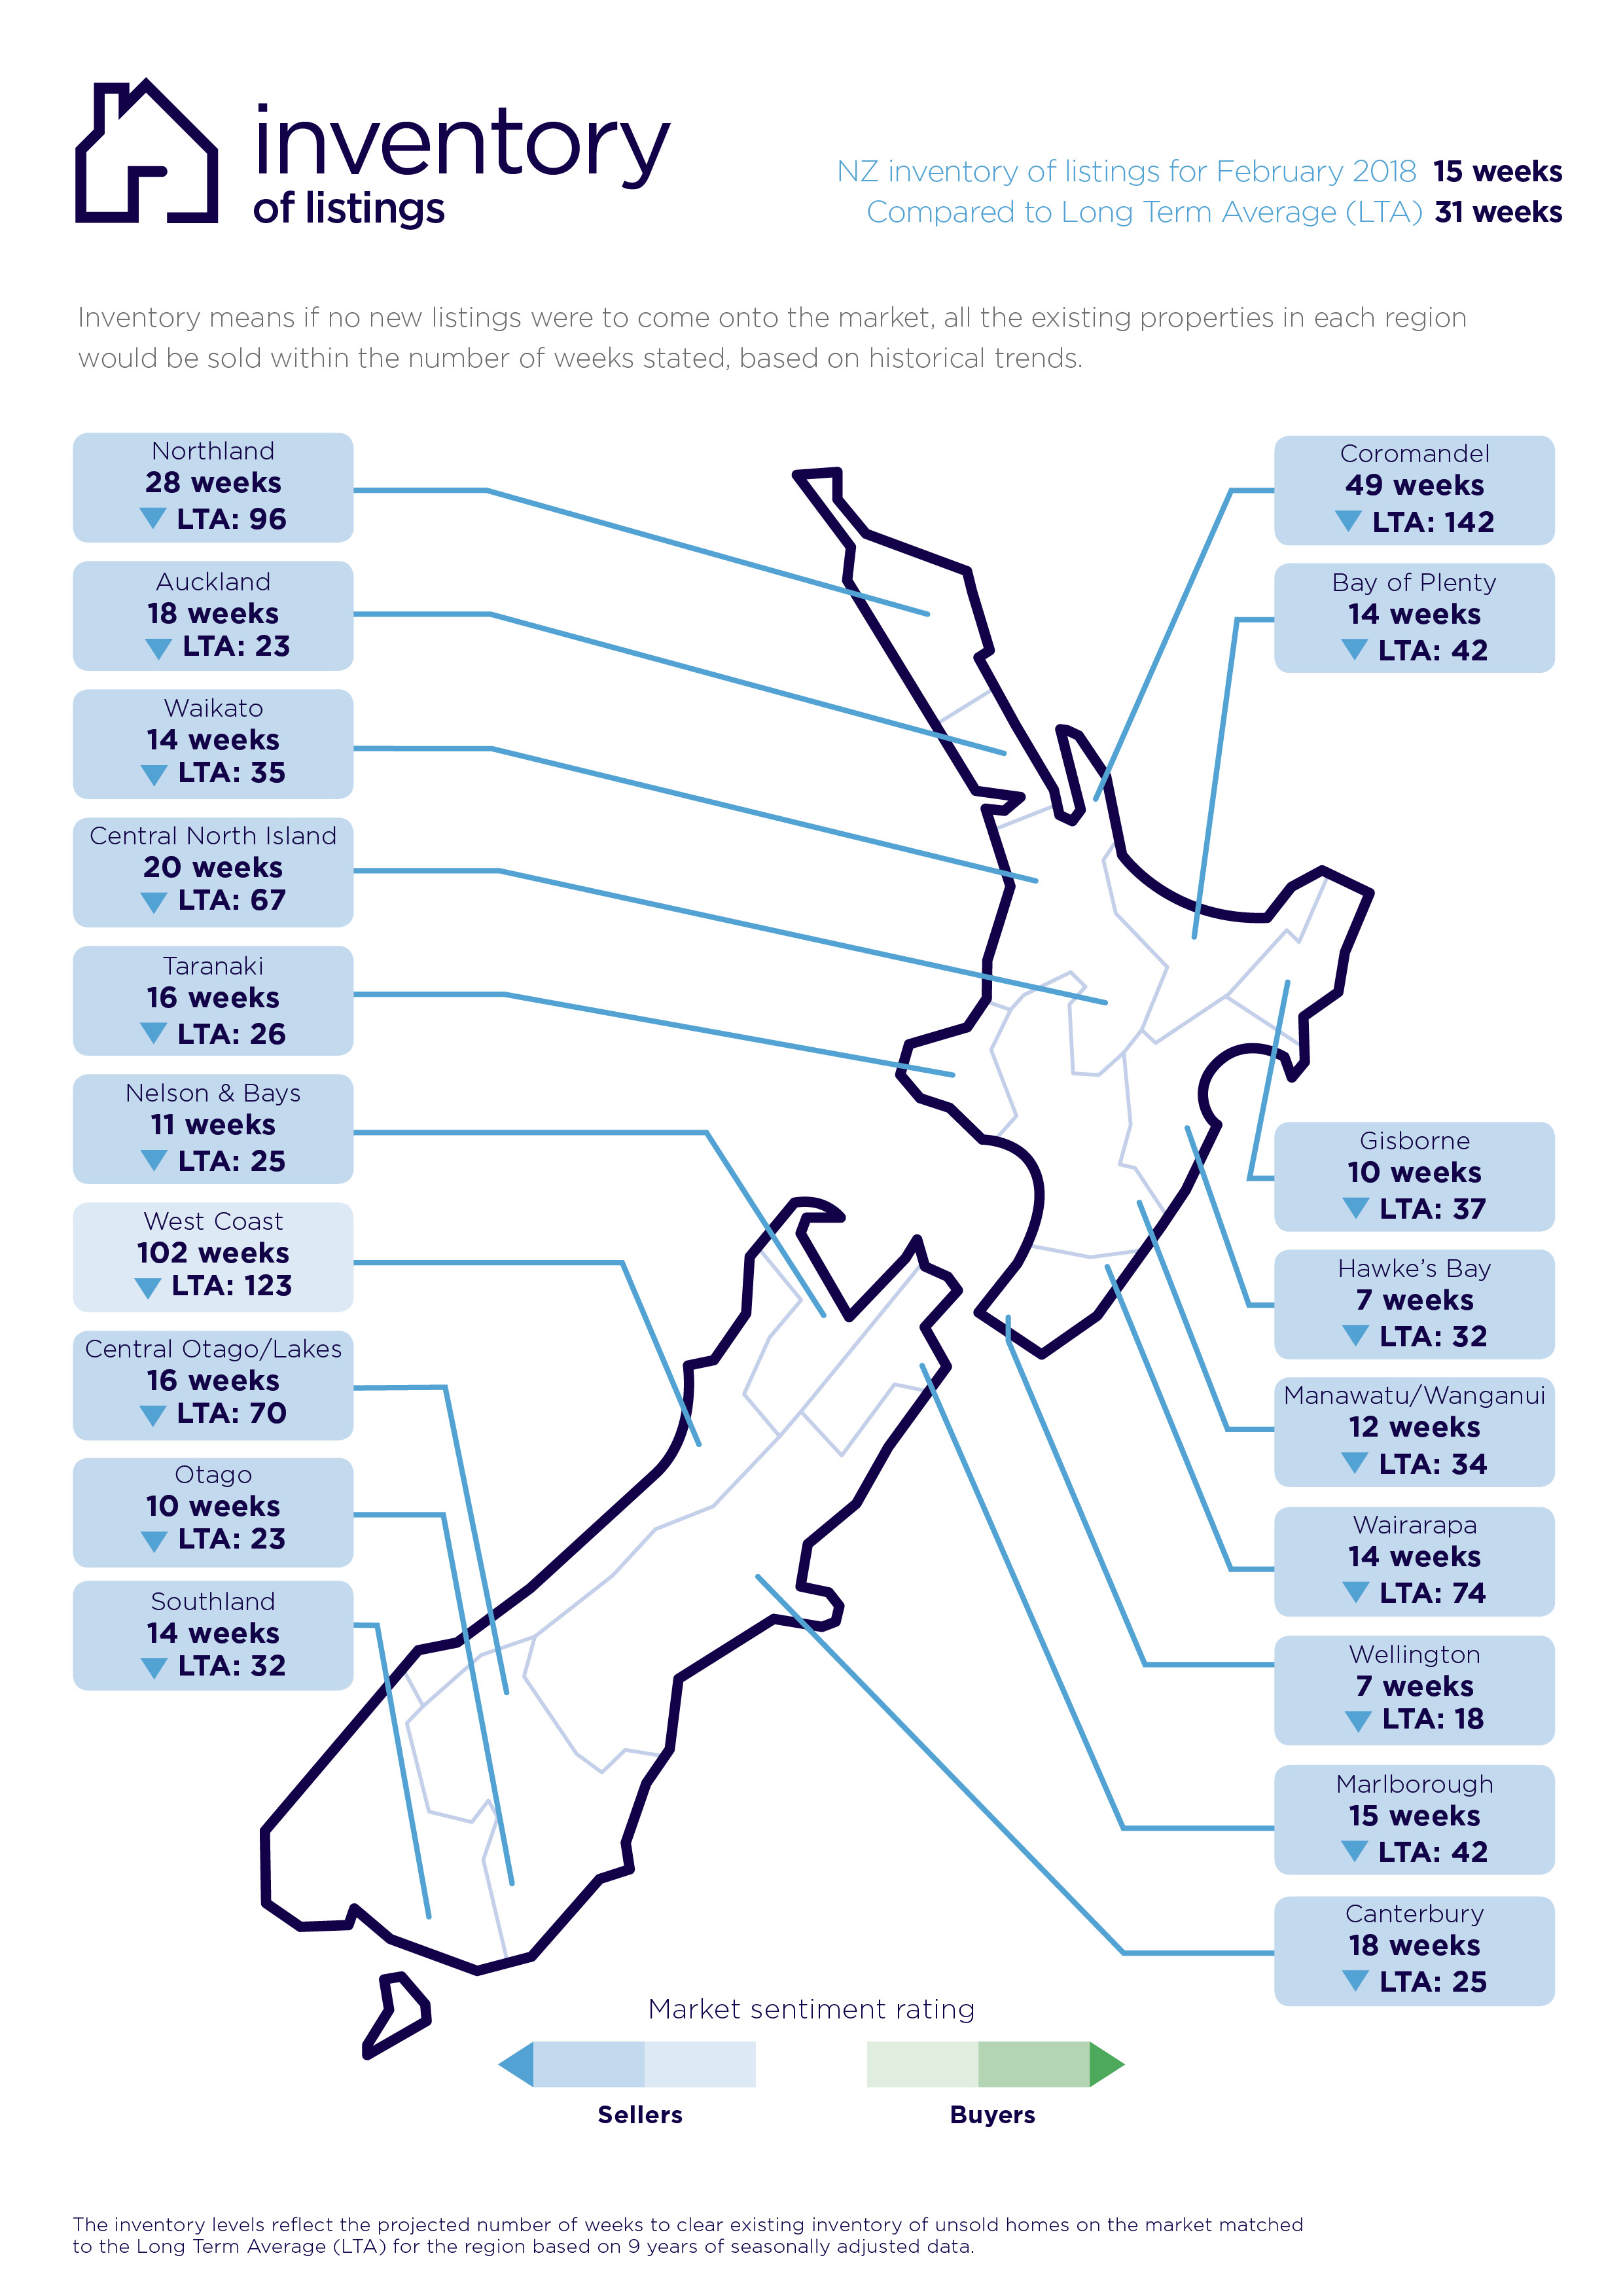
• Inventory is a measure of how long it would take, theoretically, to sell the current stock
at current average rates of sale if no new properties were to be listed for sale. It provides a measure of the rate of turnover in the market.
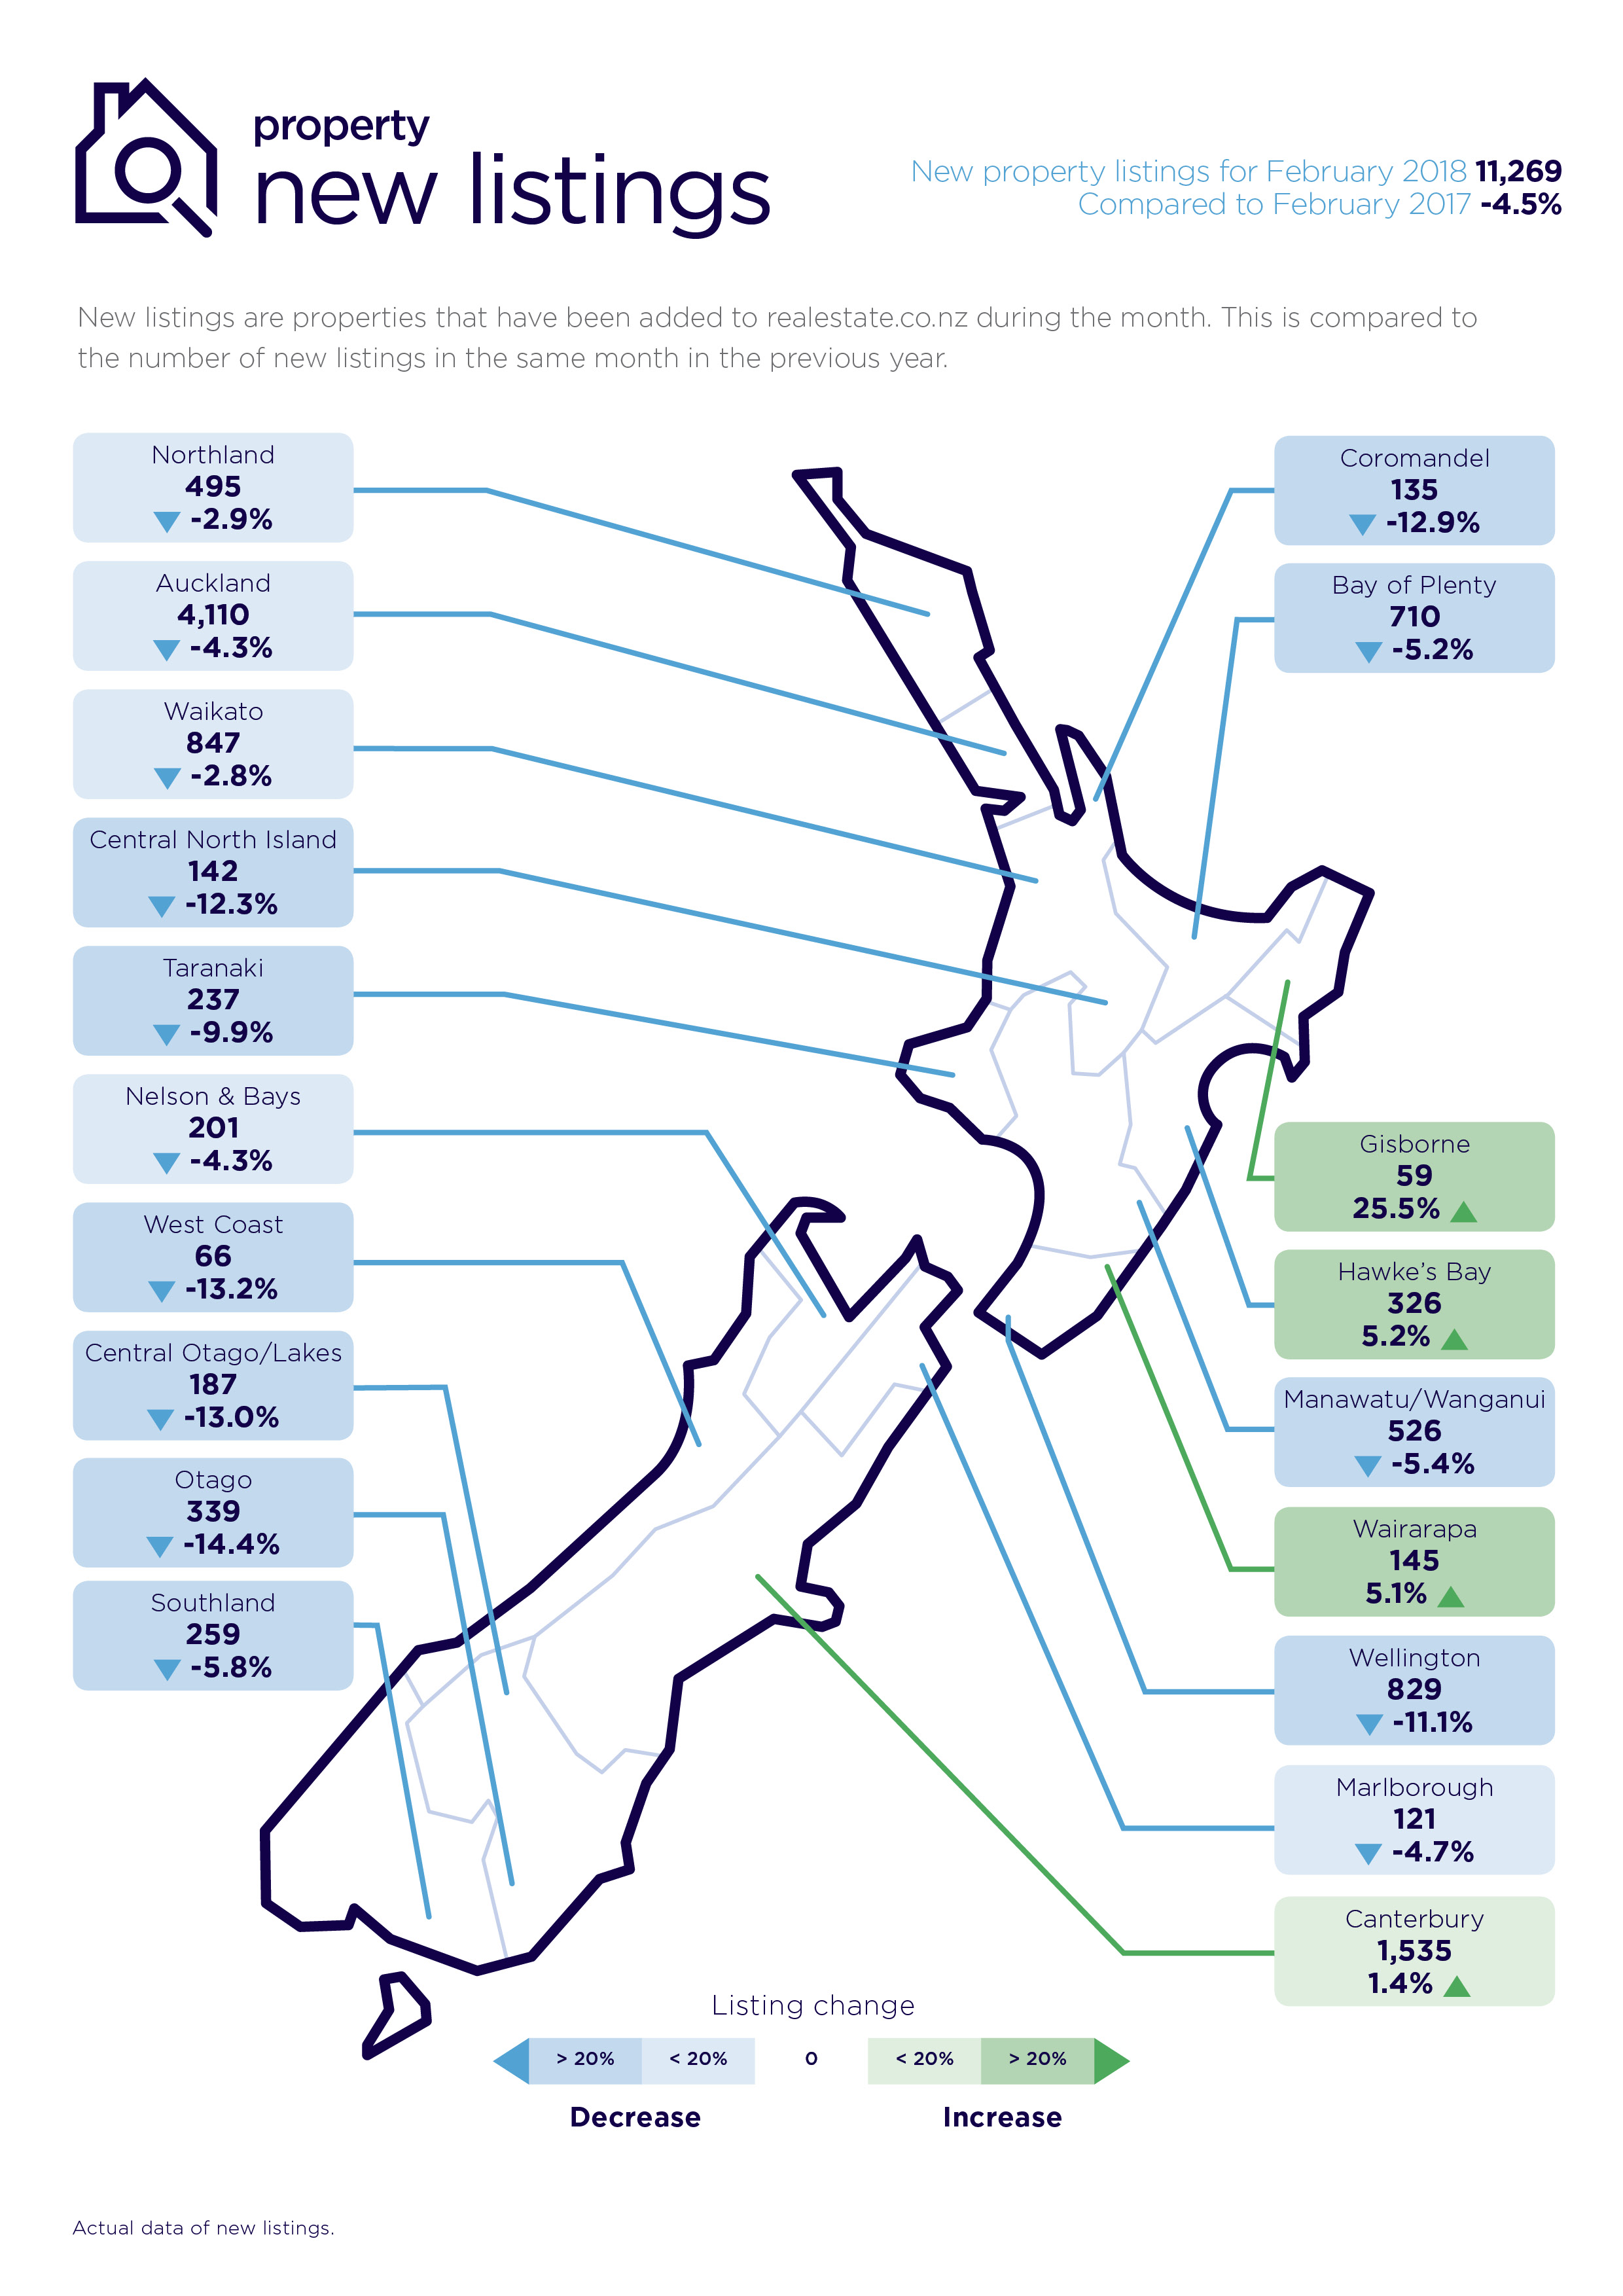
• New listings are a record of all the new listings on realestate.co.nz for the relevant calendar month. As realestate.co.nz reflects 97% of all properties listed through registered estate agents in New Zealand, this gives a representative view of the New Zealand property market.
• Demand: the increase or decrease in the number of views per listing in that region, taken over a rolling three-month time frame, compared to the same three-month time frame the previous year – including the current month.
• Seasonal adjustment is a method realestate.co.nz uses to better represent the core underlying trend of the property market in New Zealand. This is done using methodology from the New Zealand Institute of Economic Research.
• Truncated mean is the method realestate.co.nz uses to provide statistically relevant asking prices. The top and bottom 10% of listings in each area are removed before the average is calculated, to prevent exceptional listings from providing false impressions.
For media enquiries, please contact:
Kate Carter, PPR
T: +64 21 514 004 E: kate.carter@ppr.co.nz
Share
-
.svg)
.svg)
.svg)