Real time data shows dramatic variances in demand across country
New property listings fall 17.5 per cent nationally
The New Zealand housing market is showing significant regional variances in the lead up to the general election. Nationally, there has been a fall in new listings, static asking prices and muted demand* in August.
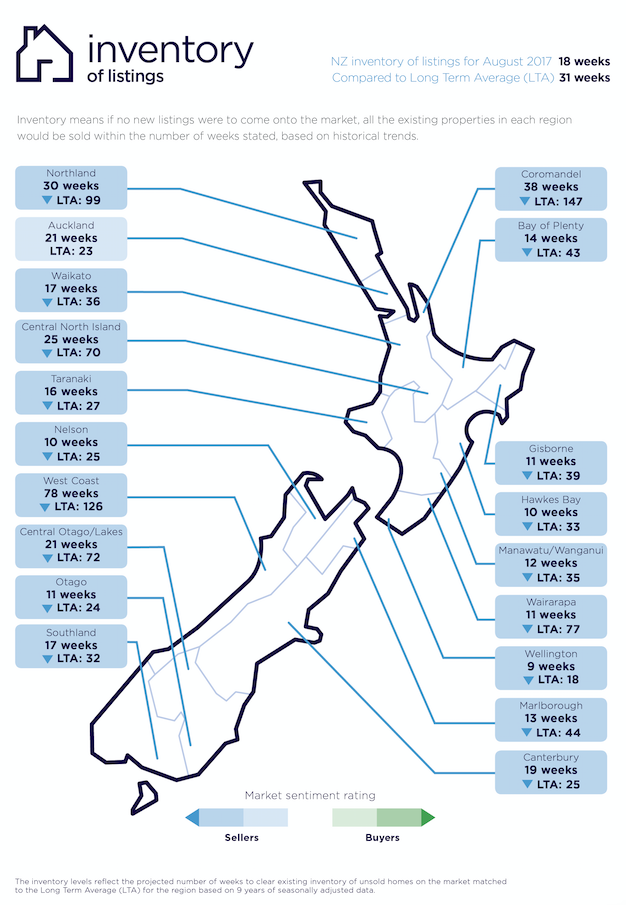
“With inventory and demand both low, we are currently in a relatively stable price environment,” says realestate.co.nz spokesperson Vanessa Taylor.
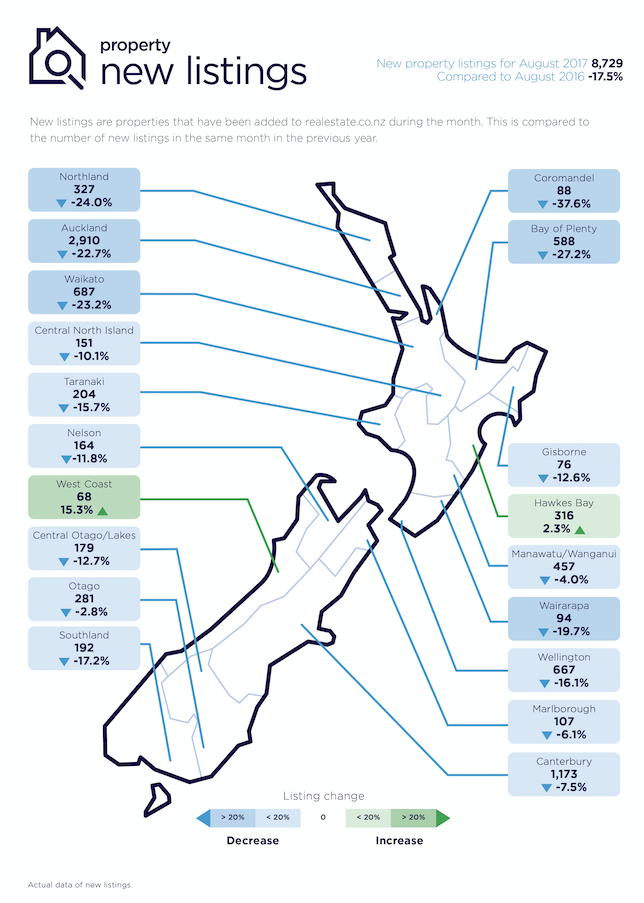
Real time statistics from realestate.co.nz show that nationally new property listings were down 17.5 per cent.
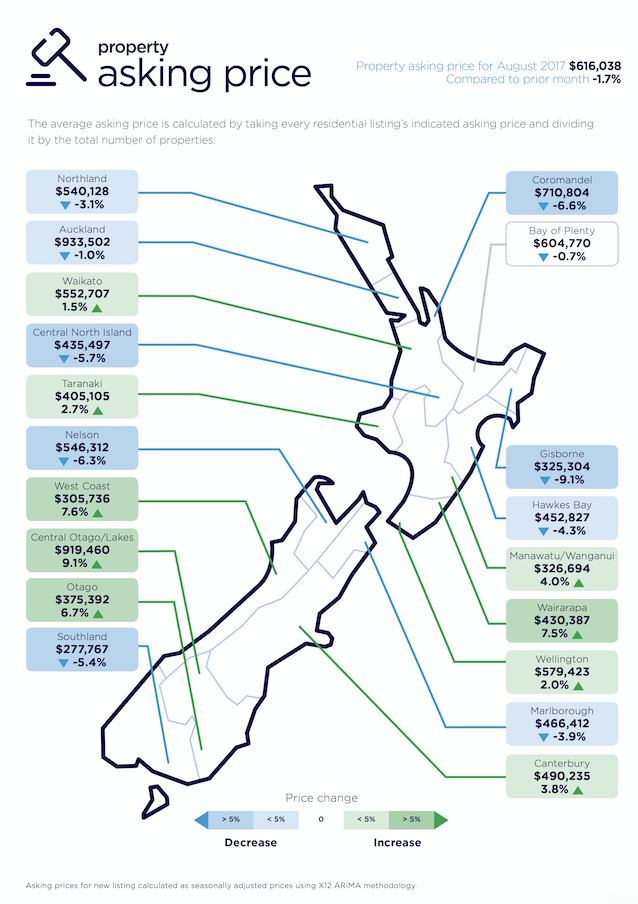
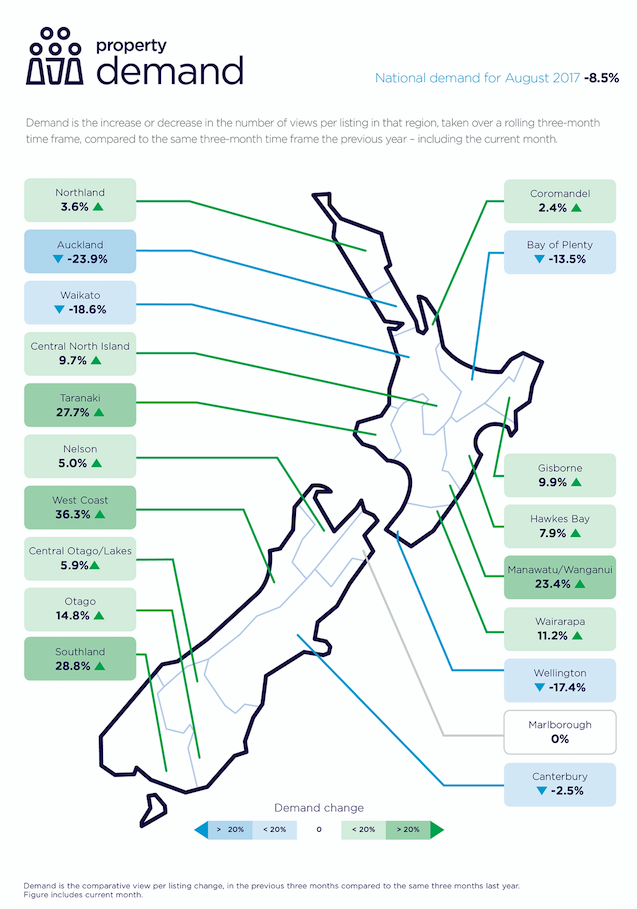
Average asking prices were down 1.7 per cent nationally (compared with the previous month), while demand was down 8.5 per cent.

New property listings fall 17.5 per cent nationally, with upper North Island hardest hit
Statistics from realestate.co.nz show that the number of new property listings in August fell 17.5 per cent nationally compared to the same month last year. All regions were impacted except for Hawkes Bay and the West Coast which both increased.
Only 8,729 new listings were registered across the country during August.
The upper half of the North Island saw the most dramatic falls in new listings compared to the same period last year, with Auckland down 22.7 per cent, Waikato 23.2 per cent, Northland 24.0 per cent and Coromandel 37.6 per cent.

Asking prices fall in Auckland region, interest falters
“The Auckland market appears to have lost its shine when it comes to potential buyer interest and asking prices have fallen,” says Vanessa Taylor.
Property asking prices fell one per cent in August to $933,502 compared to July 2017. The last time average Auckland asking prices were at this level was September 2016 when it stood at $933,435. In June 2017, there was an anomaly drop when we saw an influx of 800 apartments come onto the market, impacting on the overall average asking price.
Of the 19 regions, demand for Auckland property sat at -23.9 per cent, placing the country’s largest city at the bottom of the table.
The Auckland region also registered a 22.7 per cent fall in the number of new property listings compared to August 2016.

Asking prices “all-time highs” in five regions
In contrast to Auckland, asking prices in August were at all-time highs in five other regions across the country – namely Waikato, Wellington, Taranaki, Central Otago Lakes and the Wairarapa
Waikato:
“The Waikato region paints an interesting picture,” says Vanessa Taylor
“The record average asking price of $552,707 is offset by a 23.2 per cent fall in the number of new property listings compared to the same period last year, so it could be assumed that asking prices may be impacted by supply and demand pressures,” she says.
However, interest in the region (as recorded by demand) is relatively low. The Waikato region is second to bottom (above Auckland) when it comes to interest from across the country (-18.61 per cent).
Taranaki:
The Taranaki region recorded a record asking price in August of $405,105 and was also in the top three regions in terms of demand up 27.73 per cent
Wellington and Wairarapa:
Close neighbours, the Wairarapa and Wellington regions both recorded asking price highs, but painted a different picture when it came to demand
The Wellington region’s asking price was up two per cent to $579,243, but sat at third lowest on the demand table (above the Waikato and Auckland regions)
By contrast in the Wairarapa the average asking price was up 7.5 per cent to $430,387, while demand was also up 11.2 per cent placing it sixth of the 19 regions across the country
Central Otago/Lakes:
For the first time in history, the Central Otago/Lakes District broke the $900k mark in asking prices, recording a significant lift (up 9.1 per cent) from the previous month. This takes the average asking price in the region to $919,460, snapping closely at the heels of the Auckland region
In terms of demand, the Central Otago/Lakes District just made the Top 10 list, with a 5.9 per cent increase
*Demand: the increase or decrease in the number of views per listing in that region, taken over a rolling three-month time frame, compared to the same three-month time frame the previous year – including the current month.

Glossary of terms
Being the only provider of real estate data in real time, realestate.co.nz offers valuable property market information not available from other sources
• Average asking price gives an indication of current market sentiment. Statistically, asking prices tend to correlate closely with the sales prices recorded in future months when those properties are sold. As it looks at different data, average asking prices may differ from recorded sales data released at the same time.
• Inventory is a measure of how long it would take, theoretically, to sell the current stock at current average rates of sale if no new properties were to be listed for sale. It provides a measure of the rate of turnover in the market.
• New listings are a record of all the new listings on realestate.co.nz for the relevant calendar month. As realestate.co.nz reflects 97 per cent of all properties listed through registered real estate agents in New Zealand, this gives a representative view of the New Zealand property market.
• Demand: the increase or decrease in the number of views per listing in that region, taken over a rolling three-month time frame, compared to the same three-month time frame the previous year – including the current month.
• Seasonal adjustment is a method realestate.co.nz uses to better represent the core underlying trend of the property market in New Zealand. This is done using methodology from the New Zealand Institute of Economic Research.
• Truncated mean is the method realestate.co.nz uses to provide statistically relevant asking prices. The top and bottom 10 per cent of listings in each area are removed before the average is calculated, to prevent exceptional listings from providing false impressions.
05 Sep 2017

