
.svg)


Download the New Zealand Property Report as a print-ready PDF.
Pressure builds on housing stock over the next 12 months, with research showing home buyers intend to get more active, but sellers are less likely to go to market.
There are many more buyers than sellers intending to be active in the New Zealand property market in the next 12 months.
This was a major finding in research released today by realestate.co.nz, the country’s largest property listing site with the most residential listings for sale.
Commissioned by realestate.co.nz, the Horizon Research survey* examined buyer and seller intention to participate in the property market in the near future.
The research results show that 6.4% of the adults 18 years or over surveyed are definitely looking to buy in the next 12 months, but only 2.8% of people stated they are definitely looking to sell in that same period, says realestate.co.nz spokesperson Vanessa Taylor.
This equates to a shortage of around 3.6% of homes across the New Zealand marketplace, representing a significant number of properties currently not on the market, she says.
“Even taking into account new builds which are underway and not included in these numbers, there will be an increasingly serious shortage of properties for keen buyers.”
“Not surprisingly, the biggest pressure is evident in Auckland,” says Vanessa.
The research shows that in the Auckland Council (super city) catchment, those who said they were definitely looking to buy lifted to 9.5% (from 6.% in November 2017). However, those who intended to sell fell from 4.3% to 2.6% in the same period.
“This represents a widening gap between definite buyers and definite sellers.
“In November the shortfall between definite buyers and definite sellers represented around 9,000 homes.
“With more buyers saying they want to get into the market, the shortfall in the number of homes that would be required to meet that stated demand has widened to around 32,700,” says Vanessa.
Of the six local government areas identified in the Horizon Research survey, only Tauranga City had more sellers (3.9%) than buyers (1.0%) intending to be active in the next 12 months.
In Christchurch City there was a significant gap between buyer and seller intention, with 15.5% definitely looking to buy in the next 12 months and 4.0% definitely looking to sell.
The national real estate market is currently stable
The research from Horizon shows the buying and selling intentions of New Zealanders in the next 12 months. Real time statistics from realestate.co.nz show the current market nationally is relatively stable, says Vanessa Taylor.
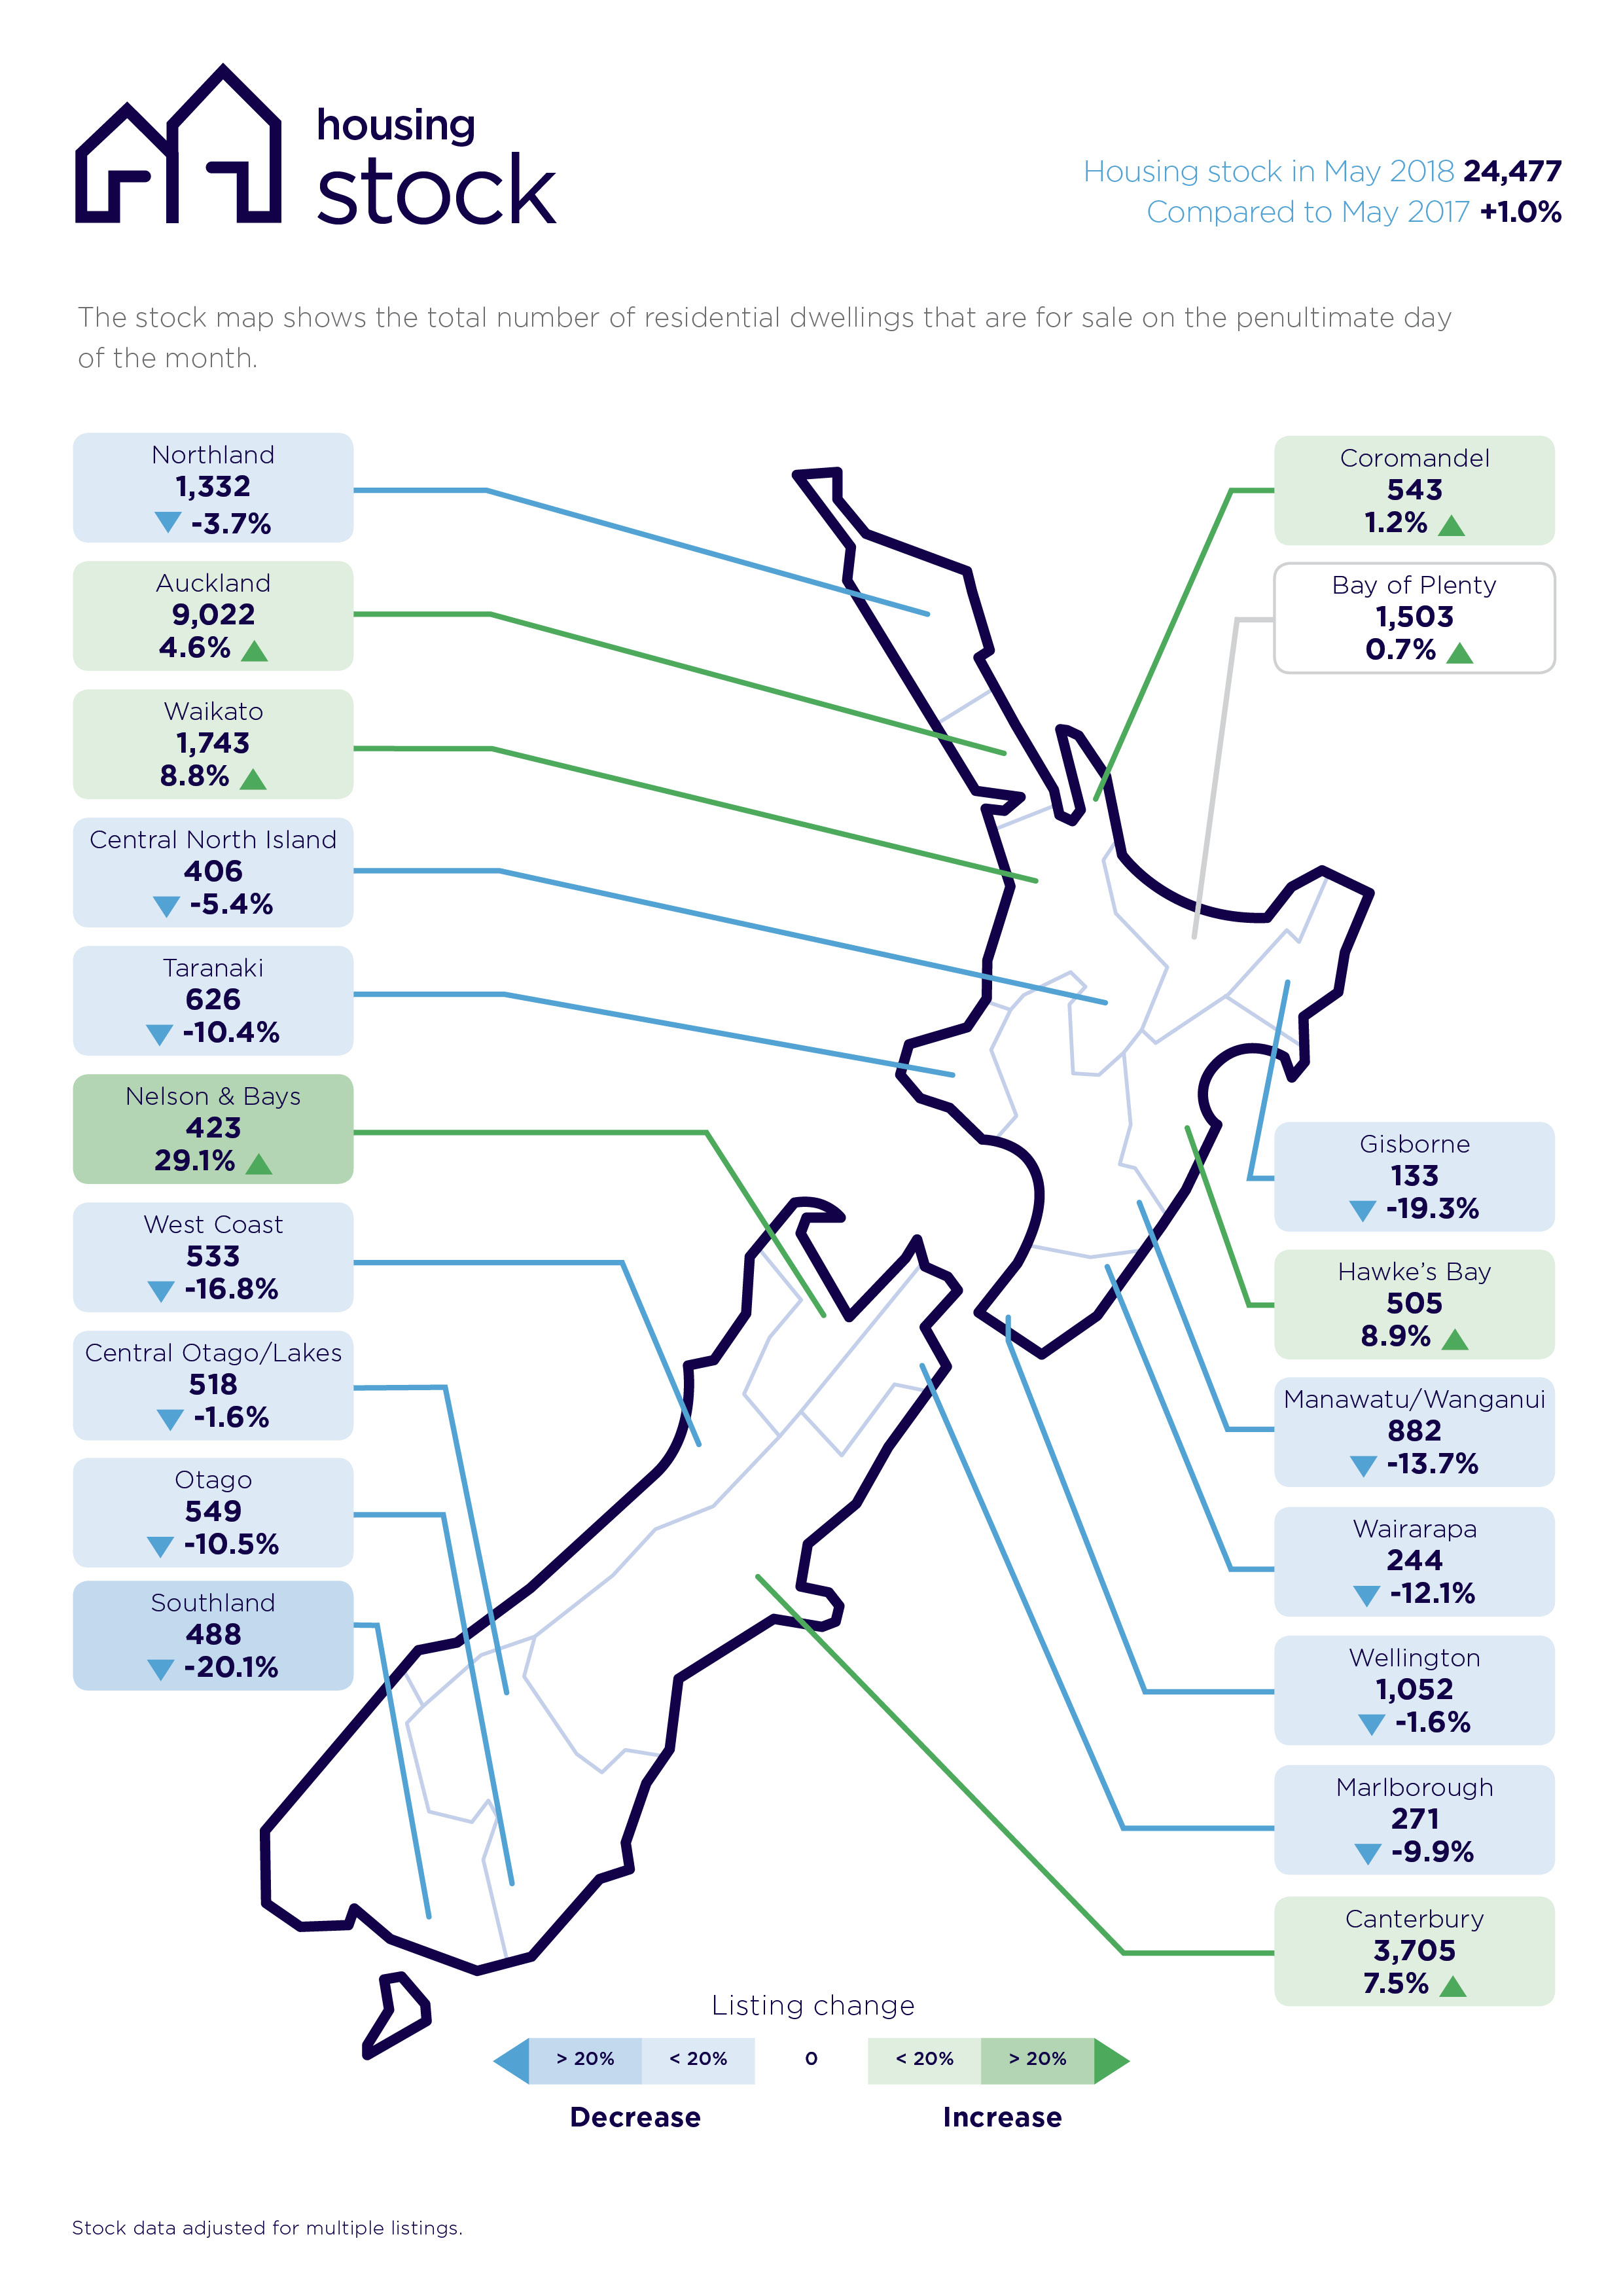
New listings are slightly down compared to May 2017 (a 0.3% decrease) and overall, total housing stock is marginally up 1% (24,477) compared to May 2017.
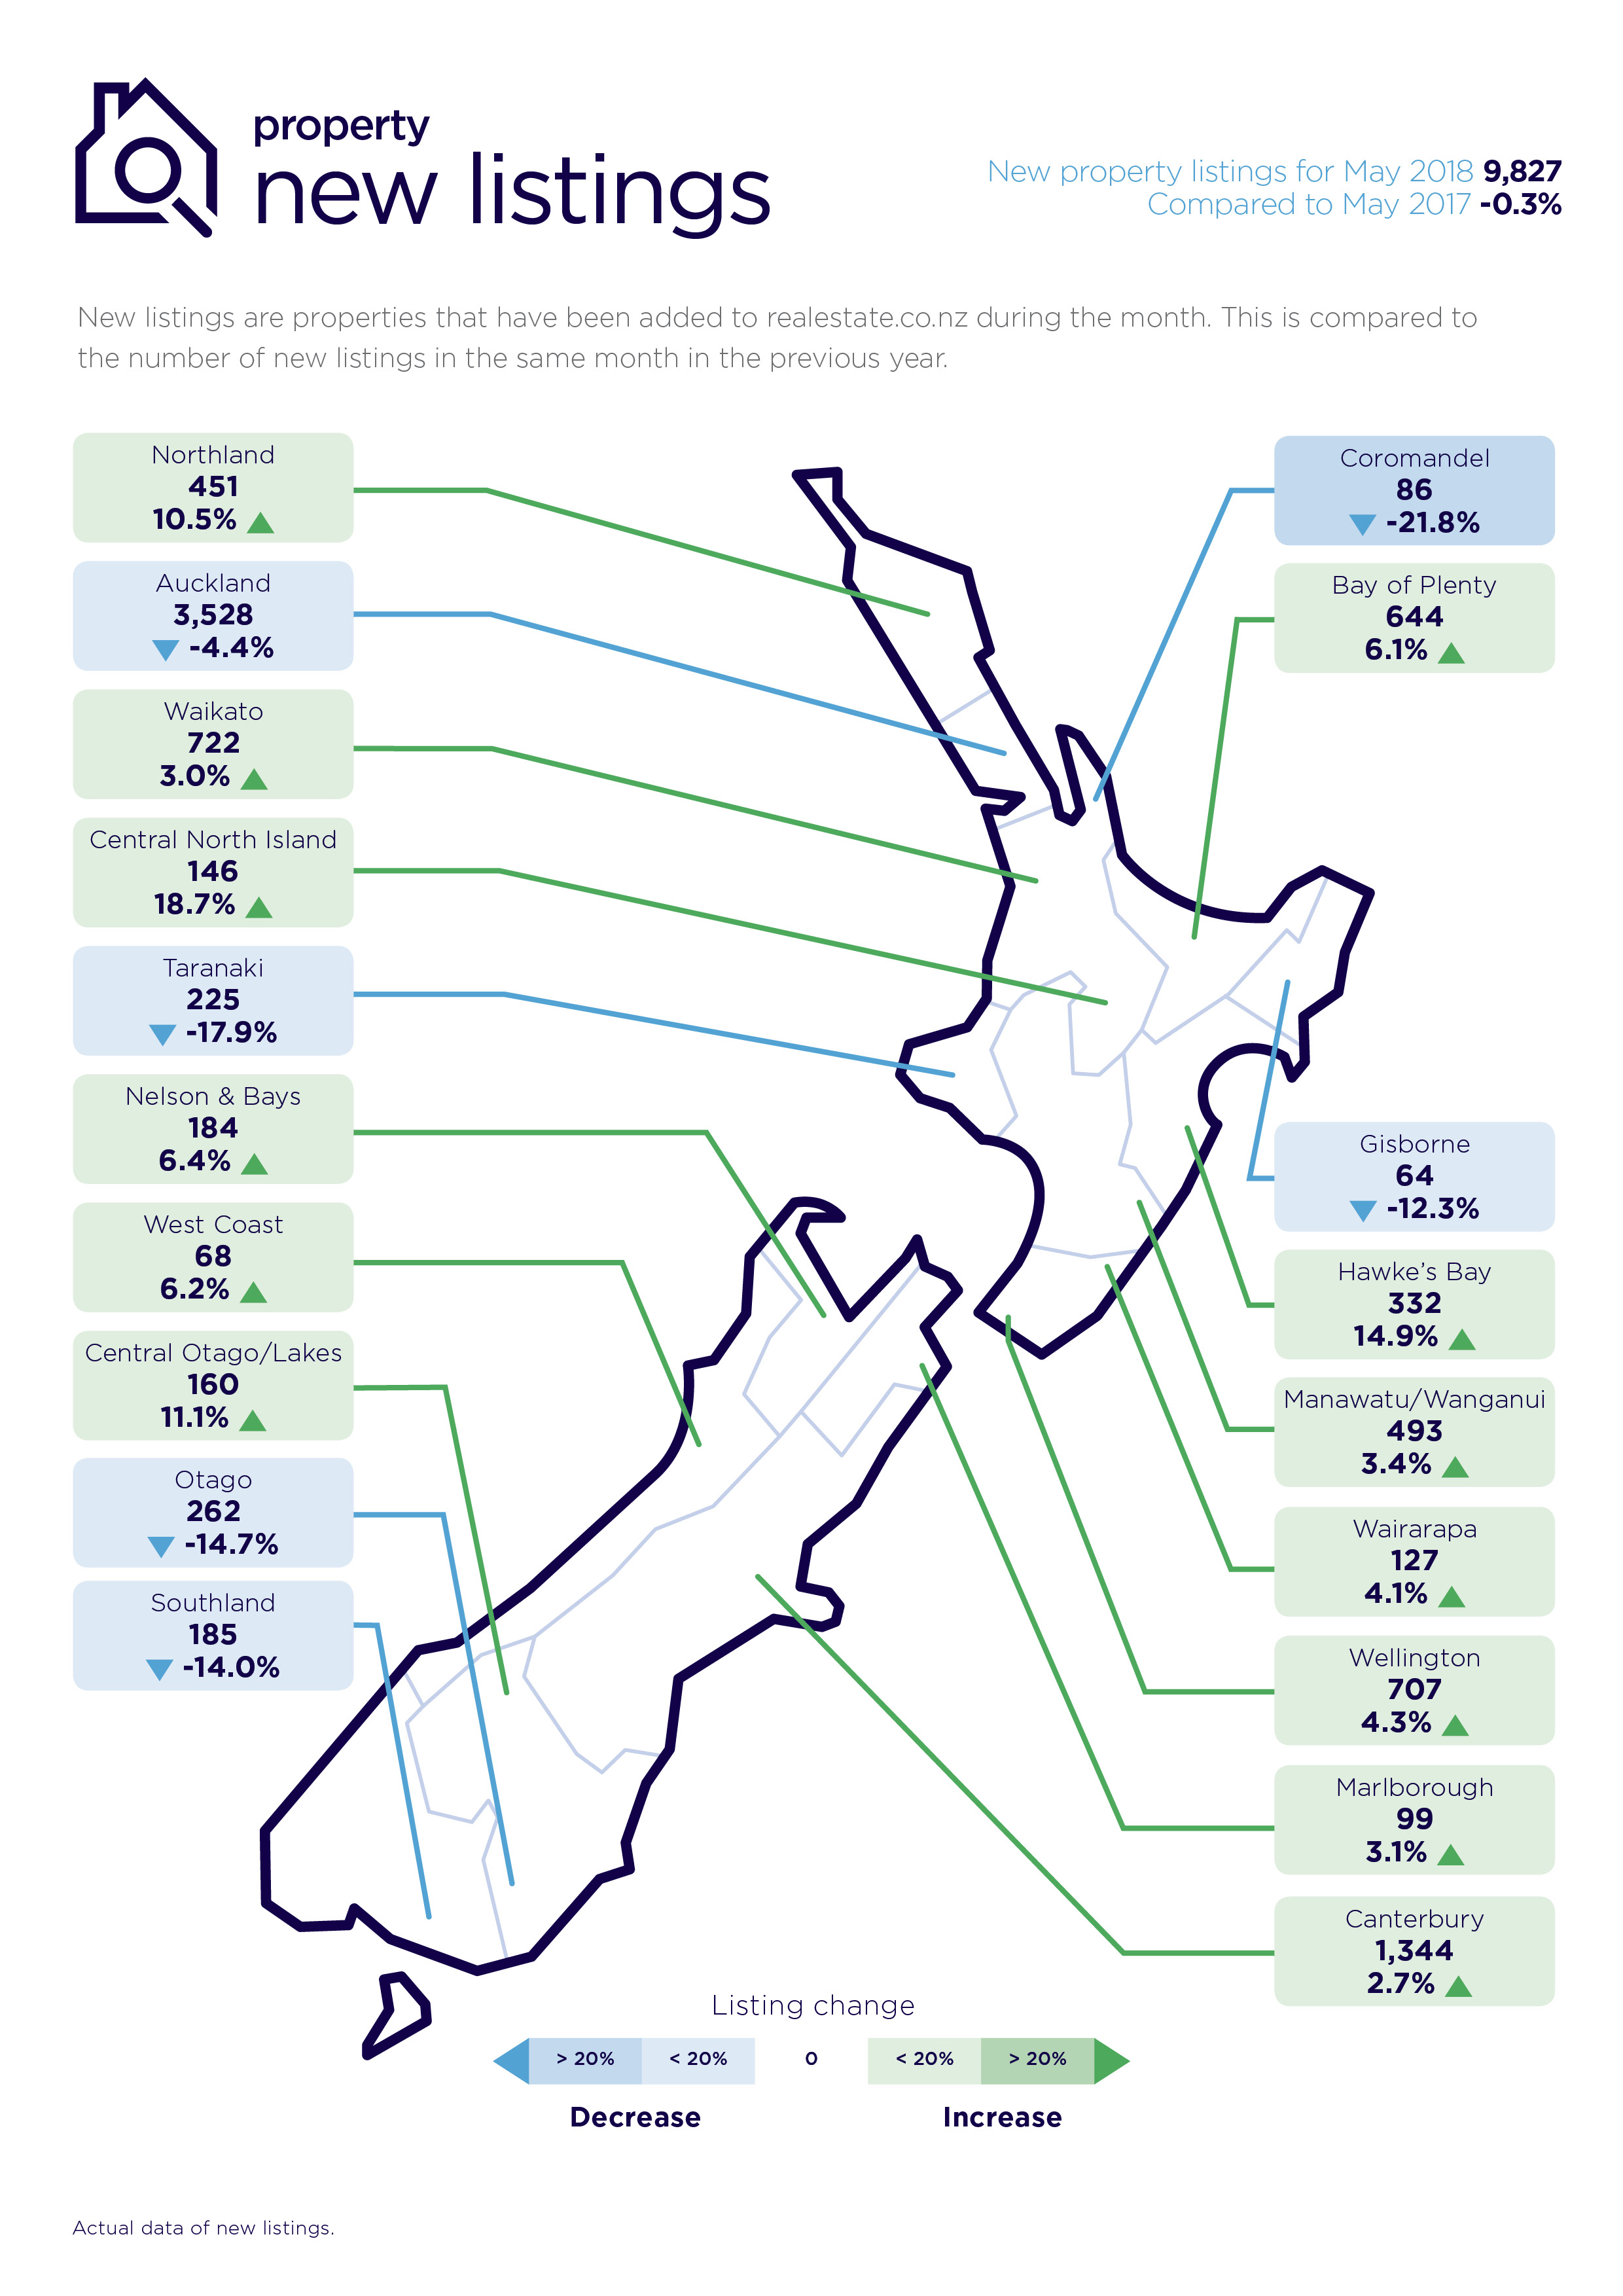
The Auckland region pulled down the overall national number of new listings with a 4.4% fall compared with the same period last year, but this was balanced by a lift in new listings in 13 of the 19 regions.
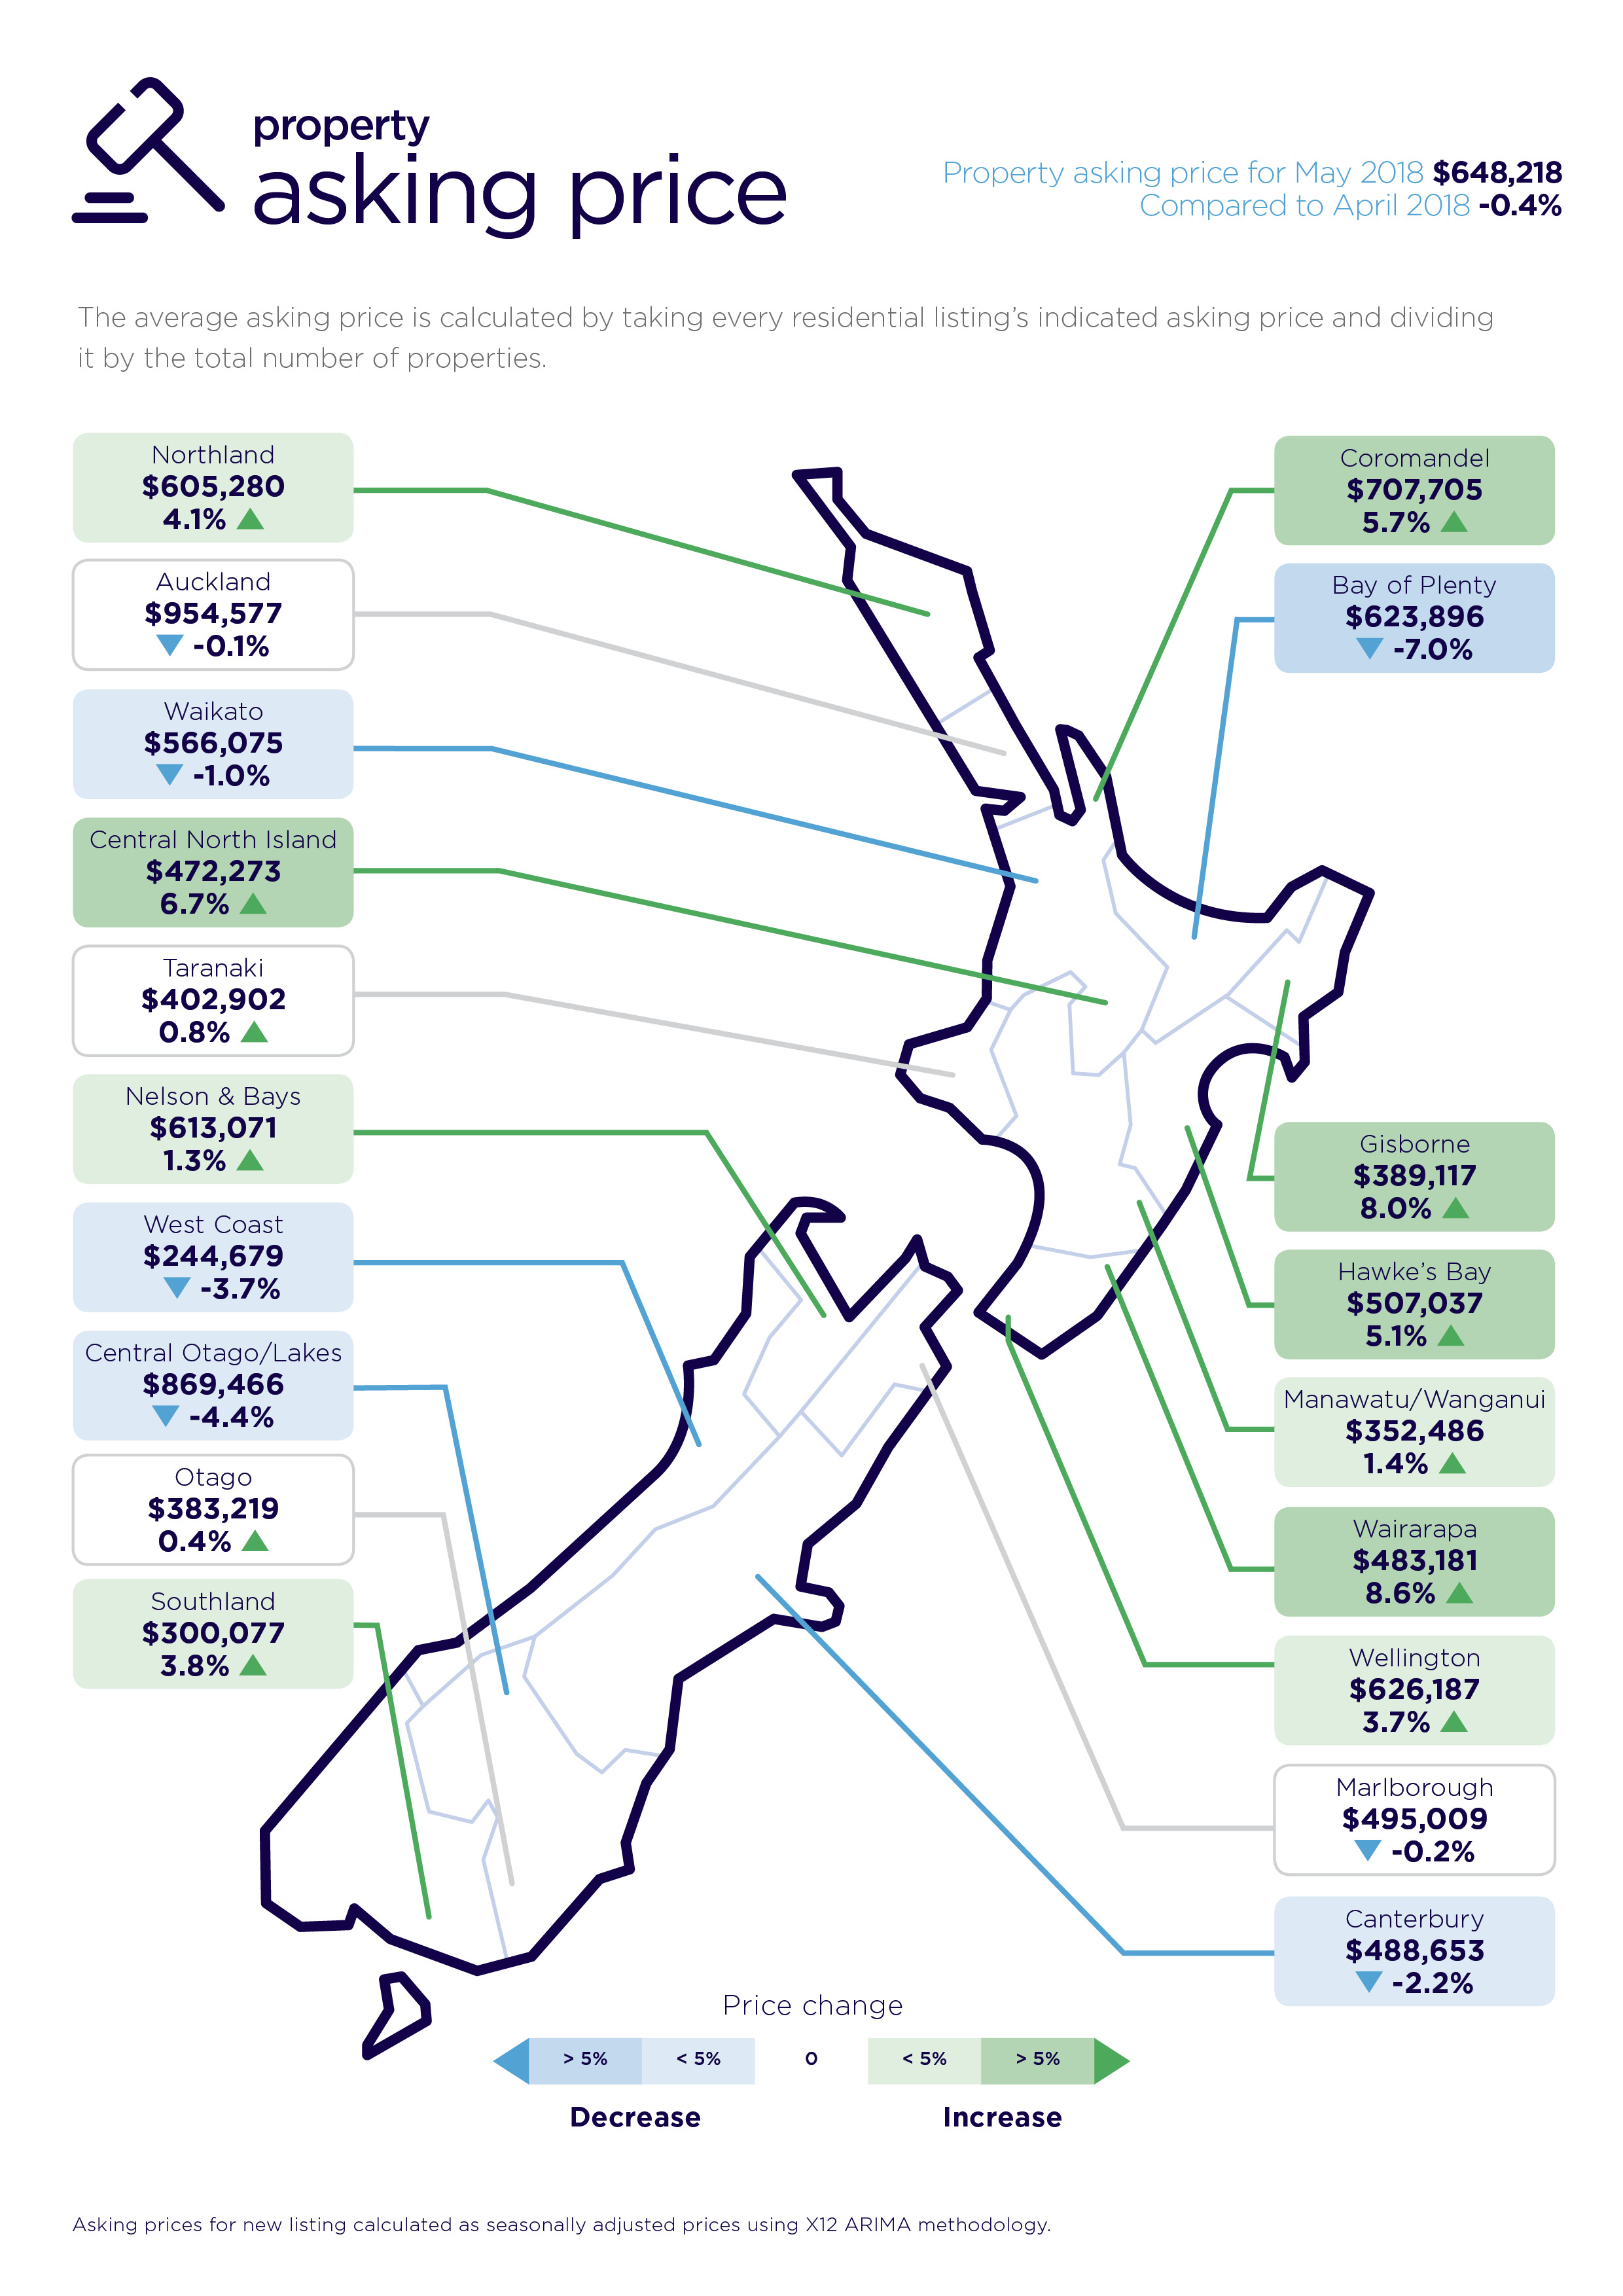
The average asking price for a New Zealand home is $648,218 representing a 0.4% decrease on April 2018.
“It paints a picture of more choice and stable pricing in modest terms,” says Vanessa Taylor.
“We are entering the winter period and typically the market starts to go quiet, but people still buy and sell property. The winter months are typically slower with less volume than the summer months, which gives buyers and sellers more time to consider opportunities,” she says.
Asking price highs in five regions
While asking prices were relatively static nationally, all time average asking price highs were recorded in five regions in May.
The Wairarapa region led the increases with an 8.6% lift in asking prices ($483,181), followed by Gisborne (up 8.0% to $389,117), Central North Island (up 6.7% to $472,273), Coromandel (up 5.7% to $707,705) and Hawke’s Bay (up 5.1% to $507,037),
New listings increase in 13 of 19 regions – and ski regions are “hot”
The Auckland region dragged down the national new listing average with a 4.4% drop compared with the same period last year. The total number of new listings in May stood at 3,528.
”Two of the three “hottest” new listing regions were skiing meccas”, says Vanessa Taylor.
Central North Island led the country with an 18.7% increase in new listings (146), followed by the Hawke’s Bay region (up 14.9% to 332) and Central Otago/Lakes (up 11.1% to 160).
“With the ski season looming it’s natural that sellers are looking to capitalise,” she says.
“Interestingly, while average asking prices were up 6.7% in the Central North Island, they fell 4.4% in Central Lakes/Otago.”
NB: realestate.co.nz data is collated on the penultimate day of the month.
*Horizon Research: Results of April 2018 Online Property Media Monitor for realestate.co.nz. 1,345 members of the Horizon Research national panel which represents the New Zealand adult population.
Glossary of terms
As the only provider of real estate data in real time, realestate.co.nz offers valuable property market information not available from other sources.
• Average asking price gives an indication of current market sentiment. Statistically, asking prices tend to correlate closely with the sales prices recorded in future months when those properties are sold. As it looks at different data, average asking prices may differ from recorded sales data released at the same time.
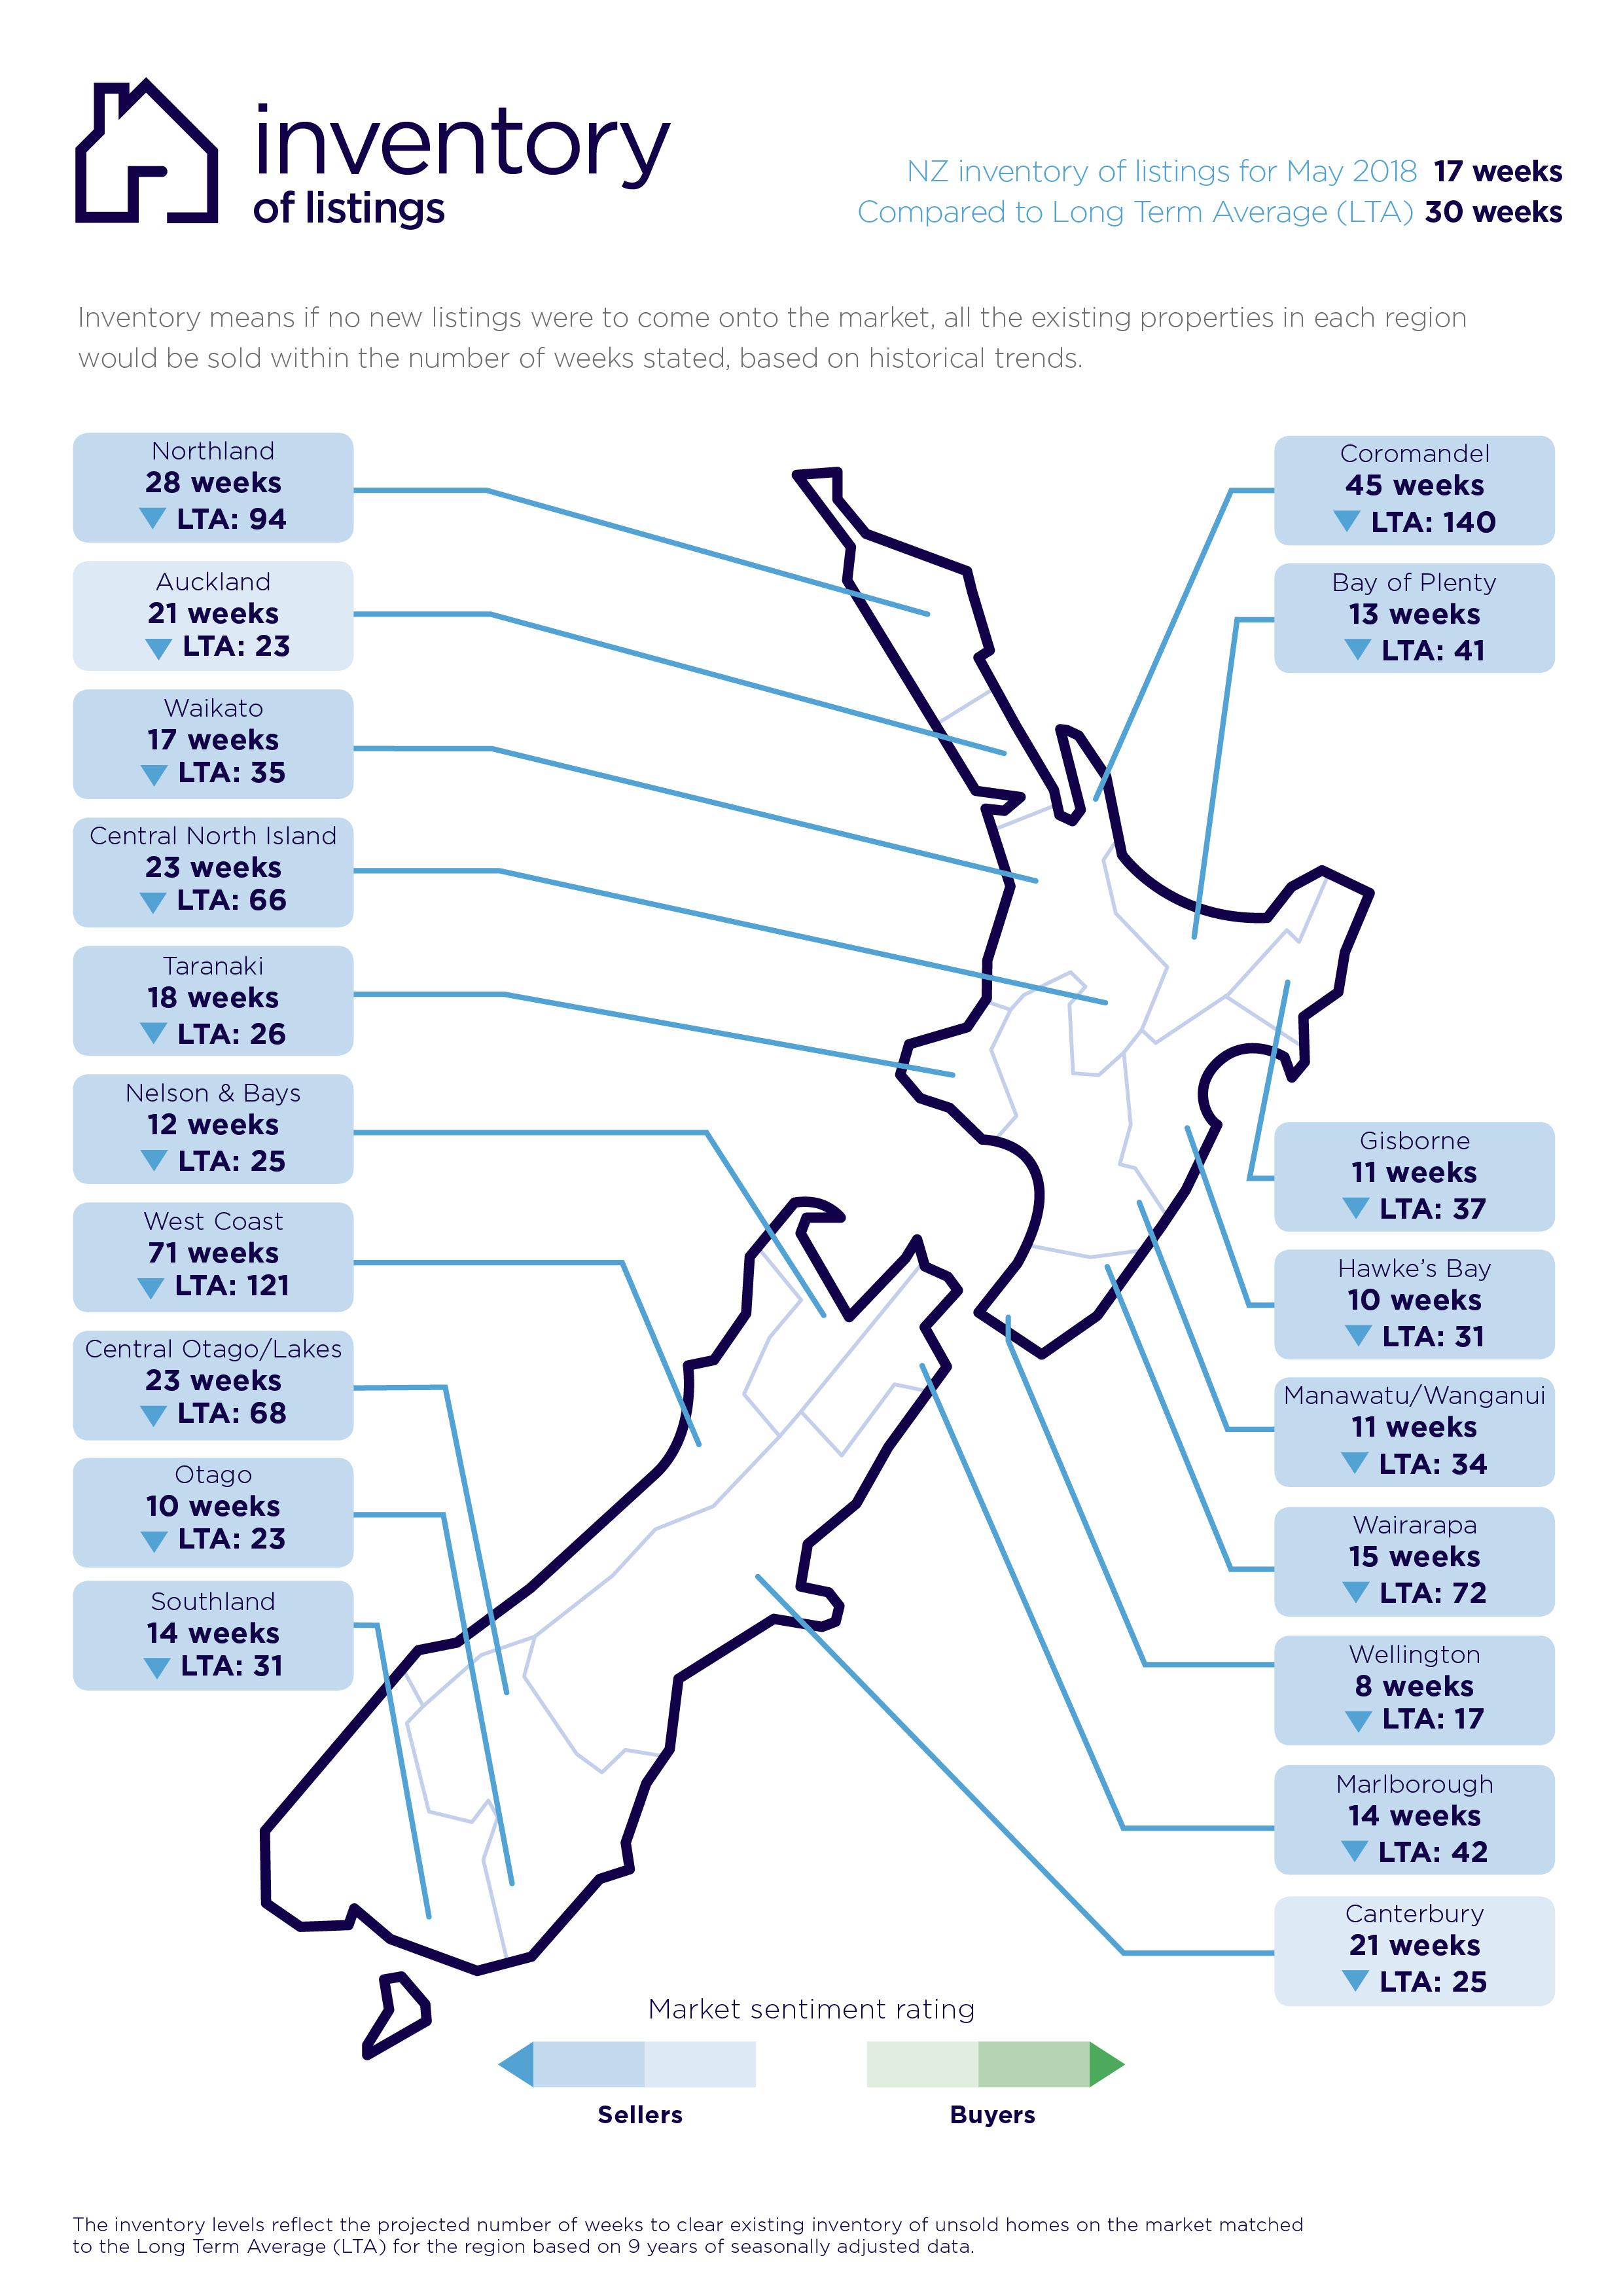
• Inventory is a measure of how long it would take, theoretically, to sell the current stock at current average rates of sale if no new properties were to be listed for sale. It provides a measure of the rate of turnover in the market.
• New listings are a record of all the new listings on realestate.co.nz for the relevant calendar month. As realestate.co.nz reflects 97% of all properties listed through registered estate agents in New Zealand, this gives a representative view of the New Zealand property market.
• Seasonal adjustment is a method realestate.co.nz uses to better represent the core underlying trend of the property market in New Zealand. This is done using methodology from the New Zealand Institute of Economic Research.
• Truncated mean is the method realestate.co.nz uses to provide statistically relevant asking prices. The top and bottom 10% of listings in each area are removed before the average is calculated, to prevent exceptional listings from providing false impressions.
For media enquiries, please contact:
Kate Carter, PPR T: +64 21 514 004 E: kate.carter@ppr.co.nz
Share
-
.svg)
.svg)
.svg)