
.svg)


Download the New Zealand Property Report as a print-ready PDF.
Regional New Zealand flourishes in current property market, while the main centres stall.
Regional New Zealand outshone the main metropolitan centres in March, based on latest statistics released by realestate.co.nz, New Zealand’s largest property listing site.
“The regions are looking lively with asking prices and new listings up in most of the country’s regions, while the main centres paint a different picture,” says Vanessa Taylor, spokesperson for realestate.co.nz.
Real-time statistics from realestate.co.nz show that the top 10 regions with the largest increases in asking prices (compared to the prior month), did not include any of the main centres.
“When we drill down to the top five and bottom five regions, the picture becomes even more interesting.”
Vanessa Taylor says there are opportunities in both sectors.
“In the regions where the market is lively, it represents choice for both buyers and sellers, wherever they are on the property ladder.
“In some regions, such as Auckland, a fall in asking prices could result in renewed opportunities for buyers, including those who want to move up the property ladder.”
The five top “hot regions”
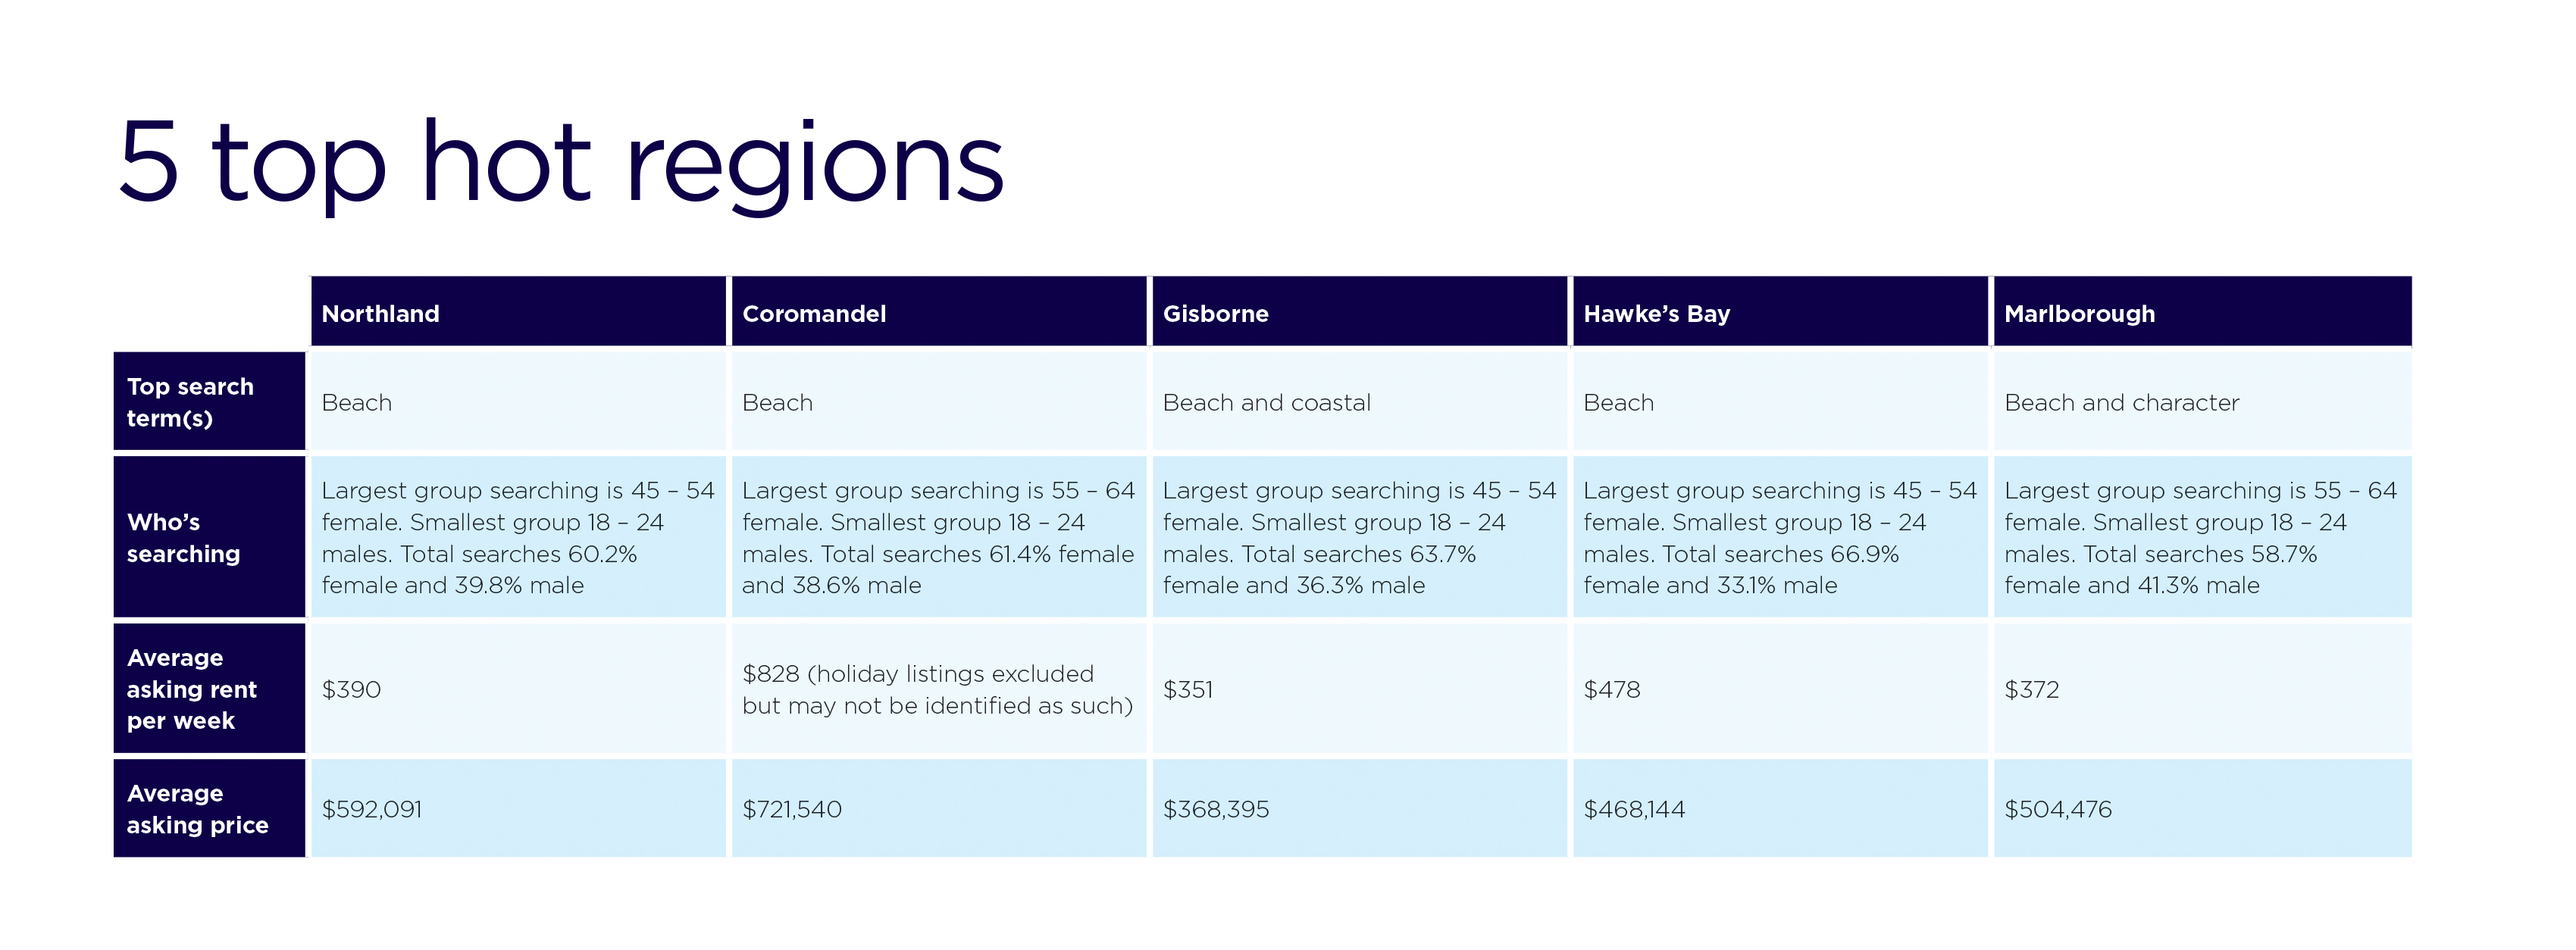
The top five “hot regions” are Gisborne, Northland, Marlborough, Coromandel and Hawke’s Bay (respectively).
All five regions recorded more than a 3.5% increase in asking prices (compared to the previous month) as well as a healthy lift in the number of new listings (compared to March 2017).
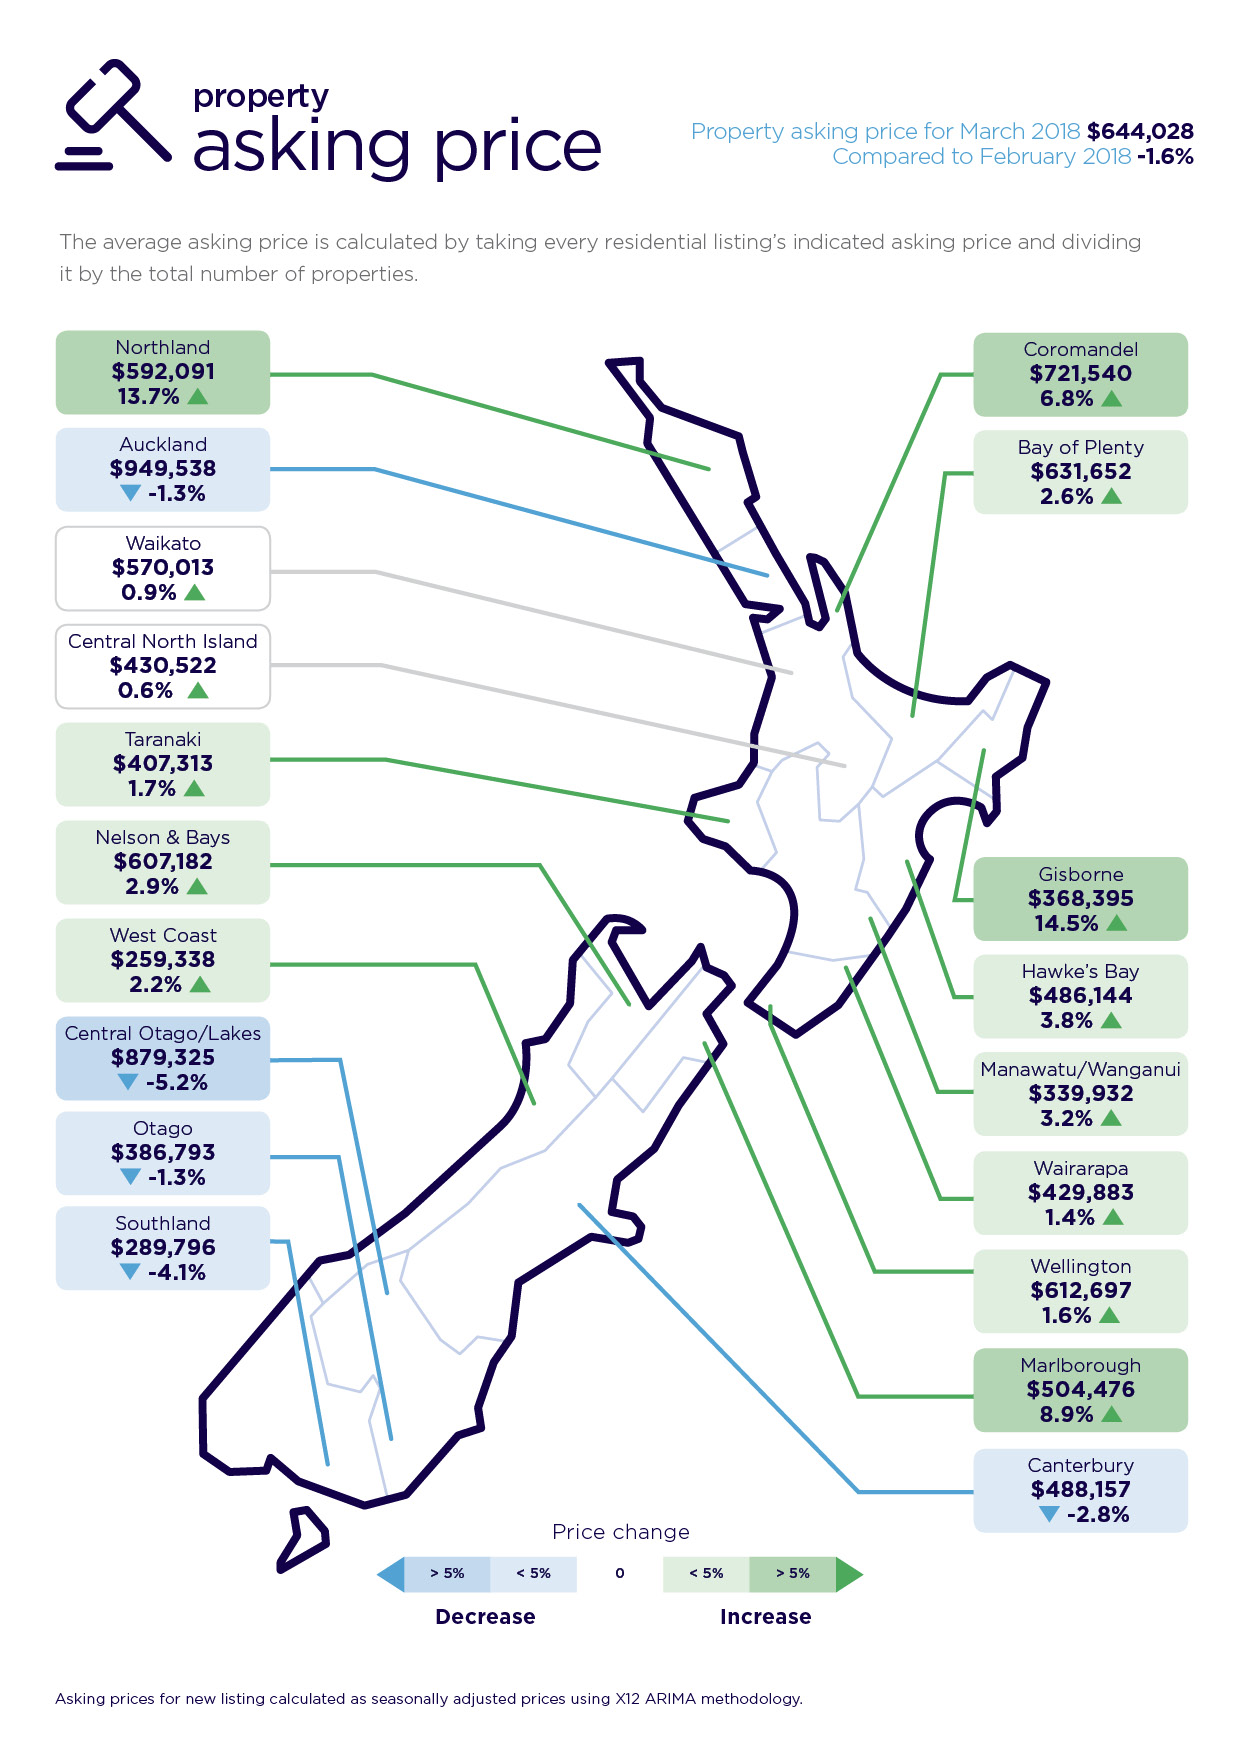
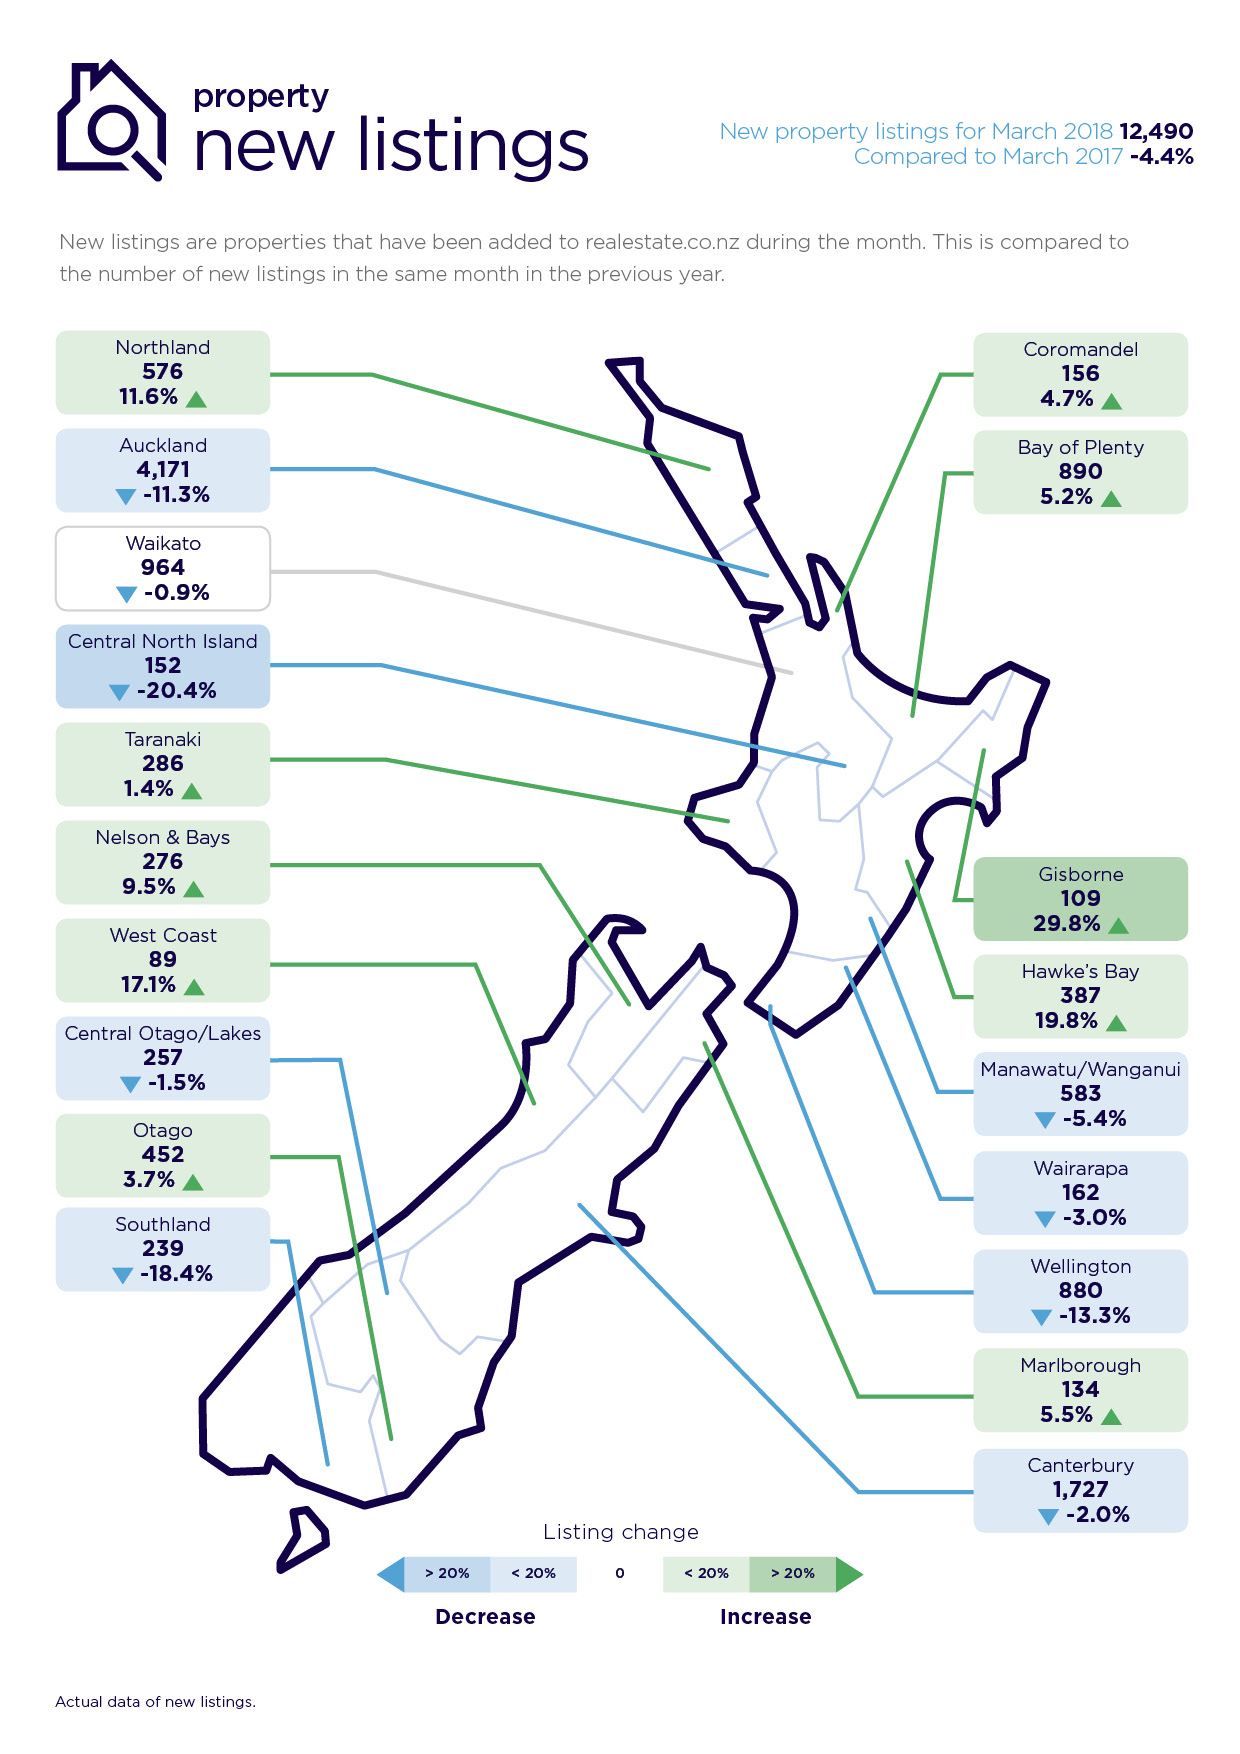
Gisborne topped the March table with a 14.5% increase in the average asking price (to $368,395), and a 29.8% lift in new listings (109).
Gisborne was followed by Northland’s 13.7% increase in asking price to $592,091, and a 11.6% increase in new listings (576); Marlborough’s 8.9% asking price increase to $504,476 and a 5.5% increase in new listings (134); Coromandel’s 6.8% increase in asking price to $721,540 and a 4.7% increase in new listings (156); Hawke’s Bay’s 3.8% increase in asking prices to $486,144 and a 19.8% increase in new listings (387).
“It’s interesting to note that these five regions are very much associated with summer, sunshine and the beach and March was a warm month,” says Vanessa.
Nelson & Bays and the Bay of Plenty also known for their “sunshine, beach, and summer lifestyle” recorded the seventh and eighth highest percentage lifts in asking prices (2.9% to $607,182 and 2.6% to $631,652 respectively), as well as increases in new listings. Nelson recorded a 9.5% to 276 new listings and Bay of Plenty 5.2% to 890 new listings.
A review of searches of realestate.co.nz for the month of March also show “beach” as the top search term for the top five regions. The 5 Top Hot Regions table (below) for March also shows for each region;- the demographic (searching property in the region); the average rental asking price; average asking price (homes); and examples of current listings (high, medium, low asking prices).
The bottom five still offer opportunities
At the other end of the spectrum asking prices fell in five regions compared with the previous month. This included three of the country’s main centres.
New listings also fell in all these regions, except for Otago.
“It’s an unusual situation, but it can also provide some good opportunities for prospective buyers and sellers,” says Vanessa Taylor.
“For buyers, the fall in asking prices is worth checking out and for sellers it’s a tight market, so listing now may bring in the results they are after.”
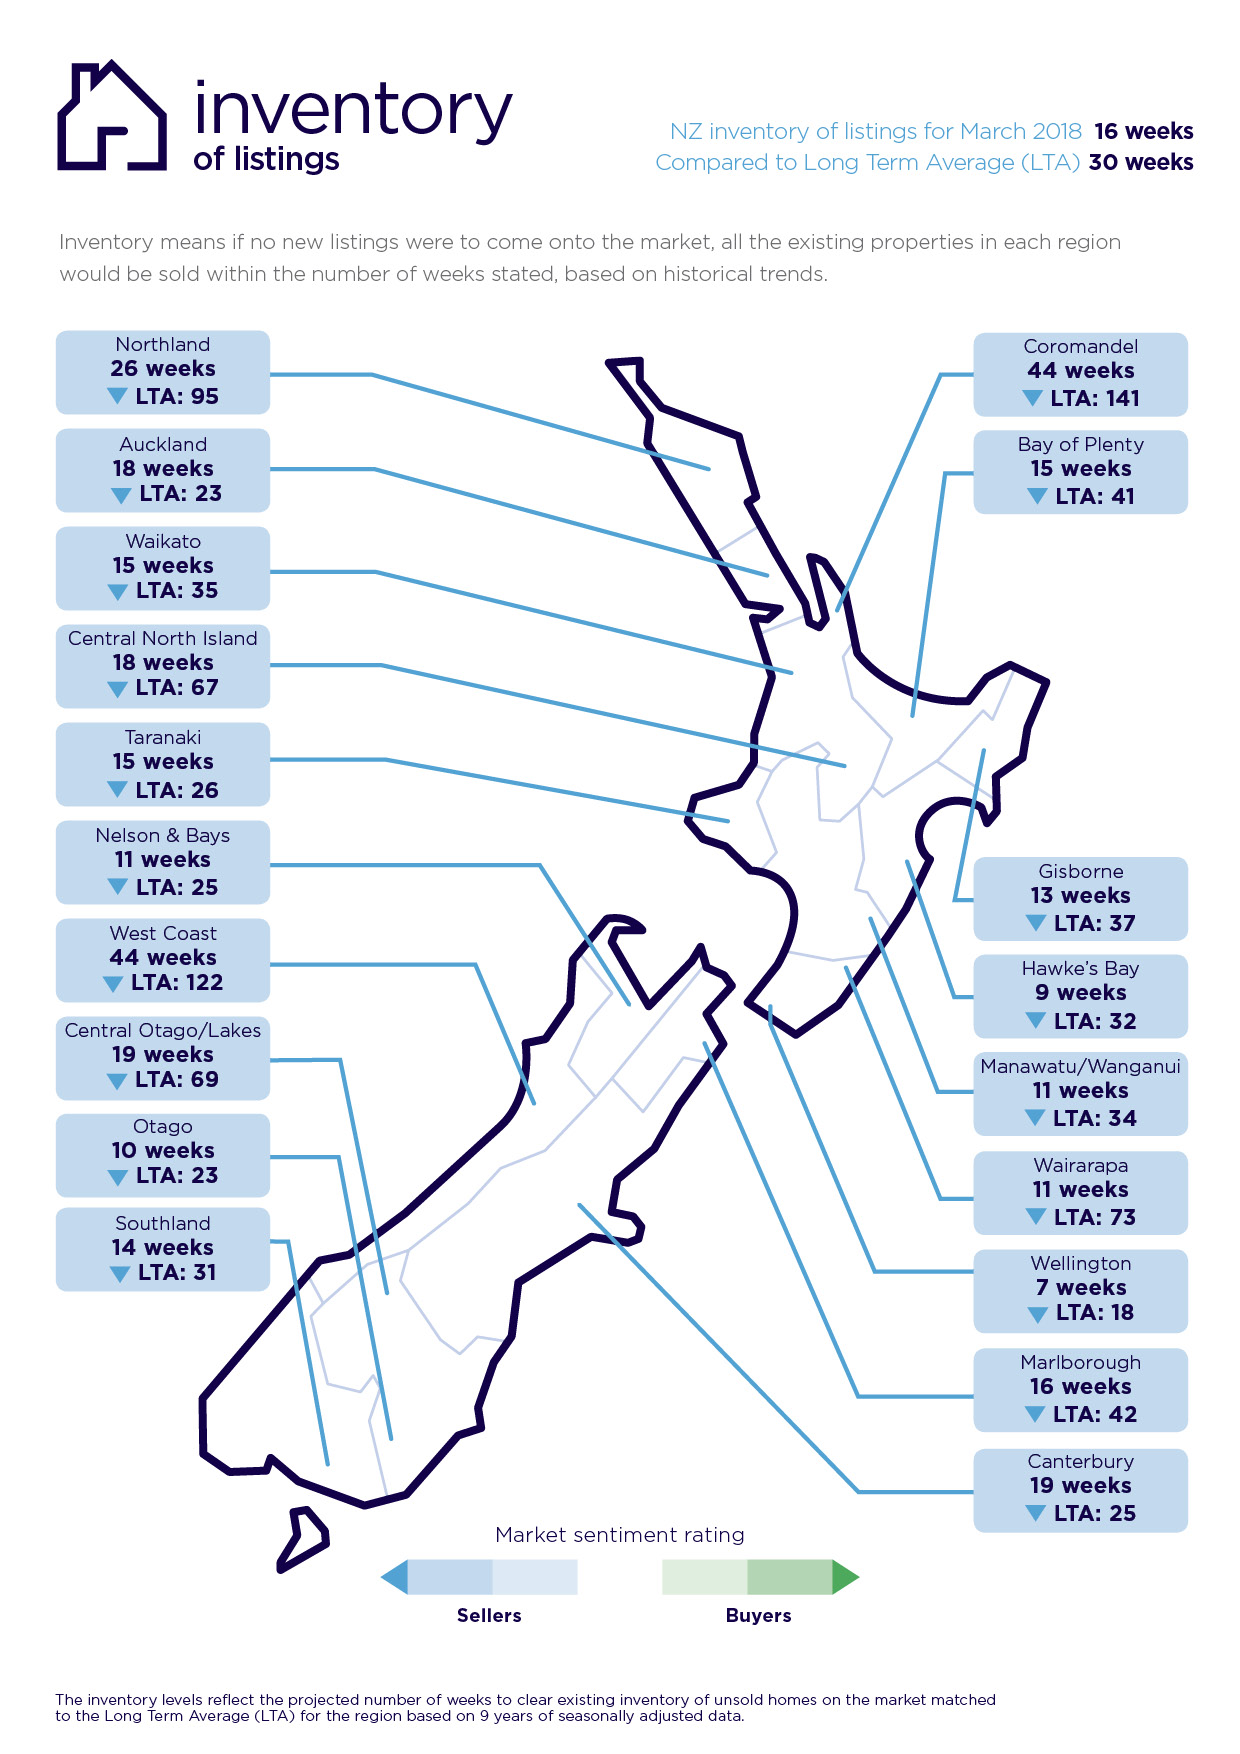
While asking prices have fallen in Auckland, market activity has actually lifted. In the past two months (February/March) the LTA (Long Term Average*) has fallen to 18 weeks. This means if every home currently on the Auckland market was sold and no new listings added, there would be no properties for sale in the region in 18 weeks.
Over the past year, the LTA in Auckland has fallen to 18 weeks in only one other month (September 2017), says Vanessa Taylor.
“This shows that new listings are down, the Auckland market is active,” she says.
“It’s an opportune time to check out what’s on offer and that goes for the other four regions.”
The Auckland region’s average asking price fell 1.3% to $949,538 (compared with February 2018), and new listings fell to 4,171 (-11.3%) compared to March 2017.
In the same comparative periods, Central Otago/Lakes experienced the largest drop in average asking price, falling 5.2% to $879,325, coupled with a 1.5% fall in new listings (257).
This was followed by Southland with a 4.1% fall in average asking price to $289,796 and an 18.4% fall in new listings (239); Canterbury’s average asking price was down 2.8% to $488,157 and new listings down 2% (1,727); Otago’s average asking price was down 1.3% to $386,793 but new listings rose by 3.7% (452).
“It’s quite unusual to see these main regions grouped together like this at the same time,” says Vanessa.
“It also obviously impacts on the national numbers particularly when Auckland, the largest market in the country, is involved,” she says.
Asking price highs for four regions
Wellington, Waikato, Taranaki and Manawatu/Wanganui hit record asking price highs in March.
“While they were relatively modest highs, it’s still significant, particularly for the Wellington region which is very tightly held and the only main region to not experience a fall in asking price,” says Vanessa Taylor.
Wellington’s average asking price was up 1.6% from the previous month, reaching a record high of $612,697.
Other regions recording all-time asking highs are the Waikato (up 0.9% to $570,013); Taranaki (up 1.7% to $407,313); and Manawatu/Wanganui (up 3.2% to $339,932).
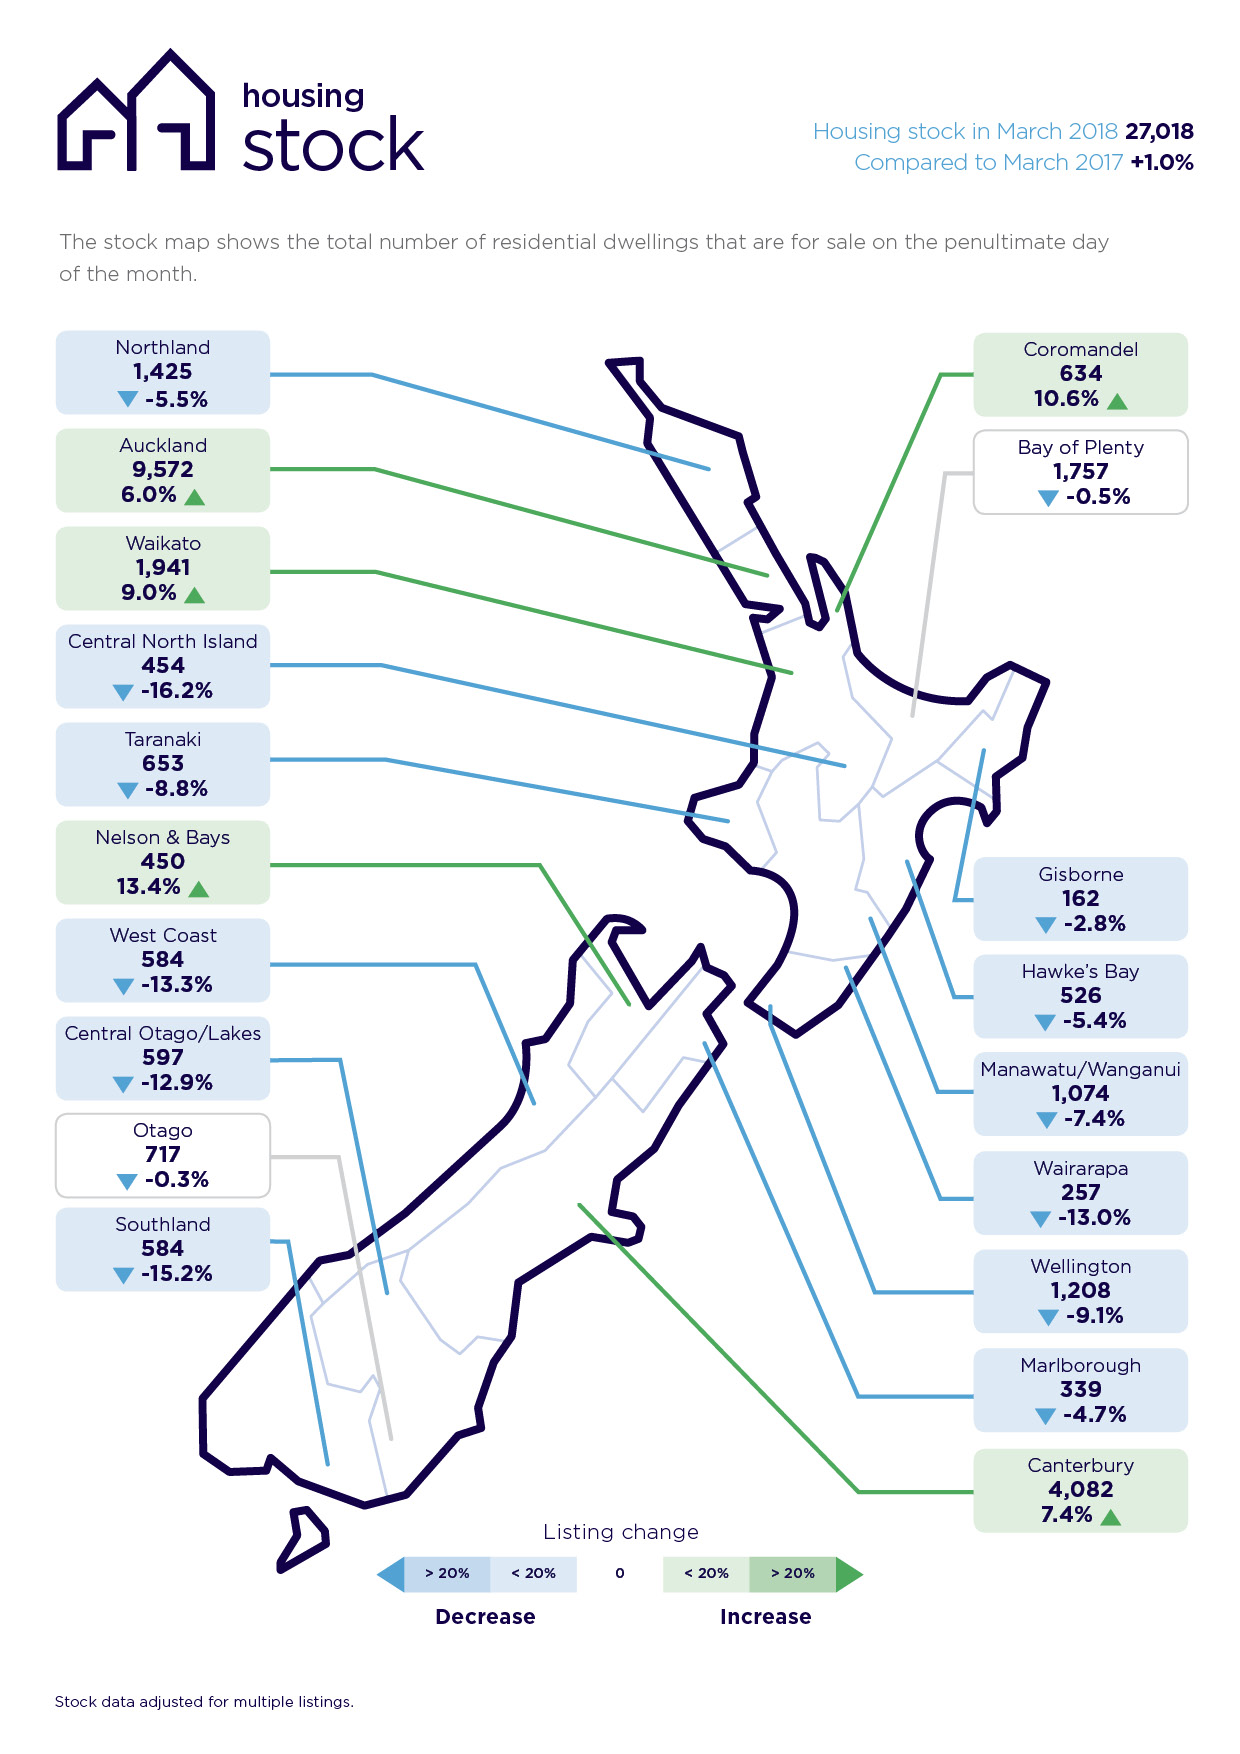
NB: The data was collated on the penultimate day of the month.
Glossary of terms
Being the only provider of real estate data in real time, realestate.co.nz offers valuable property market information not available from other sources.
• Average asking price gives an indication of current market sentiment. Statistically, asking prices tend to correlate closely with the sales prices recorded in future months when those properties are sold. As it looks at different data, average asking prices may differ from recorded sales data released at the same time.
• Inventory is a measure of how long it would take, theoretically, to sell the current stock at current average rates of sale if no new properties were to be listed for sale. It provides a measure of the rate of turnover in the market.
• New listings are a record of all the new listings on realestate.co.nz for the relevant calendar month. As realestate.co.nz reflects 97 per cent of all properties listed through registered estate agents in New Zealand, this gives a representative view of the New Zealand property market.
• *Demand: the increase or decrease in the number of views per listing in that region, taken over a rolling three-month time frame, compared to the same three-month time frame the previous year – including the current month.
• Seasonal adjustment is a method realestate.co.nz uses to better represent the core underlying trend of the property market in New Zealand. This is done using methodology from the New Zealand Institute of Economic Research.
• Truncated mean is the method realestate.co.nz uses to provide statistically relevant asking prices. The top and bottom 10 per cent of listings in each area are removed before the average is calculated, to prevent exceptional listings from providing false impressions.
For media enquiries, please contact:
Kate Carter, PPR
T: +64 21 514 004 E: kate.carter@ppr.co.nz
Share
-
.svg)
.svg)
.svg)