Download the full report as a PDF now.
Fewer listings in the month of March due to nationwide lockdown but serious buyers are still active. Record asking price highs began in 2007 and are still seen around the country. The real estate industry adapts to COVID-19 pandemic.
Real-time data from realestate.co.nz indicates that Kiwis hit pause on selling their homes at the end of March as the industry adapted to a temporary period of disruption. Nationally, new listings coming onto the market in the month of March were down 16.5% on the same time last year. The drop reflects the impact that Alert Level 4 has had on numerous industries, including the property market.
Despite the lockdown, average asking prices around the country, however, remained buoyant in March with eight all-time highs since records began 13 years ago.
Vanessa Taylor, spokesperson for realestate.co.nz, says that it will be a waiting game to see what the property market does in the face of COVID-19. However, she says that buyers and sellers have remained active, with average time on the website increasing significantly since the lockdown was put in place.
“For many Kiwis, this is a good time to get their property in front of potential buyers who are spending more time looking at property online. It is also a good time for Kiwis searching for something new to look carefully at what is available,” says Vanessa.
She adds that floorplans, 3D walkthroughs and video content will be even more important for sellers during this time when homes cannot be viewed in person.
New listings drop nationally after a busy start to 2020 for vendors
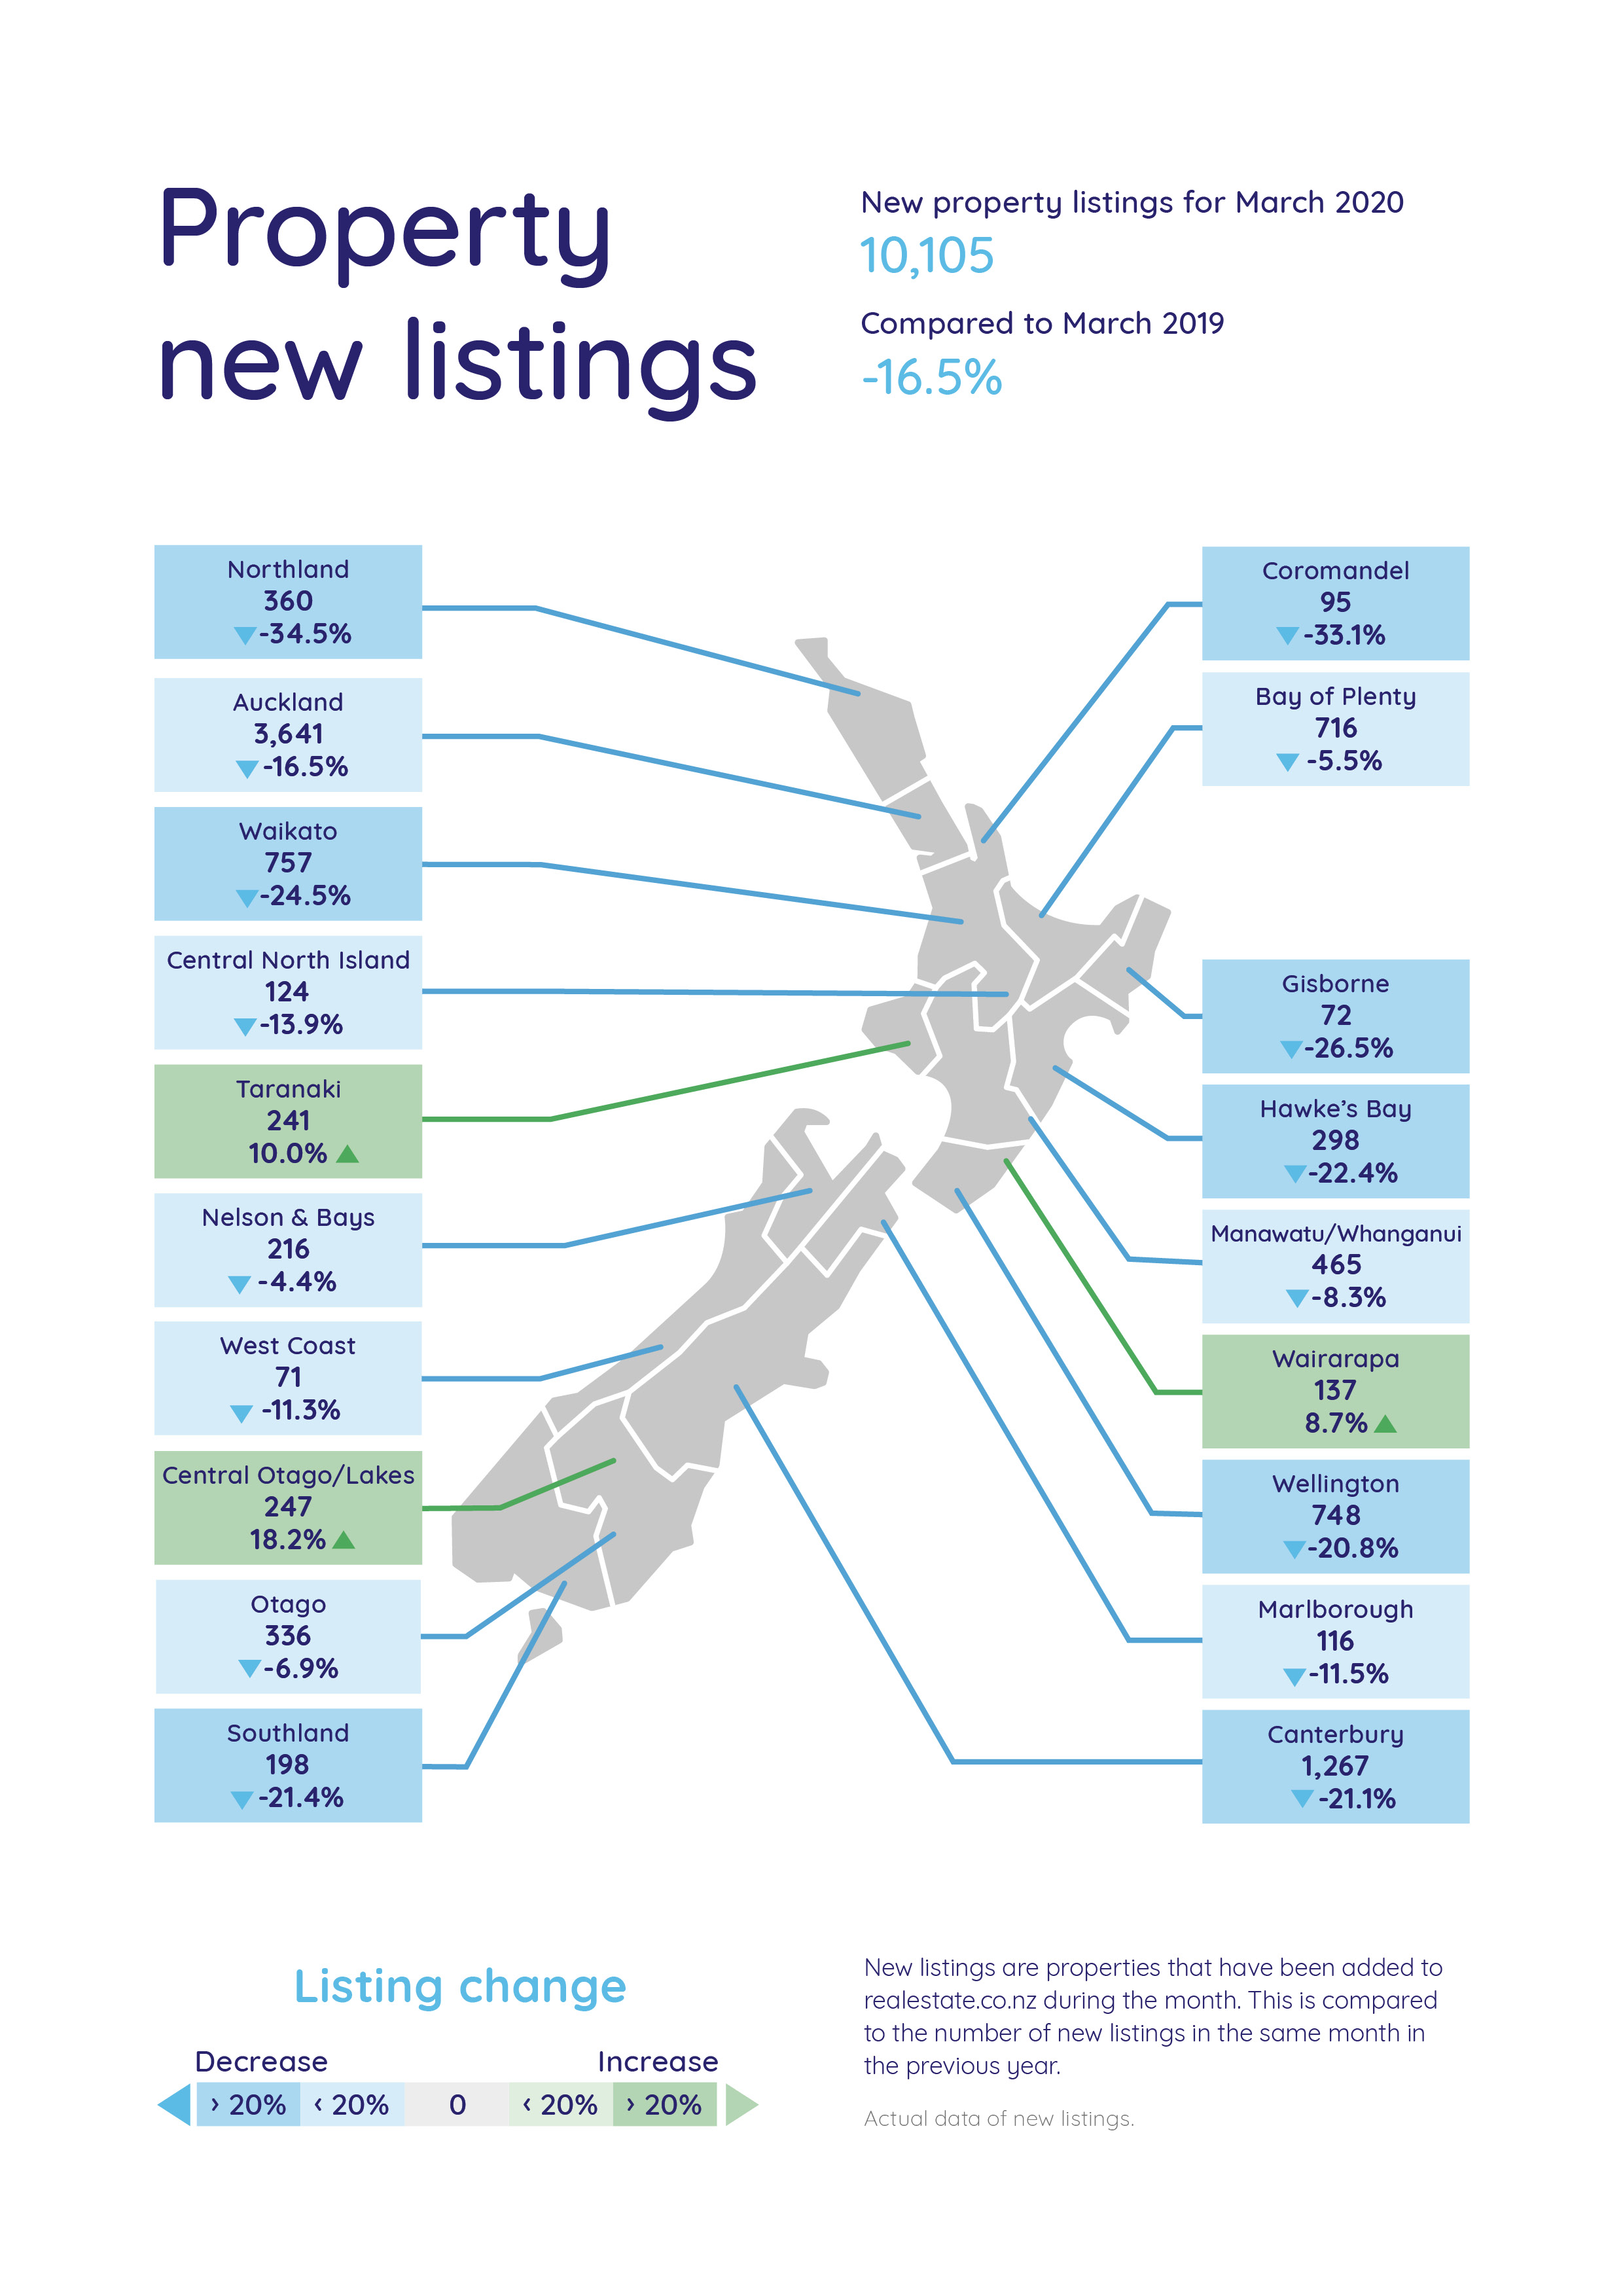
New listings coming onto the market were down 16.5% nationally in March compared to the same time last year. Coinciding with New Zealand moving into Alert Level 3 and Alert Level 4, most of the decline in new listings occurred in the last week of March.
Regionally, the biggest decreases were in Northland and the Coromandel which dropped back by 34.5% and 33.1% respectively.
This follows a busy start to 2020 for many vendors. In February, 12 of 19 regions saw a lift in new homes coming onto the market, signalling a potential market shift across the country. In comparison, only three regions this March saw a lift in new listings.
Vanessa says that while people can put their homes on the market during Alert Level 4, she believes that some people may wait to list their homes due to the logistical challenges a lockdown brings.
“I suspect that many Kiwis, whether they are planning to list now or after the Alert Level 4 period, will be making the smart decision to prepare their homes for sale now.”
The regions who saw new listings increase during March were Central Otago/Lakes, Taranaki and Wairarapa, with increases of 18.2%, 10.0% and 8.7% respectively.
“New listings coming onto the market have been down in Taranaki since December 2019 so, although the total homes for sale in the region is still down on last year, it is nice to see some activity in the region,” says Vanessa.
Eight all-time asking price highs
Although the country is in lockdown, we did still see some regions hit all-time asking price highs around the country in March.
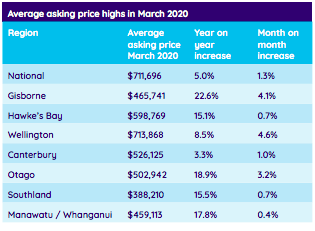
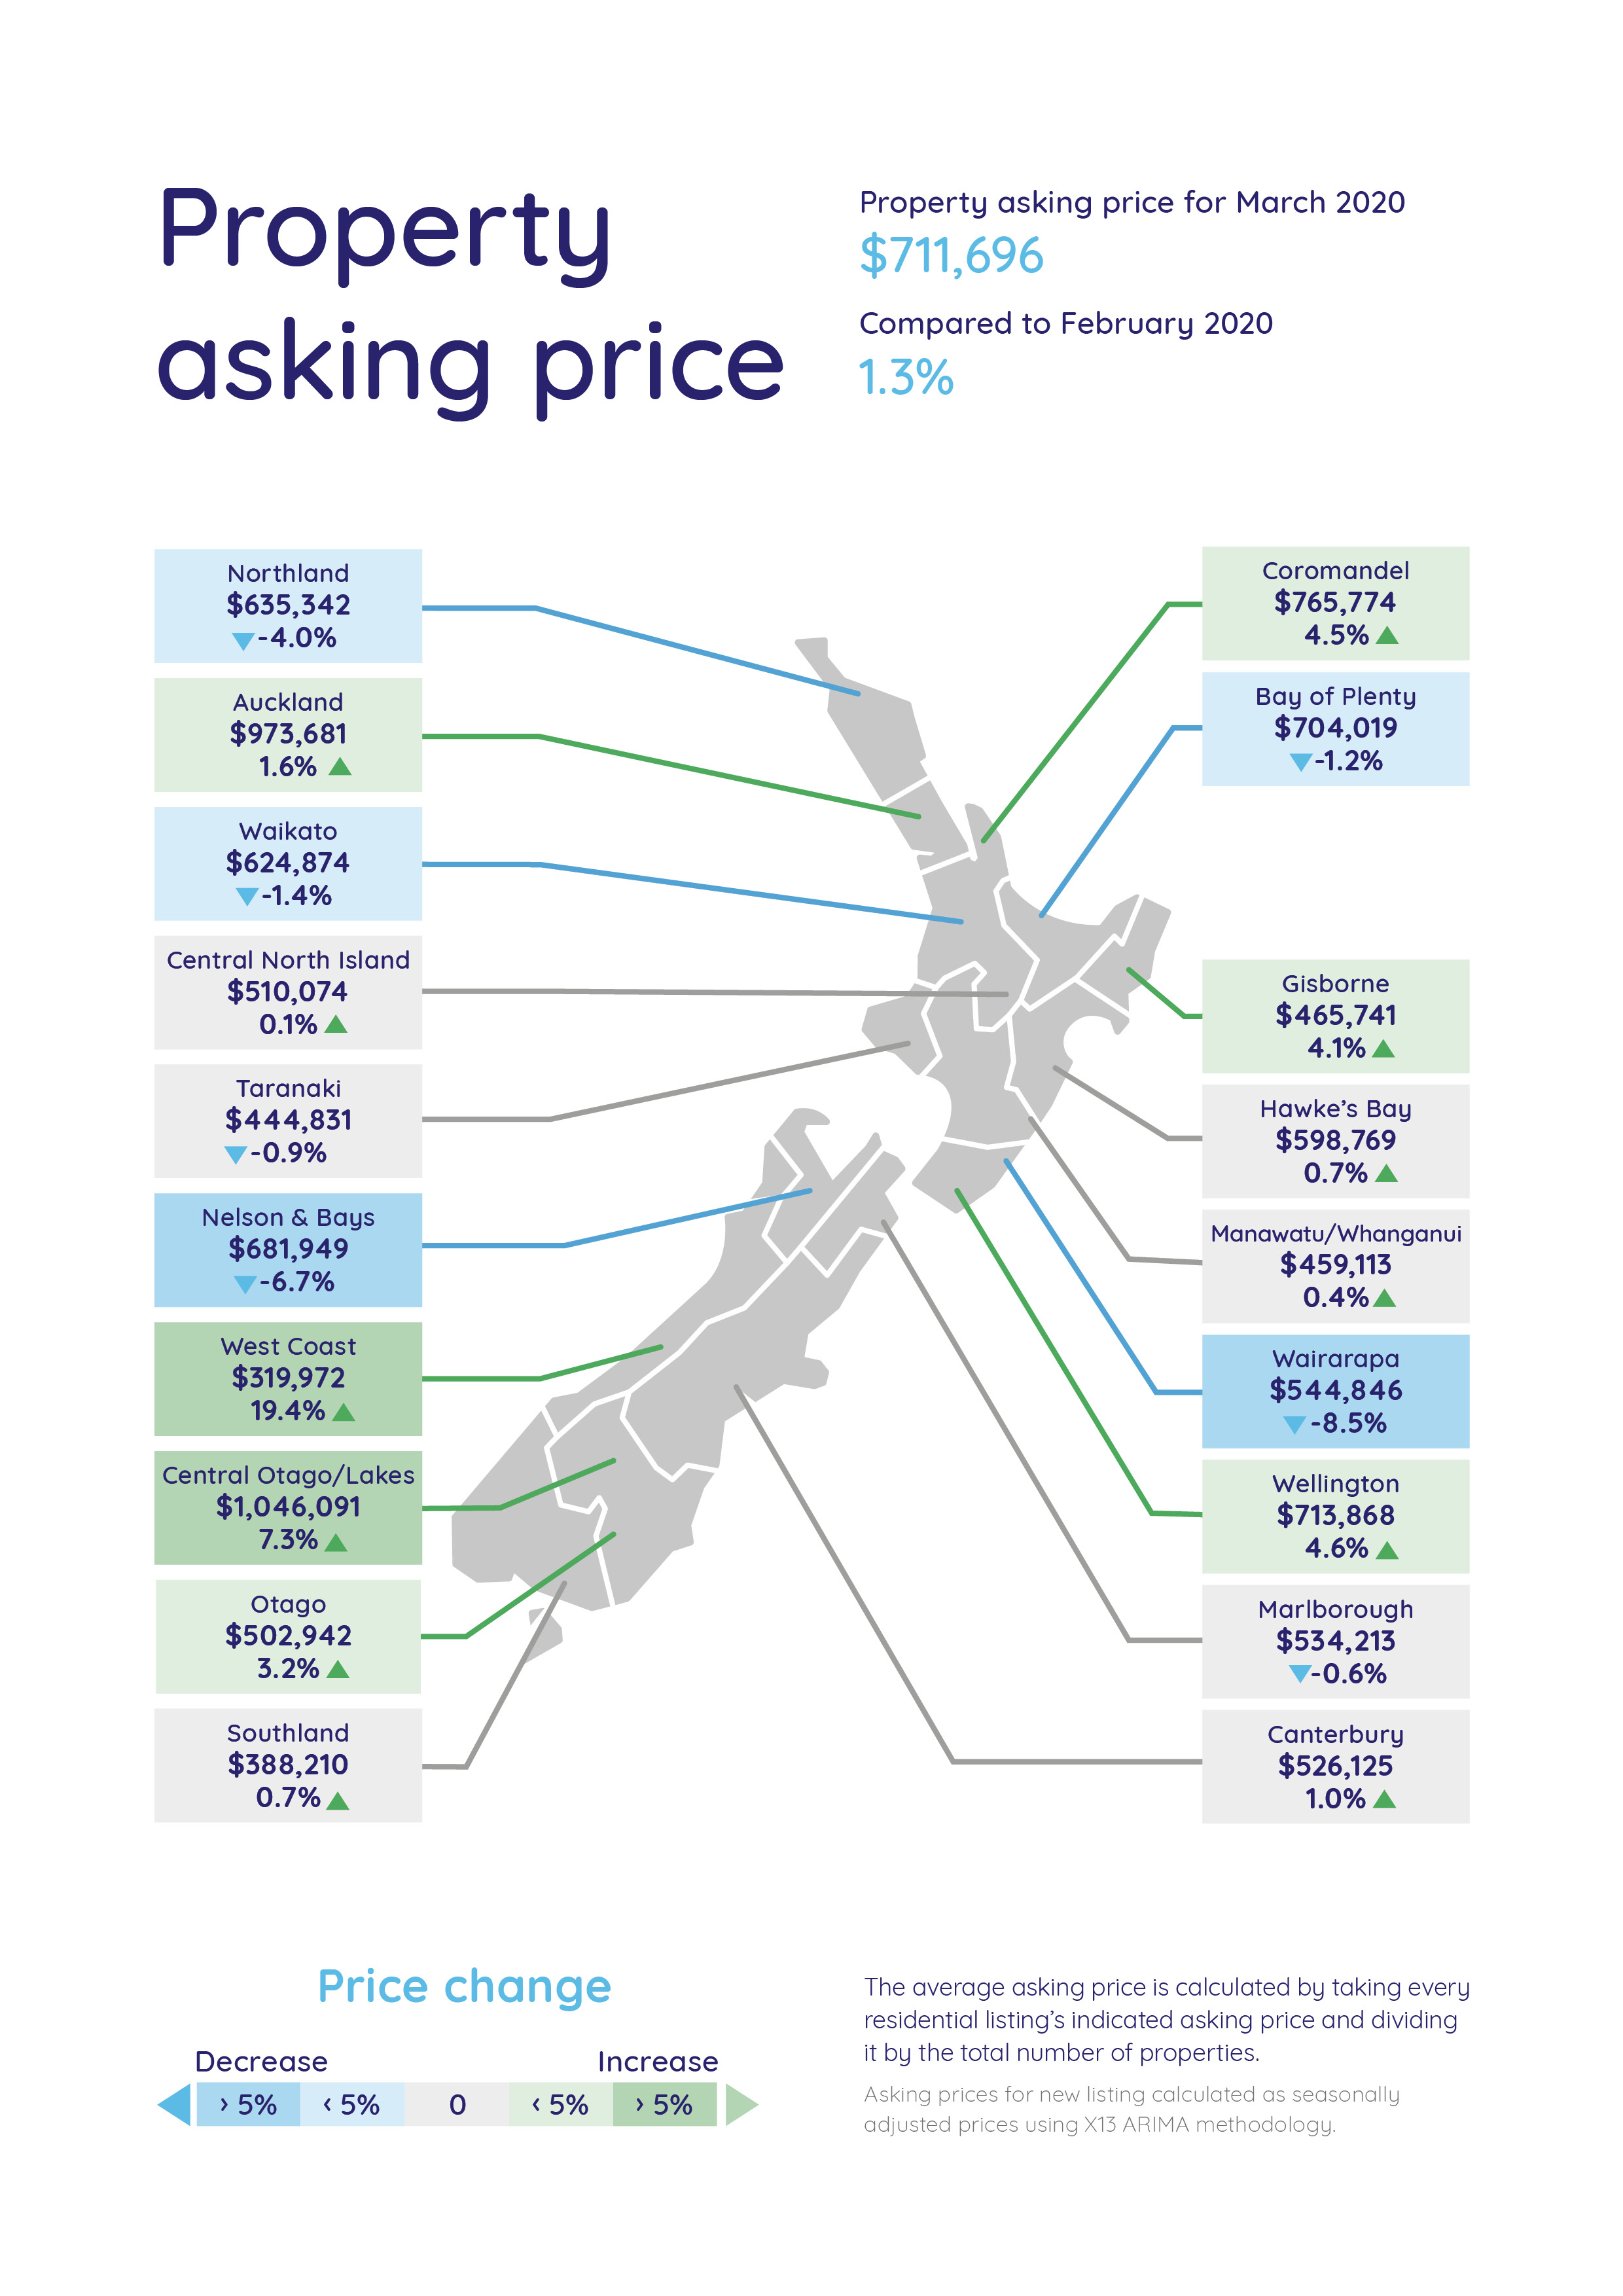
Nationally, the average asking price increased by 5.0% on the same time last year to a record high of $711,696 – just slightly above the nation’s last recorded high of $710,393 in January 2020.
Gisborne, Hawke’s Bay, Canterbury, Otago, Wellington, Southland and Manawatu/Whanganui also hit all-time asking price highs since records began 13 years ago.
In Otago, the average asking price increased by 18.9% on the same time last year to tip above $500,000 for the first time.
However, it wasn’t just record-holding regions commanding big price tags last month.
The biggest price jump nationally was on the West Coast where the average asking price increased by 19.4% on February 2020 to $319,972. The increase is an impressive 23.9% on March 2019 and takes the average asking price just shy of the region’s last recorded high of $320,808 in July 2013.
The second highest month on month price increase in March 2020 was in Central Otago/Lakes, where prices increased by 7.3% on the previous month to $1,046,091
Stock shortage continues
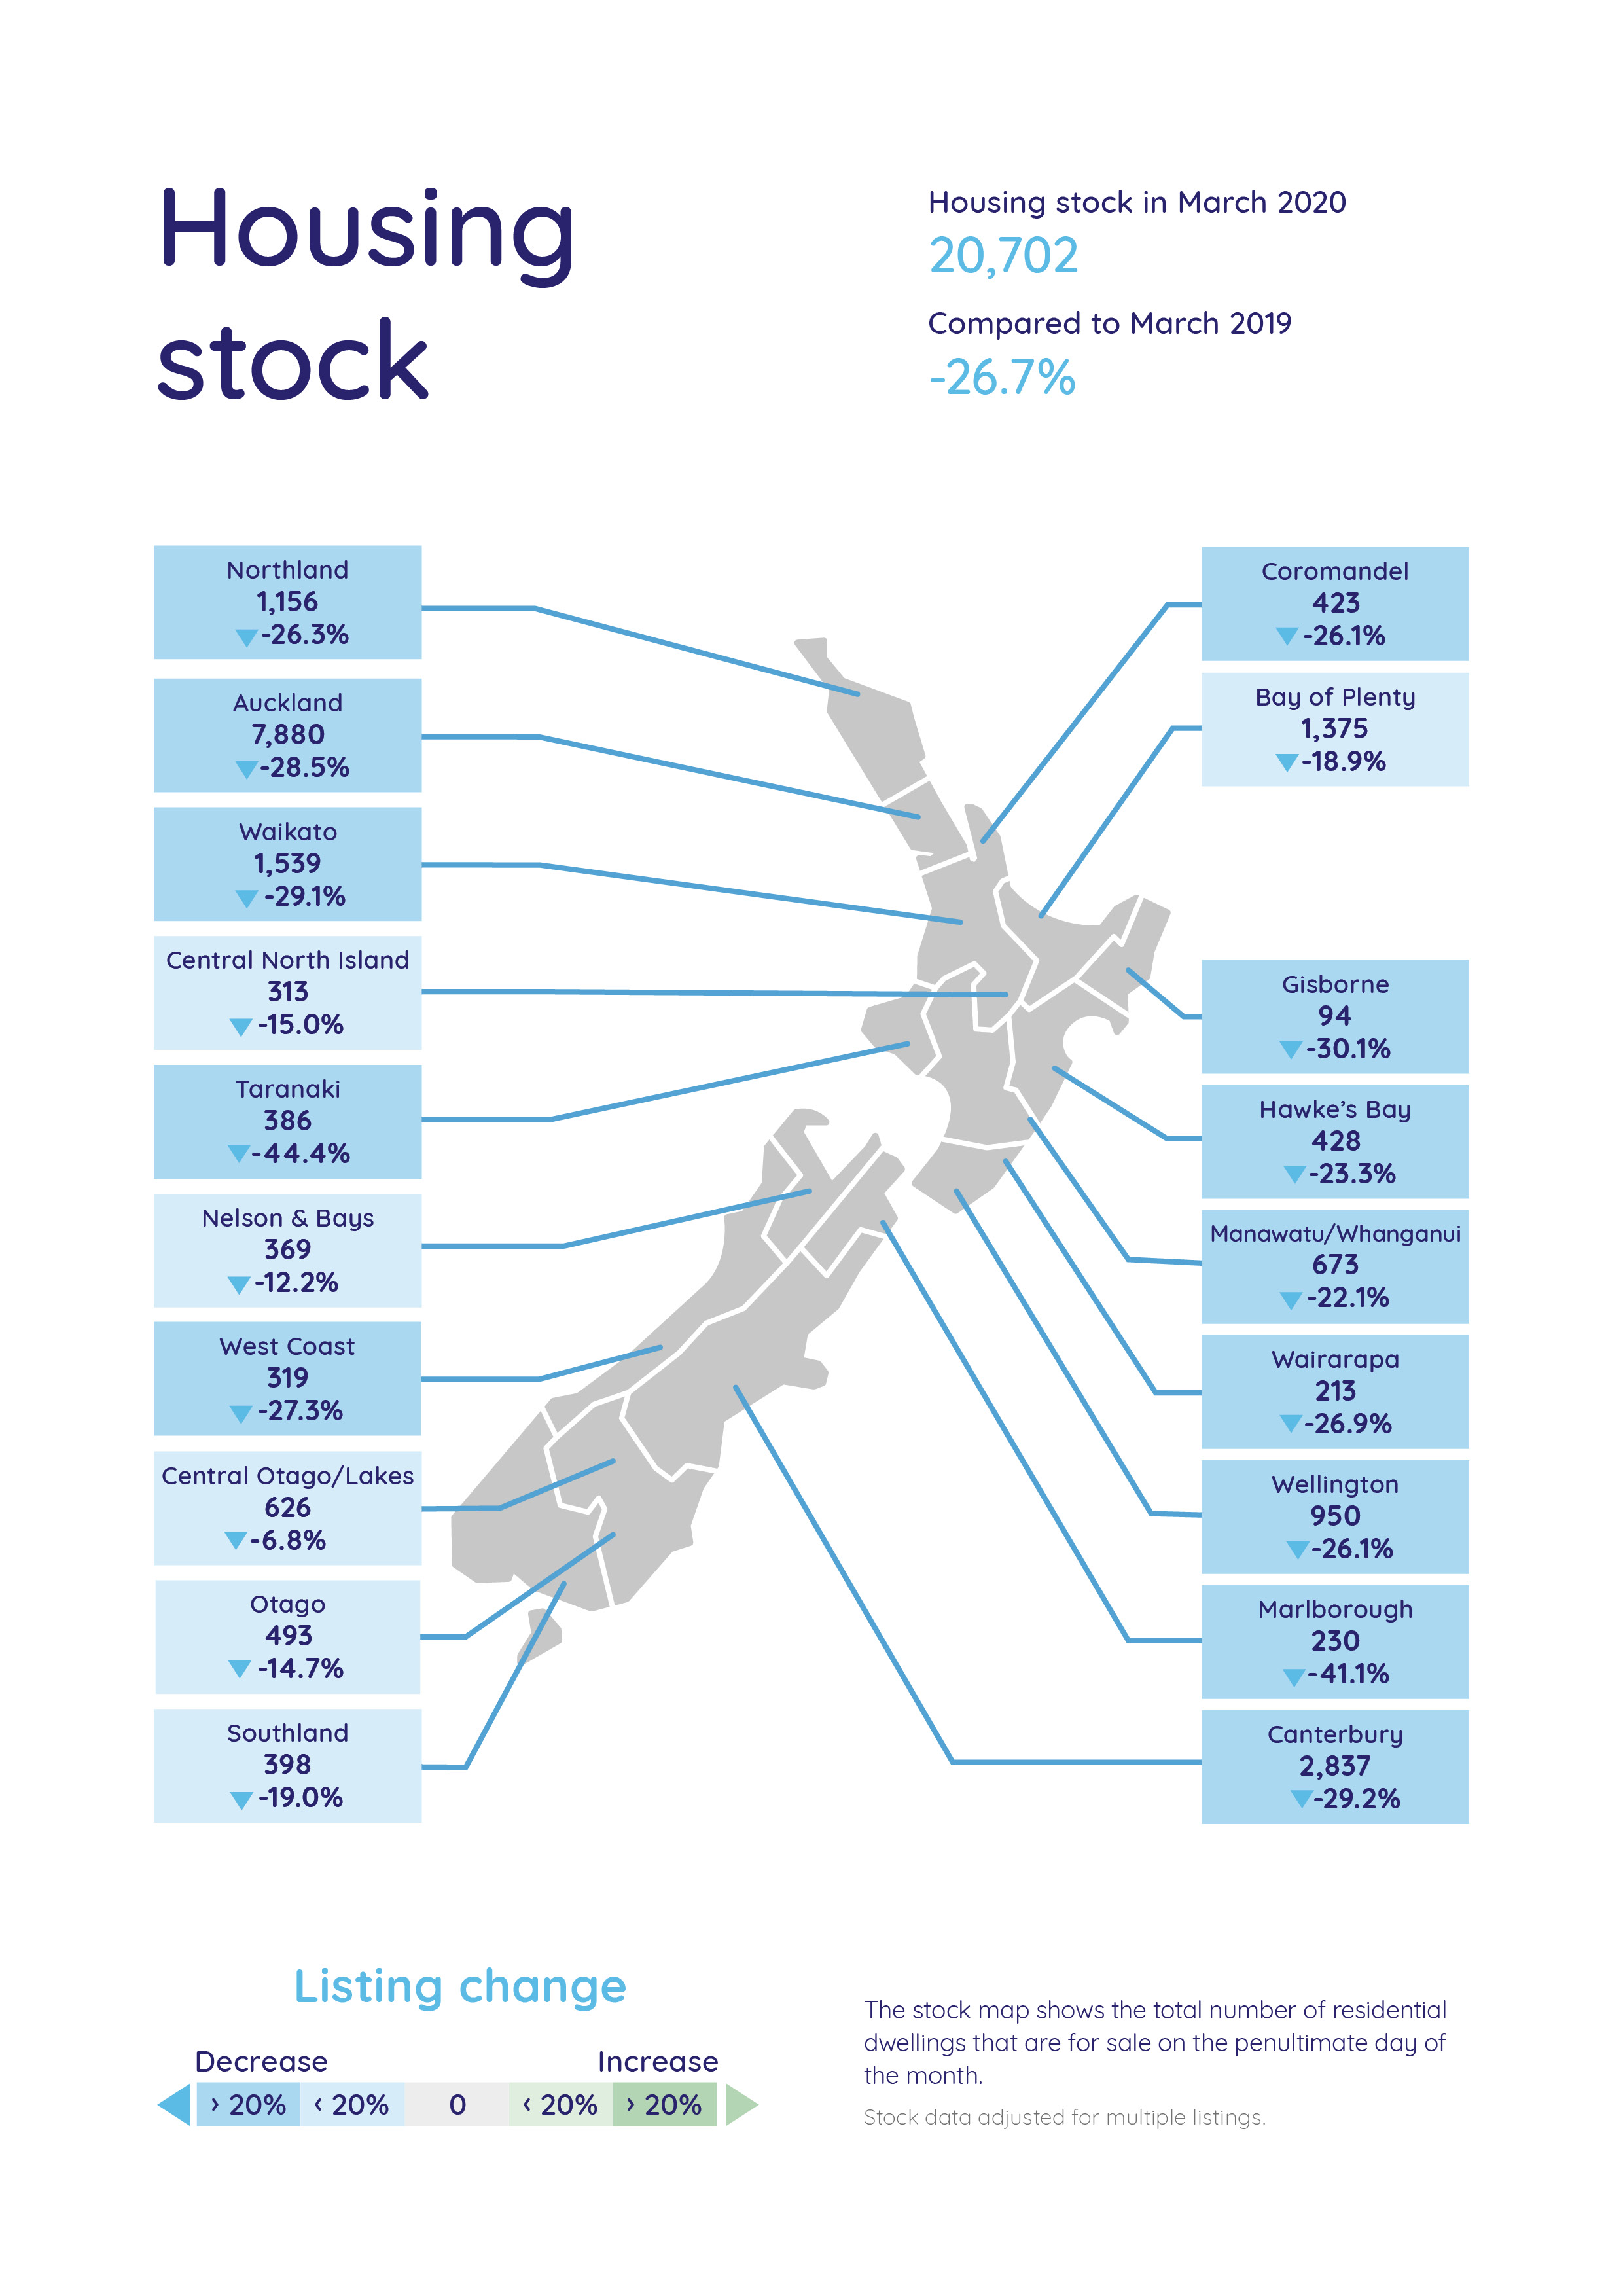
This is a challenging time for nearly every industry, but Vanessa says that our national housing shortage remains an issue for the property market. In March, the total homes available for sale nationwide was down 26.7% on the same time last year. This decrease, Vanessa says, follows a long-term trend with stock already down by 22.3% in February when compared to the same time last year.
The total homes available for sale decreased in every region during March with Marlborough (230 homes) hitting an all-time low since records began in 2007. Some of the top drops were seen in Taranaki, Waikato, Auckland and Wellington, where total homes available for sale were down 44.4%, 29.1%, 28.5% and 26.1% respectively compared to the same month last year.
“We physically do not have enough homes for the number of people in our country. As a country, we haven’t kept pace with population growth in recent years,” says Vanessa.
“It remains important for us to look at how we can scale up building activity and build modern, high-density homes for New Zealanders,” says Vanessa.
How the real estate industry could change during COVID-19
Real-time data from realestate.co.nz shows that while new listings coming onto the market slowed in the last week of March, property seekers spent, on average, more time online at realestate.co.nz.
“Right now, we are spending more time on our biggest assets, our homes, than ever before. People are either going to fall back in love with their home or they will realise that it is time to move on.”
But Vanessa doesn’t think Kiwis are about to move on from their love affair with property.
“We have already seen an increase in the amount of time people are spending on our site since the lockdown began, with the average session now lasting more than nine minutes – compared to the first part of the year where the average was sitting at around seven minutes.”
She says that the disruption to the industry will temporarily bring a shift in the way people buy and sell property.
“Buyers will be spending even more time researching online before viewing in person so listings will likely become even more important over the next few weeks.”
“This is where online listing capabilities, like those available on realestate.co.nz, which showcase essential property information like floorplans, 3D walkthroughs and video content, will become more important for sellers who want to get noticed,” says Vanessa.
For media enquiries, please contact:
Trish Fitzsimons | 021 022 96927 | trish@realestate.co.nz
Glossary of terms: As the only provider of real estate data in real-time, realestate.co.nz offers valuable property market information not available from other sources.
- Average asking price is not a valuation. It is an indication of current market sentiment. Statistically, asking prices tend to correlate closely with the sales prices recorded in future months when those properties are sold. As it looks at different data, average asking prices may differ from recorded sales data released at the same time.
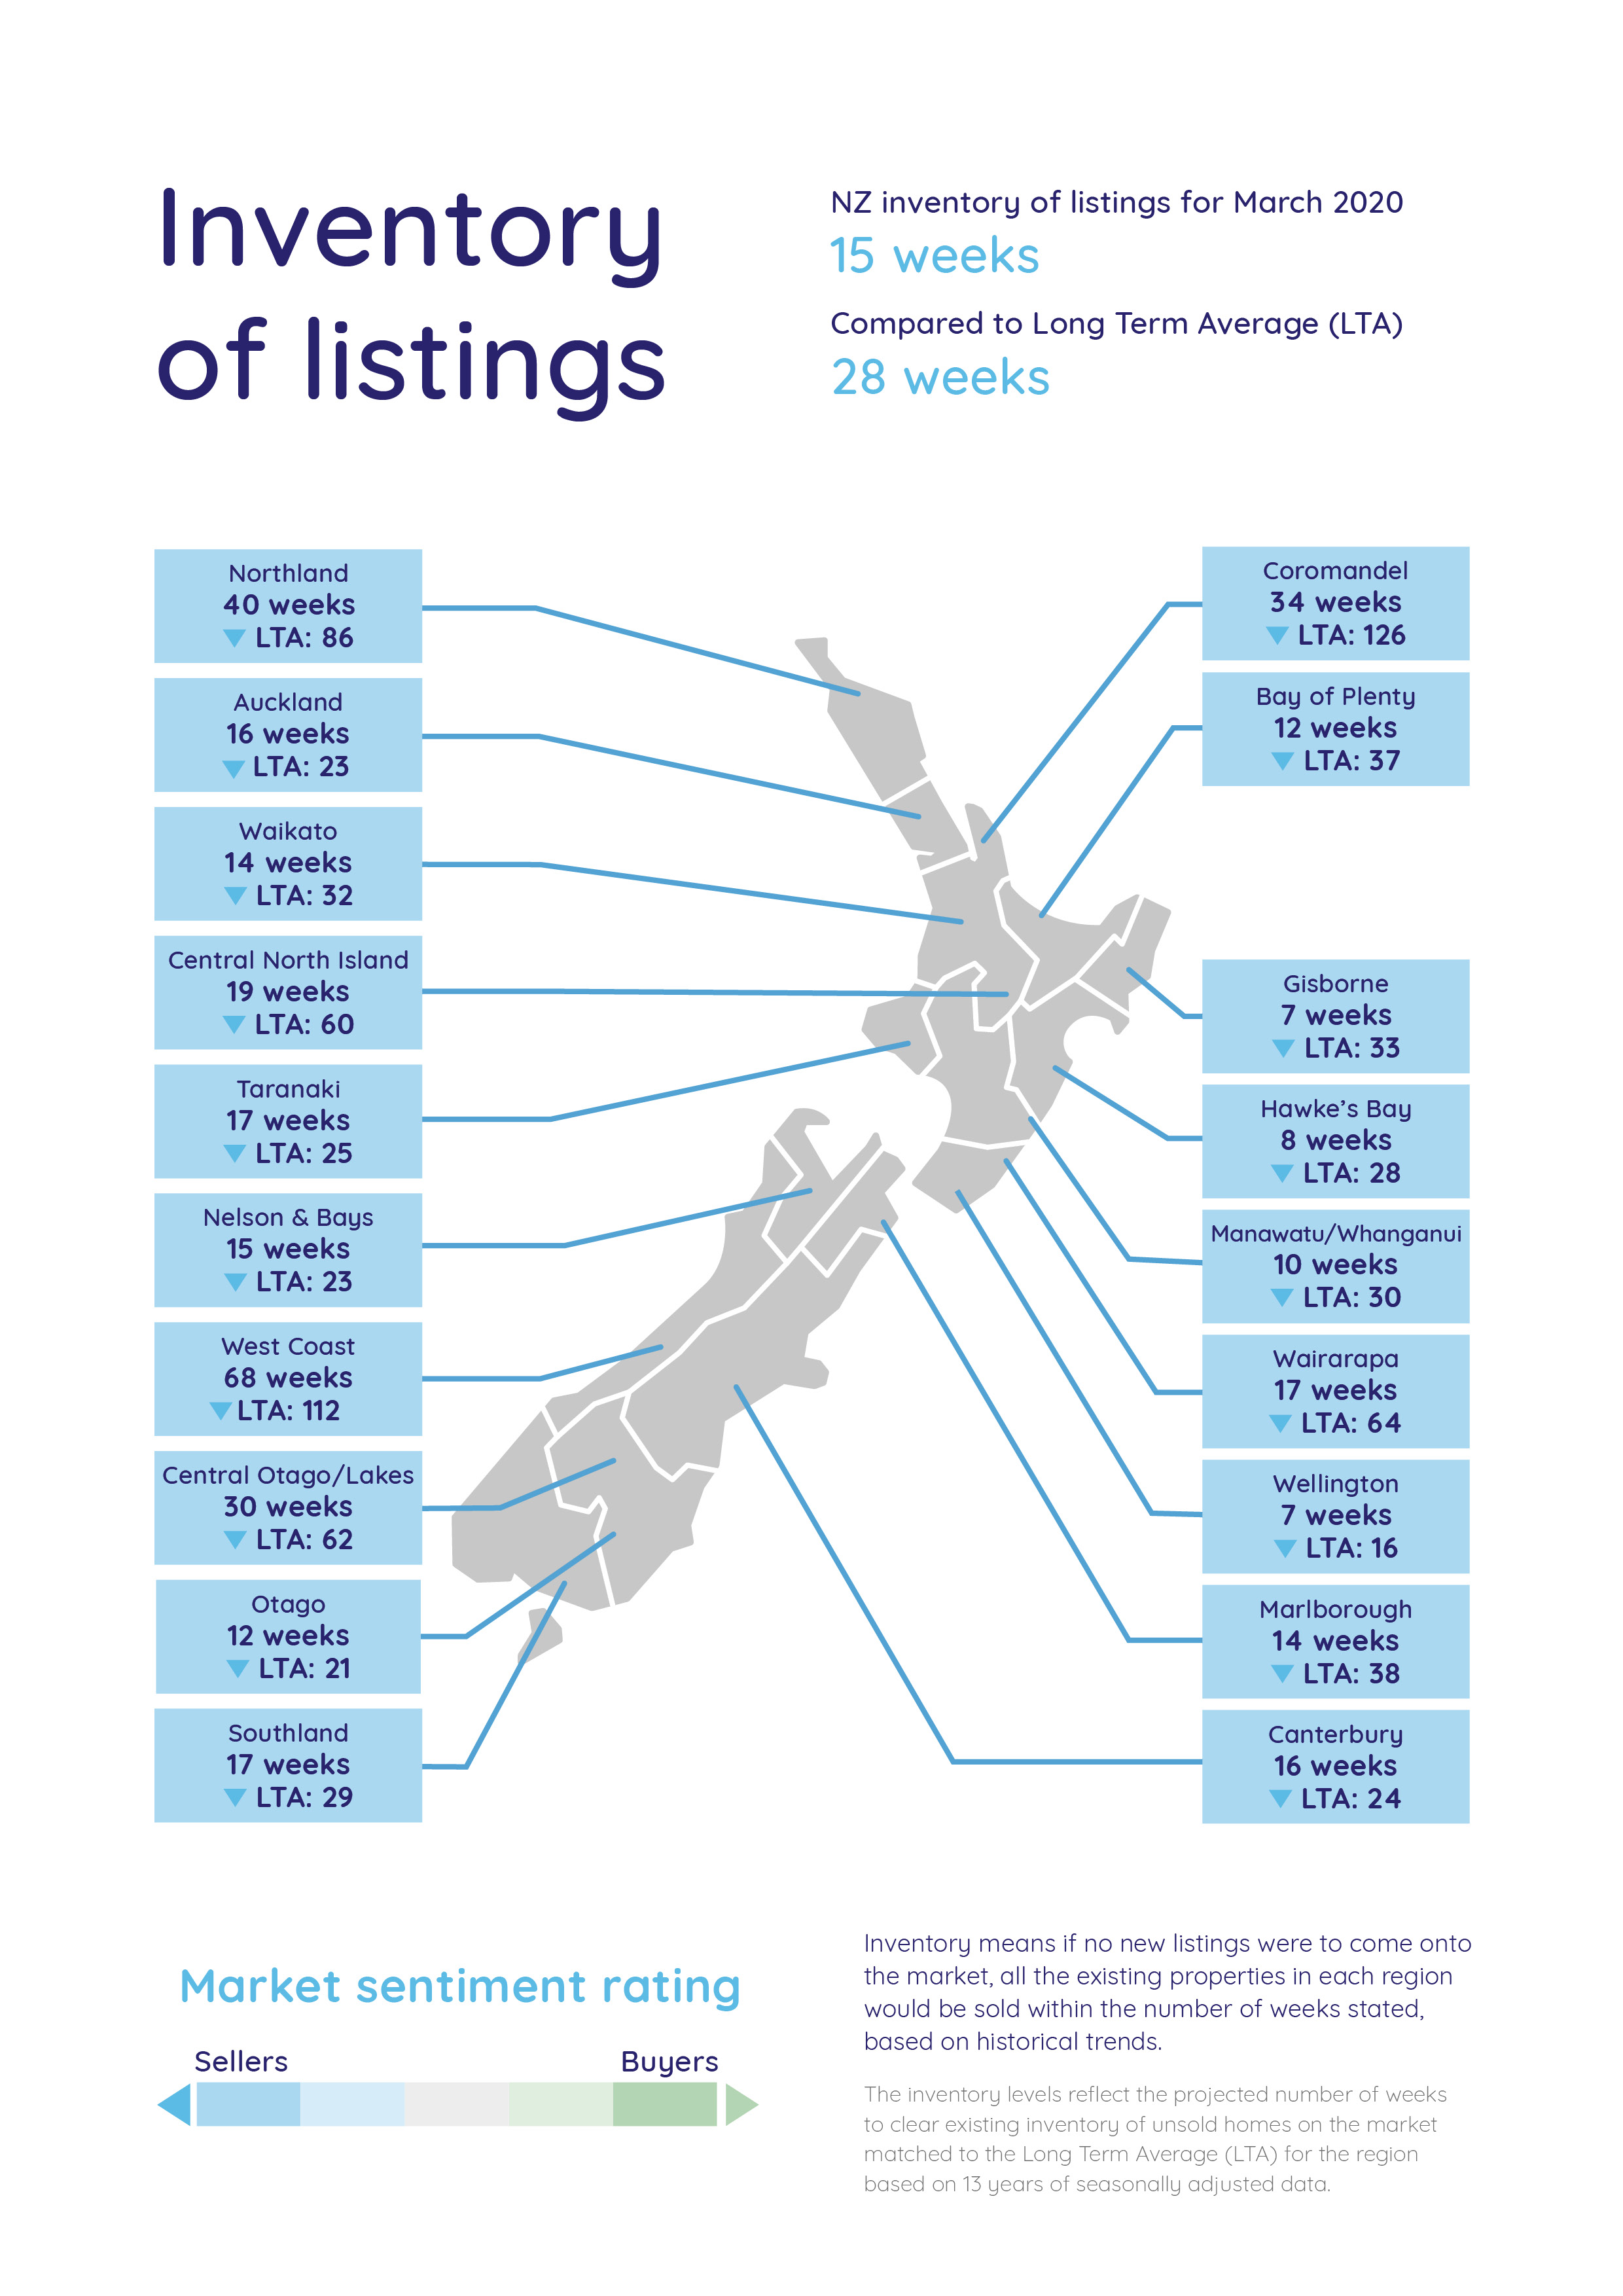
- Inventory is a measure of how long it would take, theoretically, to sell the current stock at current average rates of sale if no new properties were to be listed for sale. It provides a measure of the rate of turnover in the market.
- New listings are a record of all the new listings on realestate.co.nz for the relevant calendar month. As realestate.co.nz reflects 97% of all properties listed through registered estate agents in New Zealand, this gives a representative view of the New Zealand property market.
- Demand: the increase or decrease in the number of views per listing in that region, taken over a rolling three-month time frame, compared to the same three-month time frame the previous year – including the current month.
- Seasonal adjustment is a method realestate.co.nz uses to better represent the core underlying trend of the property market in New Zealand. This is done using methodology from the New Zealand Institute of Economic Research.
- Truncated mean is the method realestate.co.nz uses to provide statistically relevant asking prices. The top and bottom 10% of listings in each area are removed before the average is calculated, to prevent exceptional listings from providing false impressions.
01 Apr 2020

