
.svg)


Click here to download the NZ Property Report as a print-ready PDF file.
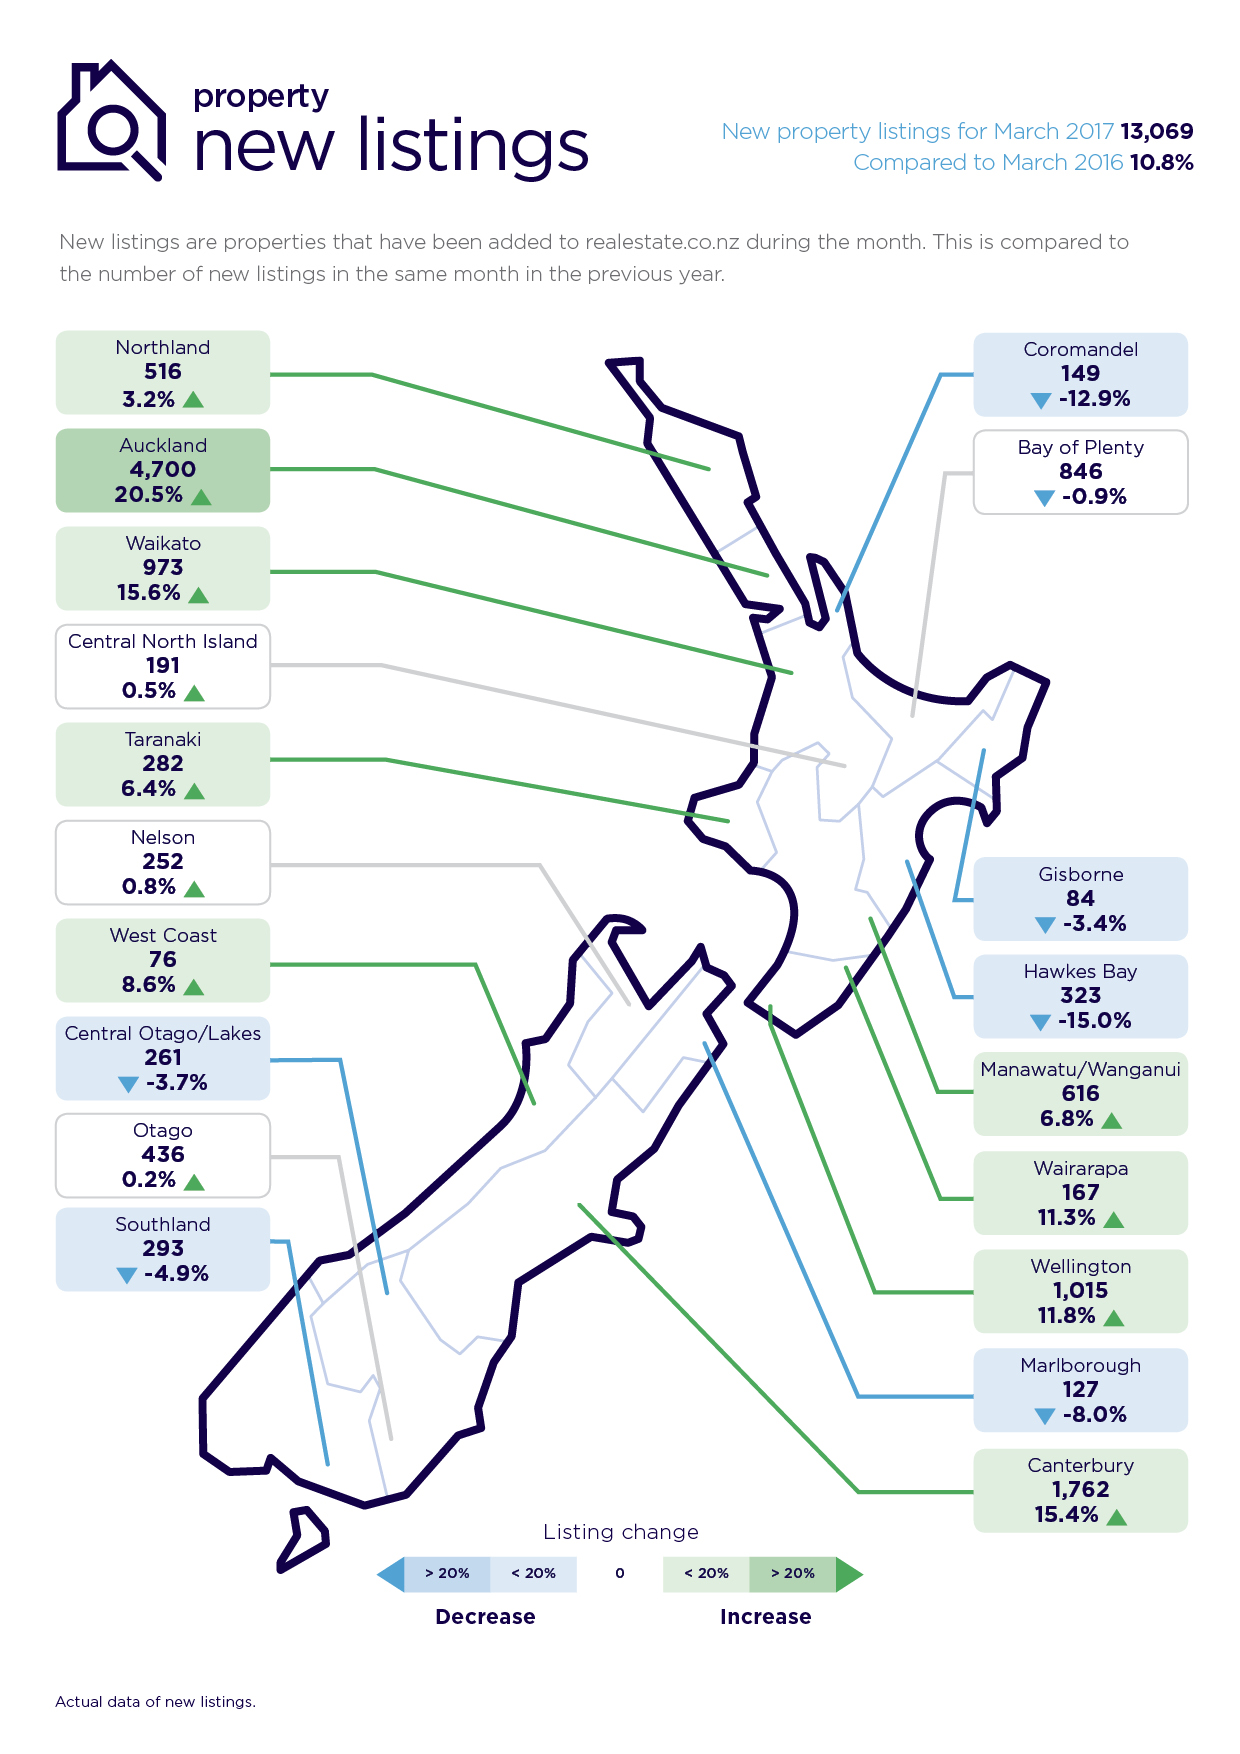
For only the second time* in our 10-year history of recording statistics, realestate.co.nz can report that nationally, the number of new residential listings in March exceeded the number of new listings for the month of February.
Real-time statistics from New Zealand’s biggest property listing site, show that this was led by the main regions of Auckland, Waikato, Wellington and Canterbury where new listings were up by double-digit growth compared to the same time the previous year. The Wairarapa also recorded double-digit growth in new property listings.
“March this year paints quite an interesting picture,” says realestate.co.nz spokesperson Vanessa Taylor.
“It could well be that after the volatile nature of 2016, potential sellers have taken on board that the market has been relatively flat in the past few months.
“If they’ve been talking about making a move on the property ladder, whether up, down, or even out of the region, they may have more confidence that their next purchase will be in the context of a more stable price environment,” she says.
Auckland leads the charge
Auckland led the charge for March new listings, with a 20.5 per cent increase in new listings compared with the same month in 2016.
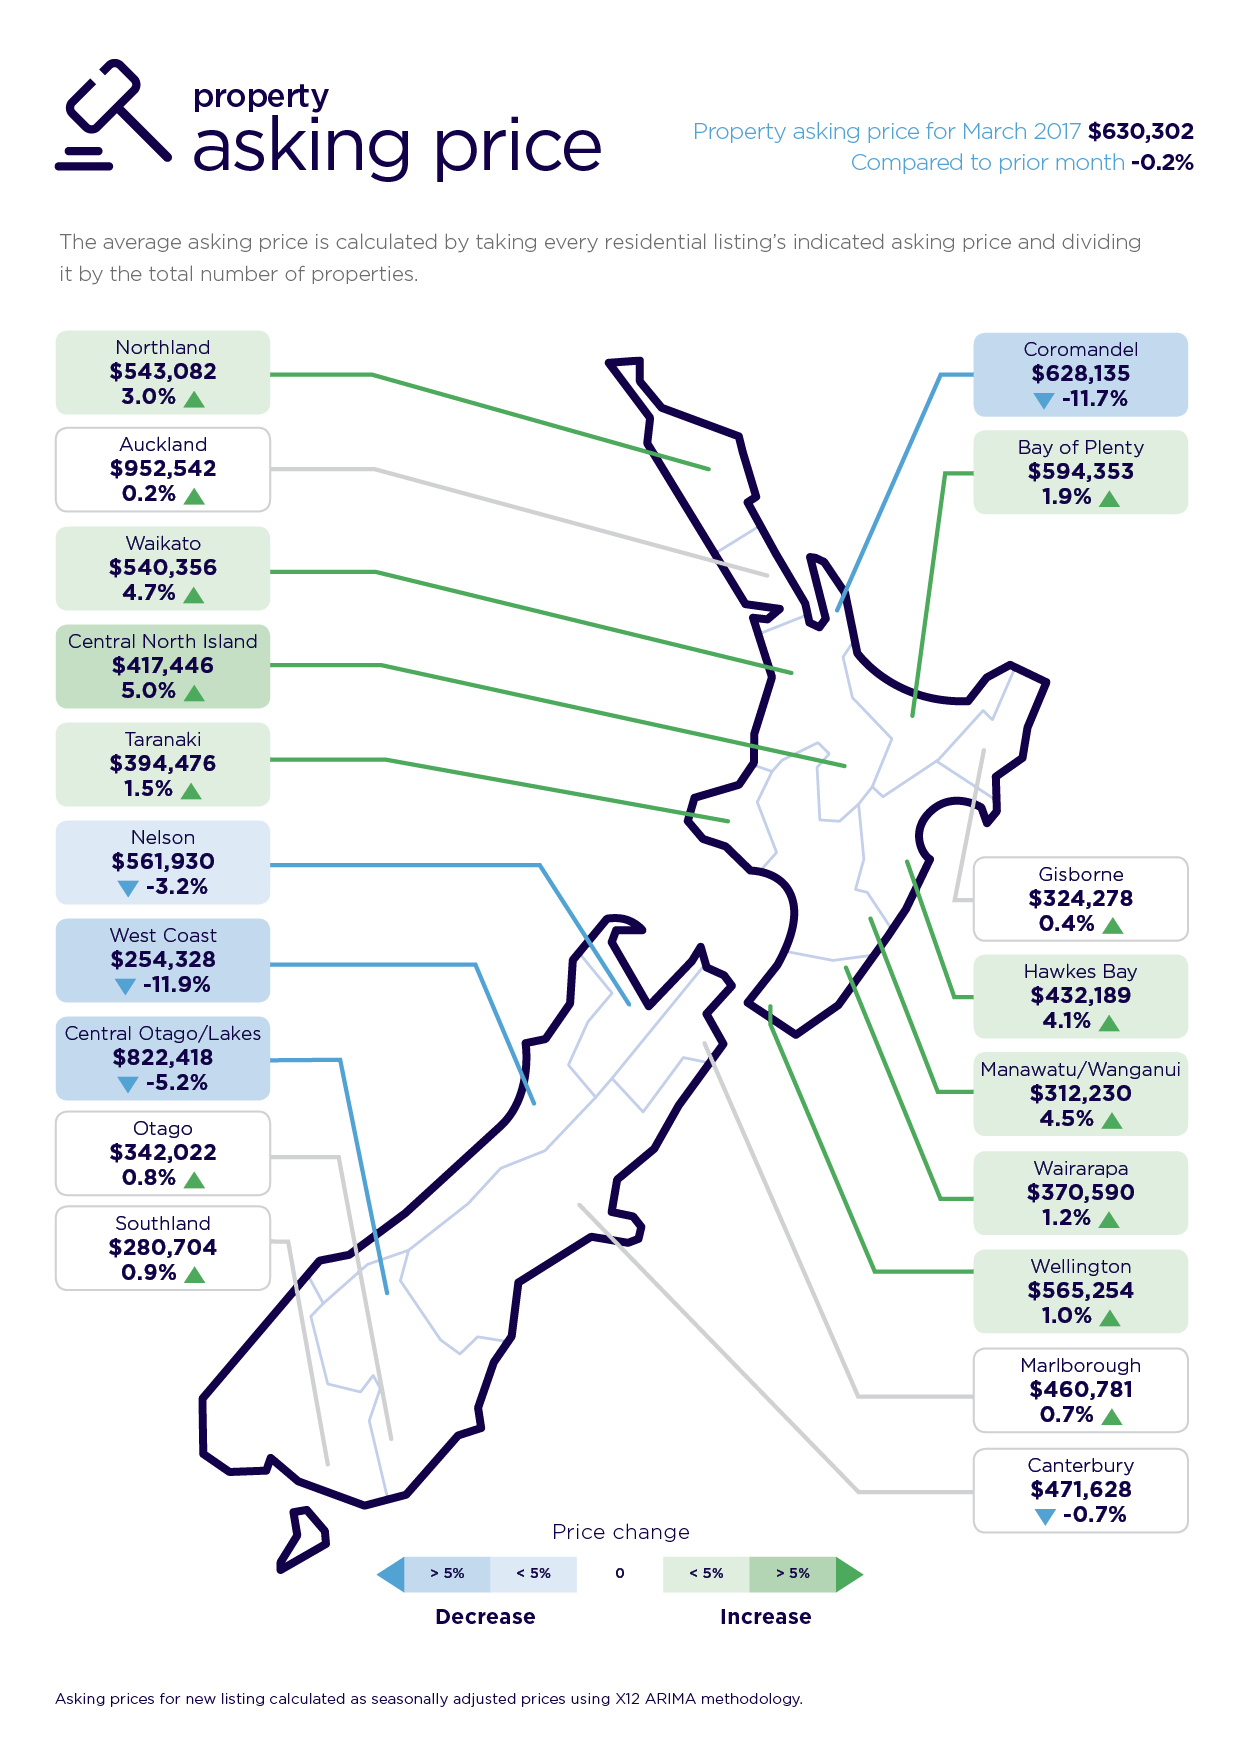
For home hunters in New Zealand’s largest city, there were 4,700 new residential property listings to view in March. At the same time asking prices in Auckland have remained static, with an average asking price of $952,542 in March.
“In 2016 Aucklanders saw residential properties achieving prices beyond expectations, with fierce competition fuelled by tight stock and increased buyer interest,” says Vanessa Taylor.
“It was a pretty challenging environment for some because if you sold a property, it was difficult to predict how long it would take you to find your new home and how much it would cost you,” she says.
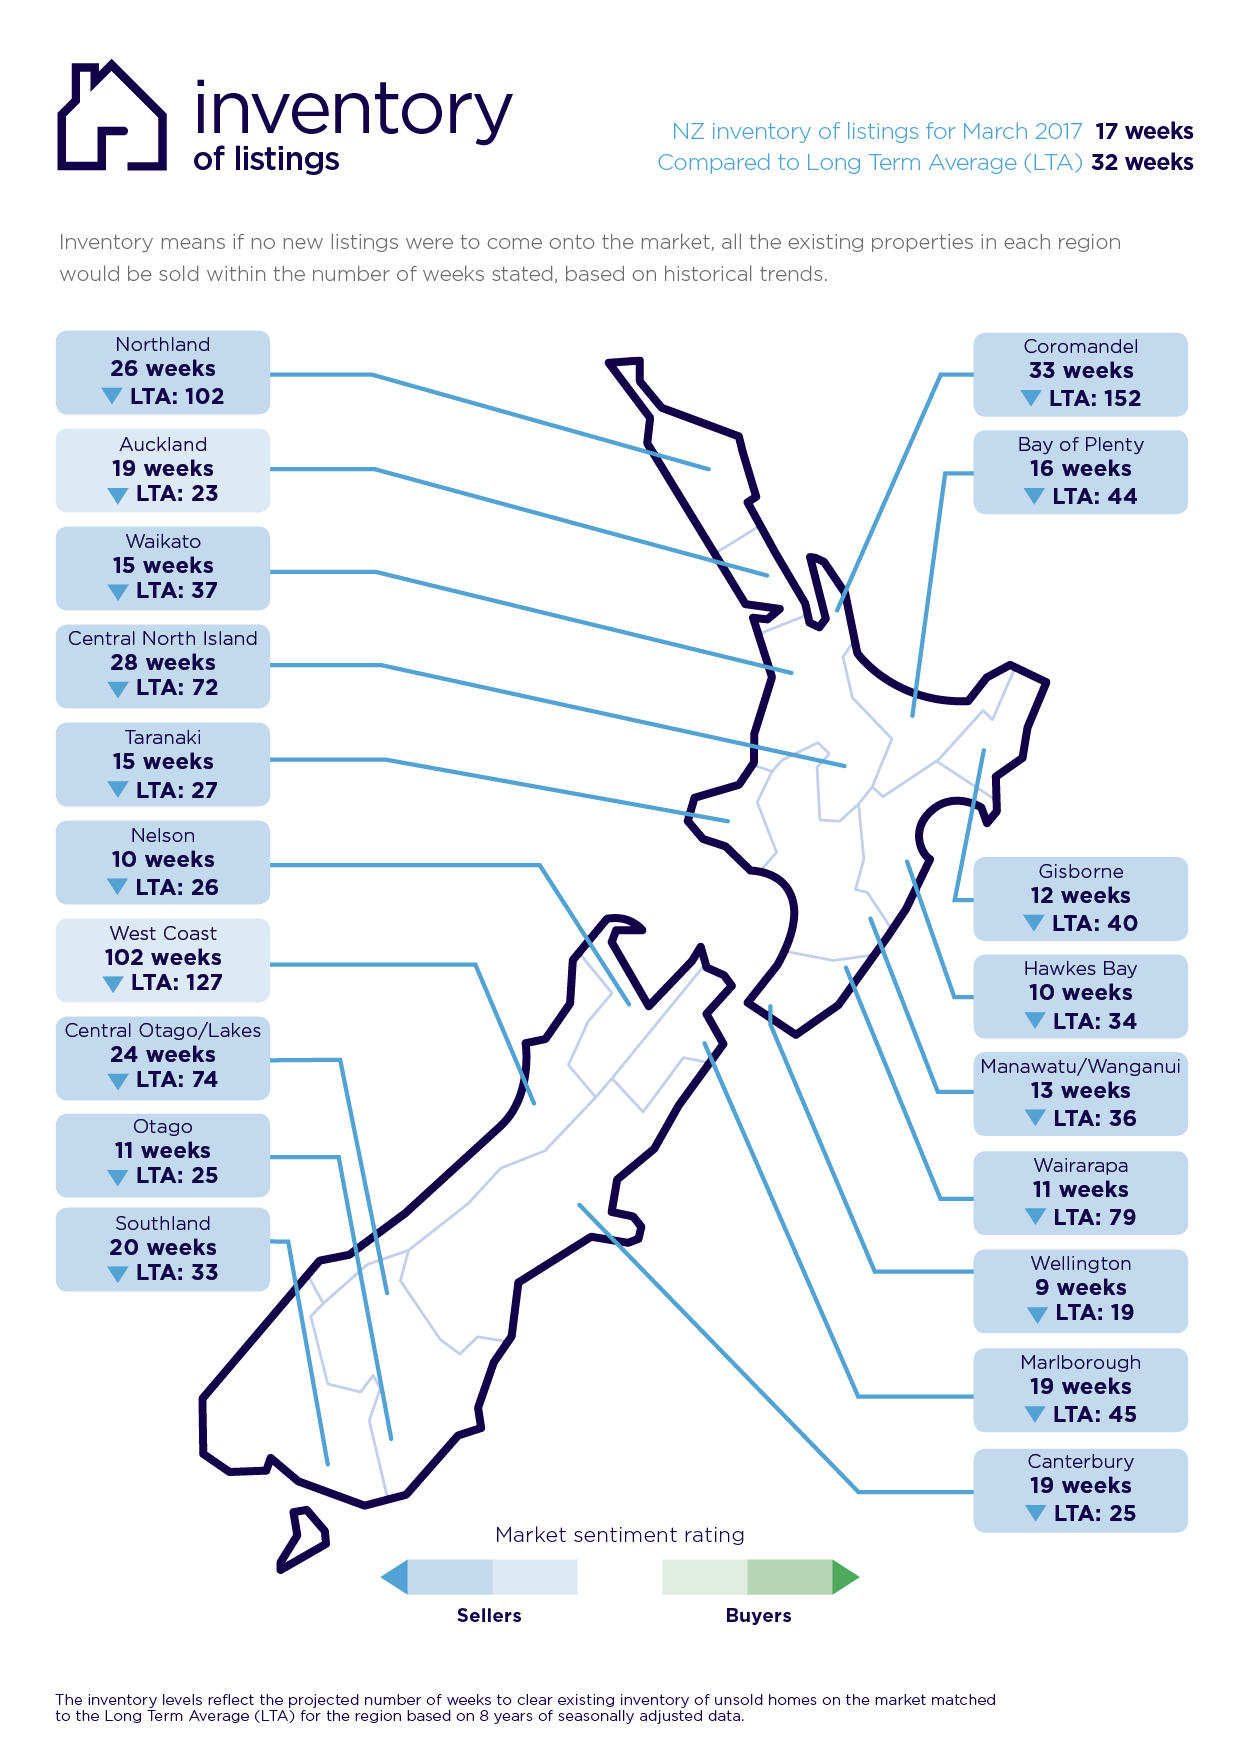
While the Auckland market topped the country with the greatest percentage and number of new listings, we have also seen the inventory levels grow. The long-term average in the Auckland region increased again from 18 weeks in February to 19 weeks in March, it got as low as 9 weeks in May 2016.
Inventory levels show that if no new houses came onto the market all the existing stock would take 19 weeks to sell out. The long-term average for the Auckland region is 23 weeks,
“More homes on the market is good news for buyers, with more choice and less competition for individual properties,” says Vanessa Taylor.
Waikato region paints a slightly different picture to neighbouring Auckland
New property listings in the Waikato region in March were also well up on February 2017 (11.7 per cent) but the total number of listings on the market were slightly down on the same time last year (-1.2 per cent), indicating a high turnover of properties.
While average asking prices remained static in Auckland, in the Waikato they went up 4.7 per cent from February and now sit at $540,356, hitting another all-time high.
“The Waikato region has been in the spotlight over the past two years, as Aucklanders looked to migrate southwards, fleeing inflated prices and the difficulty of entering the market,” says Vanessa Taylor.
Is the Wairarapa the “new Wellington?”
While the seat of power sits in New Zealand’s capital city of Wellington, all eyes are on the Wairarapa.
In March the Wairarapa was the “hottest” region in New Zealand, topping the chart with a 33.6 per cent leap in demand due to limited total stock in the area.
In both Wellington and the Wairarapa new listings were slightly up compared to the same time in 2016 (11.8 per cent and 11.3 per cent respectively).
However, the total number of houses on the market compared to the same month a year ago (March 2016) was dramatically different in the two regions.
The Wairarapa recorded the biggest drop in residential stock (down 44 per cent), while Wellington levels fell by 4.7 per cent.
“The Wellington region has been a tight market for some time, with fewer listings compared to other main centres.
“Potential buyers in the lower half of the North Island are being savvy when it comes to comparing opportunities,” says Vanessa Taylor.
“With the Wairarapa relatively close to the capital and asking prices on average a third cheaper, it could well be the peoples’ choice over the Wellington region,” she says.
Lift in new property listings in Canterbury region
In March new listings in the Canterbury region rose 15.4 per cent compared to the same time last year, however inventory levels were down compared to the region’s long term average.
Inventory levels in Canterbury show that if no new houses came onto the market and the existing stock all sold, in 19 weeks there would be no properties left for sale. Canterbury’s long term inventory average (LTA) is 25 weeks.
*The first time was March 2014.
Click here to download the NZ Property Report as a print-ready PDF file.
Glossary of terms
Being the only provider of real estate data in real time, realestate.co.nz offers valuable property market information not available from other sources.
• Average asking price gives an indication of current market sentiment. Statistically, asking prices tend to correlate closely with the sales prices recorded in future months when those properties are sold. As it looks at different data, average asking prices may differ from recorded sales data released at the same time.
• Inventory is a measure of how long it would take, theoretically, to sell the current stock at current average rates of sale if no new properties were to be listed for sale. It provides a measure of the rate of turnover in the market.
• New listings are a record of all the new listings on realestate.co.nz for the relevant calendar month. As realestate.co.nz reflects 97 per cent of all properties listed through registered estate agents in New Zealand, this gives a representative view of the New Zealand property market.
• Seasonal adjustment is a method realestate.co.nz uses to better represent the core underlying trend of the property market in New Zealand. This is done using methodology from the New Zealand Institute of Economic Research.
• Truncated mean is the method realestate.co.nz uses to provide statistically relevant asking prices.
The top and bottom 10 per cent of listings in each area are removed before the average is calculated, to prevent exceptional listings from providing false impressions.
• Demand: the comparative view per listing change, by new listing in the previous 3 months compared to the same time last year
Share
-
.svg)
.svg)
.svg)