
.svg)


Average asking prices steady in most regions month-on-month. Buyers' markets no more nationally, nor for Wellington or Otago.
The latest data from realestate.co.nz shows the number of new listings added to the site in February was lower than any February since records began 16 years ago.
Vanessa Williams, spokesperson for realestate.co.nz, says February is typically a busy time for vendors; however, the challenges many Kiwis have faced over the last month will undoubtedly have an impact.
Last month saw several national trends sweeping the country. However, a few regions were 'exceptions to the rule'. While every region across the motu saw drops, Nelson & Bays saw new listings increase by 7.0% during February compared to last year. Meanwhile, with a 9.8% drop, Wellington didn't conform to the year-on-year stock increases which prevailed in every other region.
Average asking prices also remained relatively steady last month compared to January, except for Gisborne, where average asking prices hit an all-time high of $749,306.
"The general sentiment of Kiwis has an impact on the property market, and there has been a lot of uncertainty recently," says Vanessa.
She also adds that New Zealanders typically hold off on making big financial decisions during election years.
New listings lowest on record for February. Down everywhere except Nelson & Bays.
New listings were down in all regions, bar one, reflecting the 16-year record low for February last month. New listings were down 29.5%, with the biggest decreases across the country in Gisborne (down 54.4%), Wellington (down 47.0%), and Hawke's Bay (down 43.5%).
Nelson & Bays saw new listings up by 7.0% in February compared to last year. New listing numbers in the region, which has also been in a buyers' market for the last four months, have been trending upward since August last year. 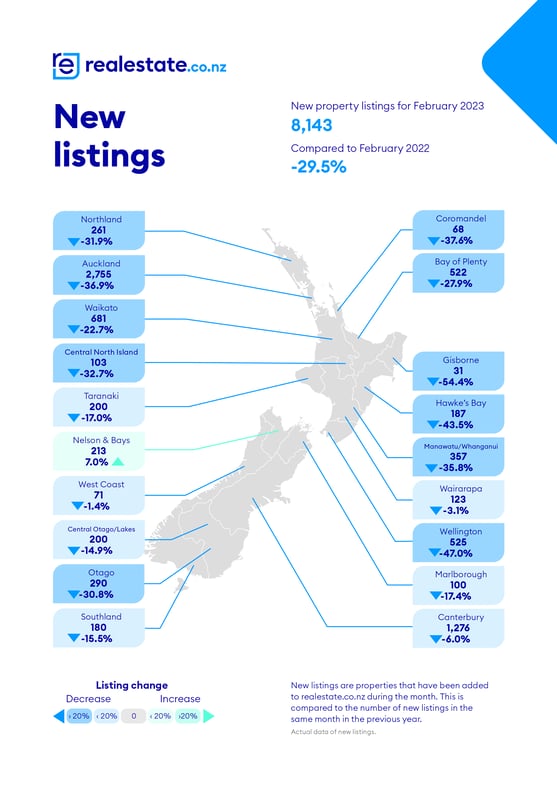 Average asking prices steady month-on-month.
Average asking prices around the country were steady last month, with most variances sitting between 0.0% and 3.0% compared to January. The only regions where prices increased by more than 5% compared to January 2023 were Taranaki (up 10.0%), Gisborne (up 8.8%), and Southland (up 7.7%).
"In January, we saw the average asking price in Southland dip 8.1% to just below $500,000, so seeing the region's average asking price back up to $537,646 will be welcome news for some," Vanessa explains.
In addition, the Gisborne region hit a record high in February, with average asking prices reaching $749,306 for the first time since records began 16 years ago. The last time the region saw prices hit an all-time high was in November 2021. 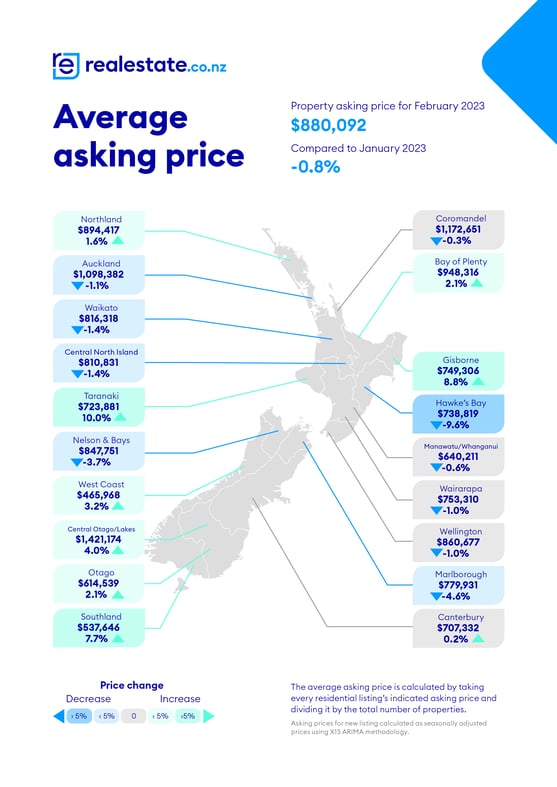 Stock up everywhere except Wellington.
Following on from high stock levels of late, the number of homes for sale was up in nearly all regions in February. The two biggest increases in stock were in Coromandel (up 123.9%) and Nelson & Bays (up 99.8%).
"These two regions also saw the biggest year-on-year stock increases in January, so it will be interesting to watch what happens in these regions in the coming months," says Vanessa.
Wellington, which saw stock drop by 9.8% compared to February 2022, was the only exception.
Vanessa shares that this indicates that stock is starting to move in the capital.
"We see a similar story when we look at inventory for Wellington. The capital was the first to tip into a buyers' market during 2022 and the first to see a year-on-year drop in total stock out of all the regions nationally.
"This is the first time Wellington has seen a year-on-year total stock decrease since August 2021."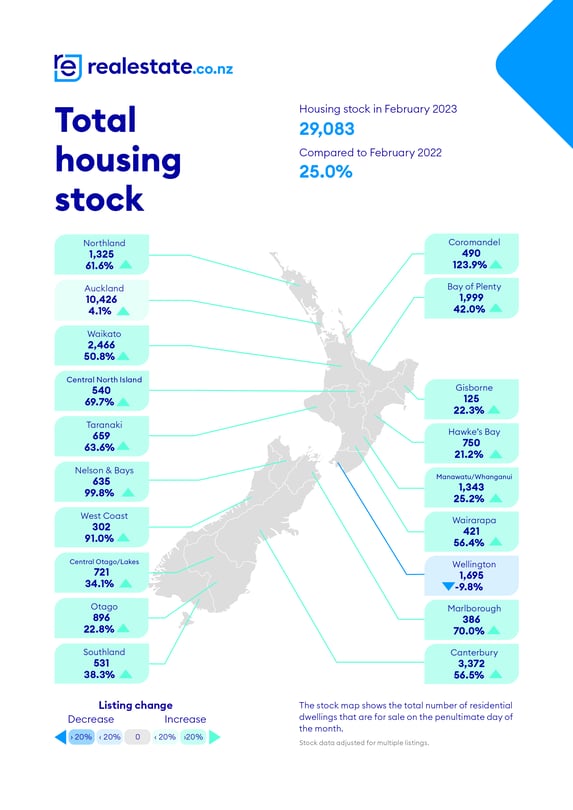 Buyers' markets pull back into four regions.
Wellington, Otago, and the national market tipped back to favouring sellers last month, leaving just four regions favouring buyers in February.
Vanessa explains that market sentiment gives us an indication of the feeling in the market:
"A buyers' market tells us the turnover is slower in those regions. In other words, the demand is not as high as a year ago when we rarely saw buyers' markets emerging.
"Last month, however, we saw some of our buyers' markets weaken. That is, inventory in Auckland, Waikato, and Taranaki sat closer to the region's long-term average than in January. This signalled demand inched closer to supply during February."
She reminds Kiwis that the market isn't something inherently good or bad for buyers or sellers at any given time:
"People often think of the property market as a game to win or lose, but we need to reframe our thinking here. Whether you are trying to get to that first rung on the ladder, looking for your forever home, or considering property as an investment, it is a decision to make based on your circumstances."
Vanessa adds that we can only spot peaks and troughs when we look backwards.
"Likening the property market to a game is like putting up the goalposts after a game of rugby and awarding points to the team who scored the most tries over invisible lines."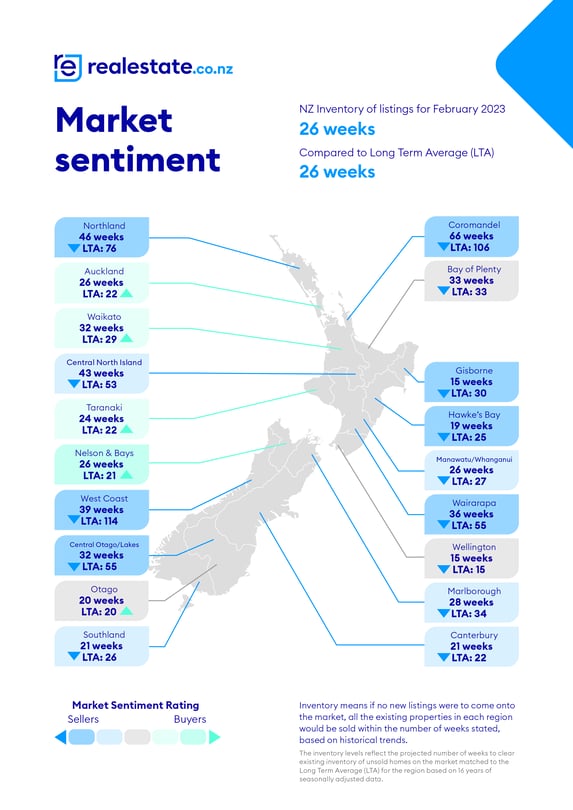 For media enquiries, please contact:
Hannah Franklin | hannah@realestate.co.nz
About realestate.co.nz
As New Zealand’s longest-standing property website, realestate.co.nz’s mission is to empower New Zealanders with a property search tool they can use to find the life they want to live. With residential, lifestyle, rural and commercial property listings, realestate.co.nz is the place to start for those looking to buy or sell property.
Whatever life you’re searching for, it all starts here.
Glossary of terms:
Average asking price (AAP) is neither a valuation nor the sale price. It is an indication of current market sentiment. Statistically, asking prices tend to correlate closely with the sales prices recorded in future months when those properties are sold. As it looks at different data, average asking prices may differ from recorded sales data released simultaneously.
New listings are a record of all the new residential dwellings listed for sale on realestate.co.nz for the relevant calendar month. The site reflects 97% of all properties listed through licensed real estate agents and major developers in New Zealand. This description gives a representative view of the New Zealand property market.
Stock is the total number of residential dwellings that are for sale on realestate.co.nz on the penultimate day of the month.
Inventory is a measure of how long it would take, theoretically, to sell the current stock at current average rates of sale if no new properties were to be listed for sale. It provides a measure of the rate of turnover in the market.
Seasonal adjustment is a method realestate.co.nz uses to represent better the core underlying trend of the property market in New Zealand. This is done using methodology from the New Zealand Institute of Economic Research.
Truncated mean is the method realestate.co.nz uses to supply statistically relevant asking prices. The top and bottom 10% of listings in each area are removed before the average is calculated to prevent exceptional listings from providing false impressions.
Share
-
.svg)
.svg)
.svg)