
.svg)


Total stock growth slows and average asking prices down in most regions – except Central Otago/Lakes.
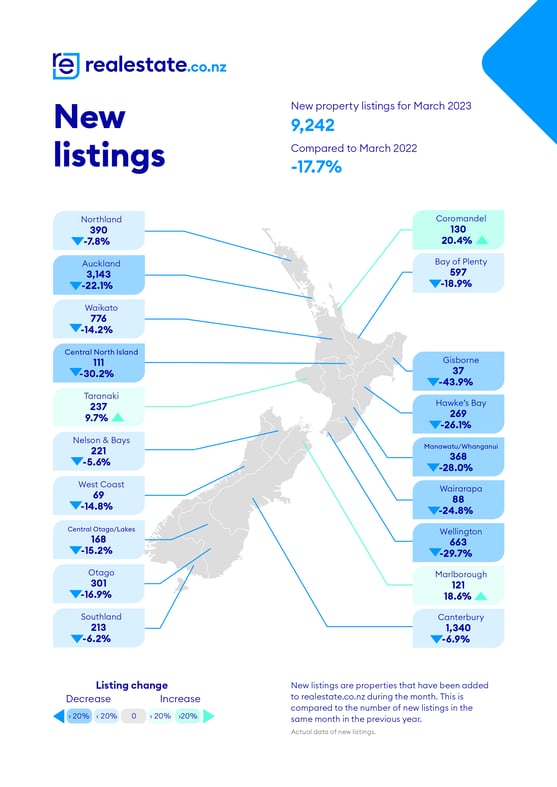
The latest data from realestate.co.nz shows that new listings hitting the market were at a record low last month compared to every other March since 2007. Only 9,242 new listings went up for sale in March 2023 - just over half of the 17,867 that hit the market in March 2007.
Year-on-year, new listings were down by 17.7%, which indicates vendors are sitting tight, according to spokesperson for realestate.co.nz, Vanessa Williams.
"Kiwis love property. But in times of uncertainty, we tend to delay decisions to buy or sell. I think that is what we are seeing here.
"We saw a similar thing in March 2020 when high levels of uncertainty with the arrival of Covid-19 and the coming election saw people hitting pause on listing their homes for sale. Listings dropped by 16.5% in March 2020 compared to the previous year as people waited to see what would happen. Fast forward to March 2021, however, and we saw more normal listing levels of 11,322."
New listings down in all regions except Coromandel, Marlborough and Taranaki
The biggest year-on-year drops in new listings were Gisborne (down 43.9%), Central North Island (down 30.2%), Wellington (down 29.7%), Manawatu/Whanganui (down 28.0%), Hawke’s Bay (down 26.1%), Wairarapa (down 24.8%), and Auckland (-22.1%).
Bucking the trend, however, Coromandel, Marlborough and Taranaki saw new listings increase by 20.4%, 18.6% and 9.7%, respectively.
"The number of people searching on realestate.co.nz for property in Coromandel and Taranaki was also up last month compared to February. This tells us that demand in these regions is still strong," says Vanessa.
The most popular suburbs for users searching in these regions were Whangamata (for Coromandel), Hawera (for Taranaki) and Picton (for Marlborough).
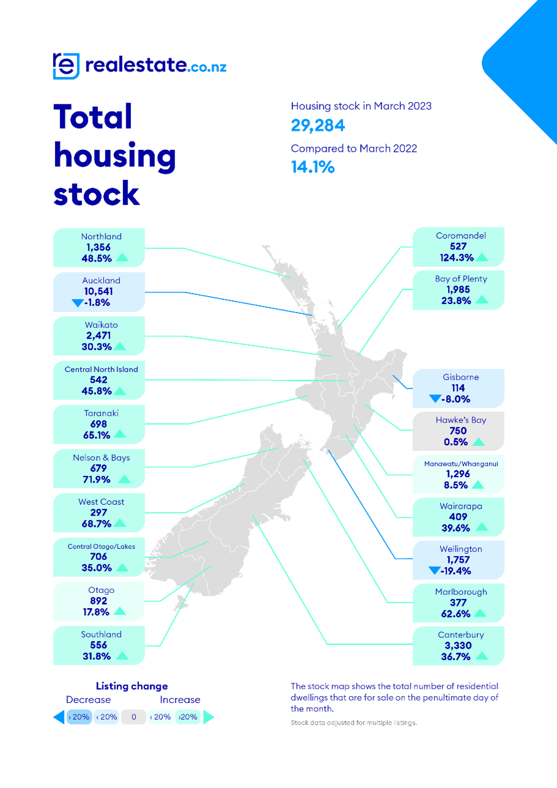
Stock growth slows
In contrast to the massive increases in stock seen over the last few months, total stock growth slowed during March. Coromandel was the only region that saw stock increase during March by more than 100% year-on-year.
Three regions last month also saw their stock levels decline. Compared to March 2022, stock decreased by 19.4% in Wellington, 8.0% in Gisborne, and 1.8% in Auckland. Notably, Wellington was the only region where stock also dropped during February.
Vanessa says this might be a very early sign of a shift in these markets.
"New listings coming onto the market have been low since the beginning of 2023, and I think we are going to start to see this decline reflected in stock levels as the current inventory starts to sell out," says Vanessa.
Nationally, stock was up 14.1% last month compared to March 2022.
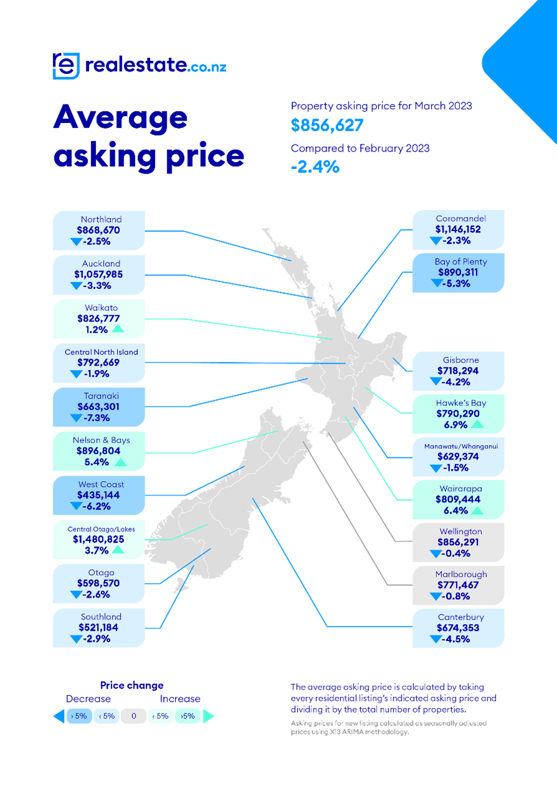
Average asking prices down in most regions, but lifestyle hotspot continues to soar
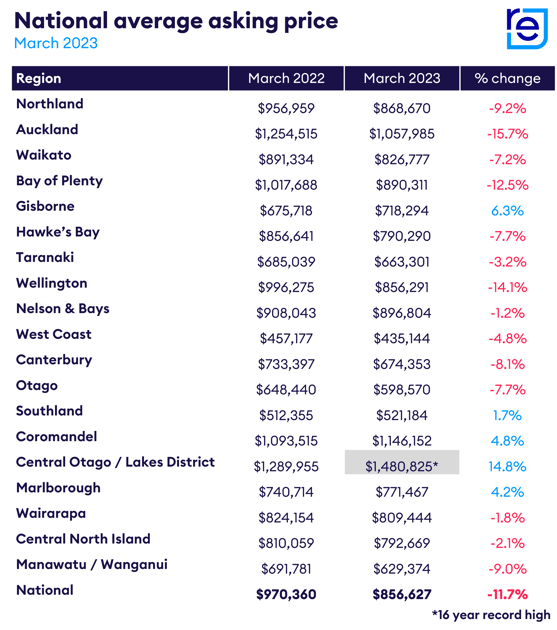
Compared to March 2022, average asking prices were down in most regions and the national average asking price was down 11.7% to $856,627.
However, going against the grain was Central Otago/Lakes, where the average asking price hit $1,480,825 - an all-time high since our records began 16 years ago.
Vanessa says the average asking price in the region is significantly higher than in any other region around New Zealand.
"At close to $1.5 million, average asking prices in the Central Otago/Lakes region surpass those in our main centres, which is interesting given it is not a commercial hub where we see higher demand for property and therefore higher prices."
Vanessa believes that the lifestyle is a big drawcard for those looking to buy in that area, with Wanaka, Cromwell and Jacks Point being the most searched suburbs in the region and Queenstown being the most searched keyword.
"The overwhelming majority of those searching for property in the region are located in Auckland. I suspect that, for some, the ease of a plane ride between the two locations makes this region appealing.," says Vanessa.
She adds that the number of users searching in this region increased by more than 5% last month compared to February 2023.
The only other places where average asking prices increased compared to March 2022 were Gisborne, Southland, Coromandel, and Marlborough.
Vanessa encourages buyers and sellers to keep up with the latest changes in the property market. realestate.co.nz has a market insights tool to help searchers deep dive into suburb-specific data. She also reminds people to always consider any property market information alongside their personal circumstances.
"Your lifestyle all starts with where you choose to live," says Vanessa.
For media enquiries, please contact:
Hannah Franklin | hannah@realestate.co.nz
About realestate.co.nz
As New Zealand’s longest-standing property website, realestate.co.nz’s mission is to empower New Zealanders with a property search tool they can use to find the life they want to live. With residential, lifestyle, rural and commercial property listings, realestate.co.nz is the place to start for those looking to buy or sell property.
Whatever life you’re searching for, it all starts here.
Want more property insights?
- Market Insights: Search by suburb to see median sale prices, popular property types and trends over time.
- Sold properties: Switch your search to sold to see the last 12 months of sales and prices.
- Valuations: Get a gauge on property prices by browsing comparable property sales.
Glossary of terms:
Average asking price (AAP) is neither a valuation nor the sale price. It is an indication of current market sentiment. Statistically, asking prices tend to correlate closely with the sales prices recorded in future months when those properties are sold. As it looks at different data, average asking prices may differ from recorded sales data released simultaneously.
New listings are a record of all the new residential dwellings listed for sale on realestate.co.nz for the relevant calendar month. The site reflects 97% of all properties listed through licensed real estate agents and major developers in New Zealand. This description gives a representative view of the New Zealand property market.
Stock is the total number of residential dwellings that are for sale on realestate.co.nz on the penultimate day of the month.
Inventory is a measure of how long it would take, theoretically, to sell the current stock at current average rates of sale if no new properties were to be listed for sale. It provides a measure of the rate of turnover in the market.
Seasonal adjustment is a method realestate.co.nz uses to represent better the core underlying trend of the property market in New Zealand. This is done using methodology from the New Zealand Institute of Economic Research.
Truncated mean is the method realestate.co.nz uses to supply statistically relevant asking prices. The top and bottom 10% of listings in each area are removed before the average is calculated to prevent exceptional listings from providing false impressions.
Share
-
.svg)
.svg)
.svg)