
.svg)


All-time low for new house listings across New Zealand while asking prices continue to climb despite increasing total stock numbers
Real-time statistics from realestate.co.nz show that nationally, in December, the average asking price hit an all-time high while new listings dropped to the lowest level on record.
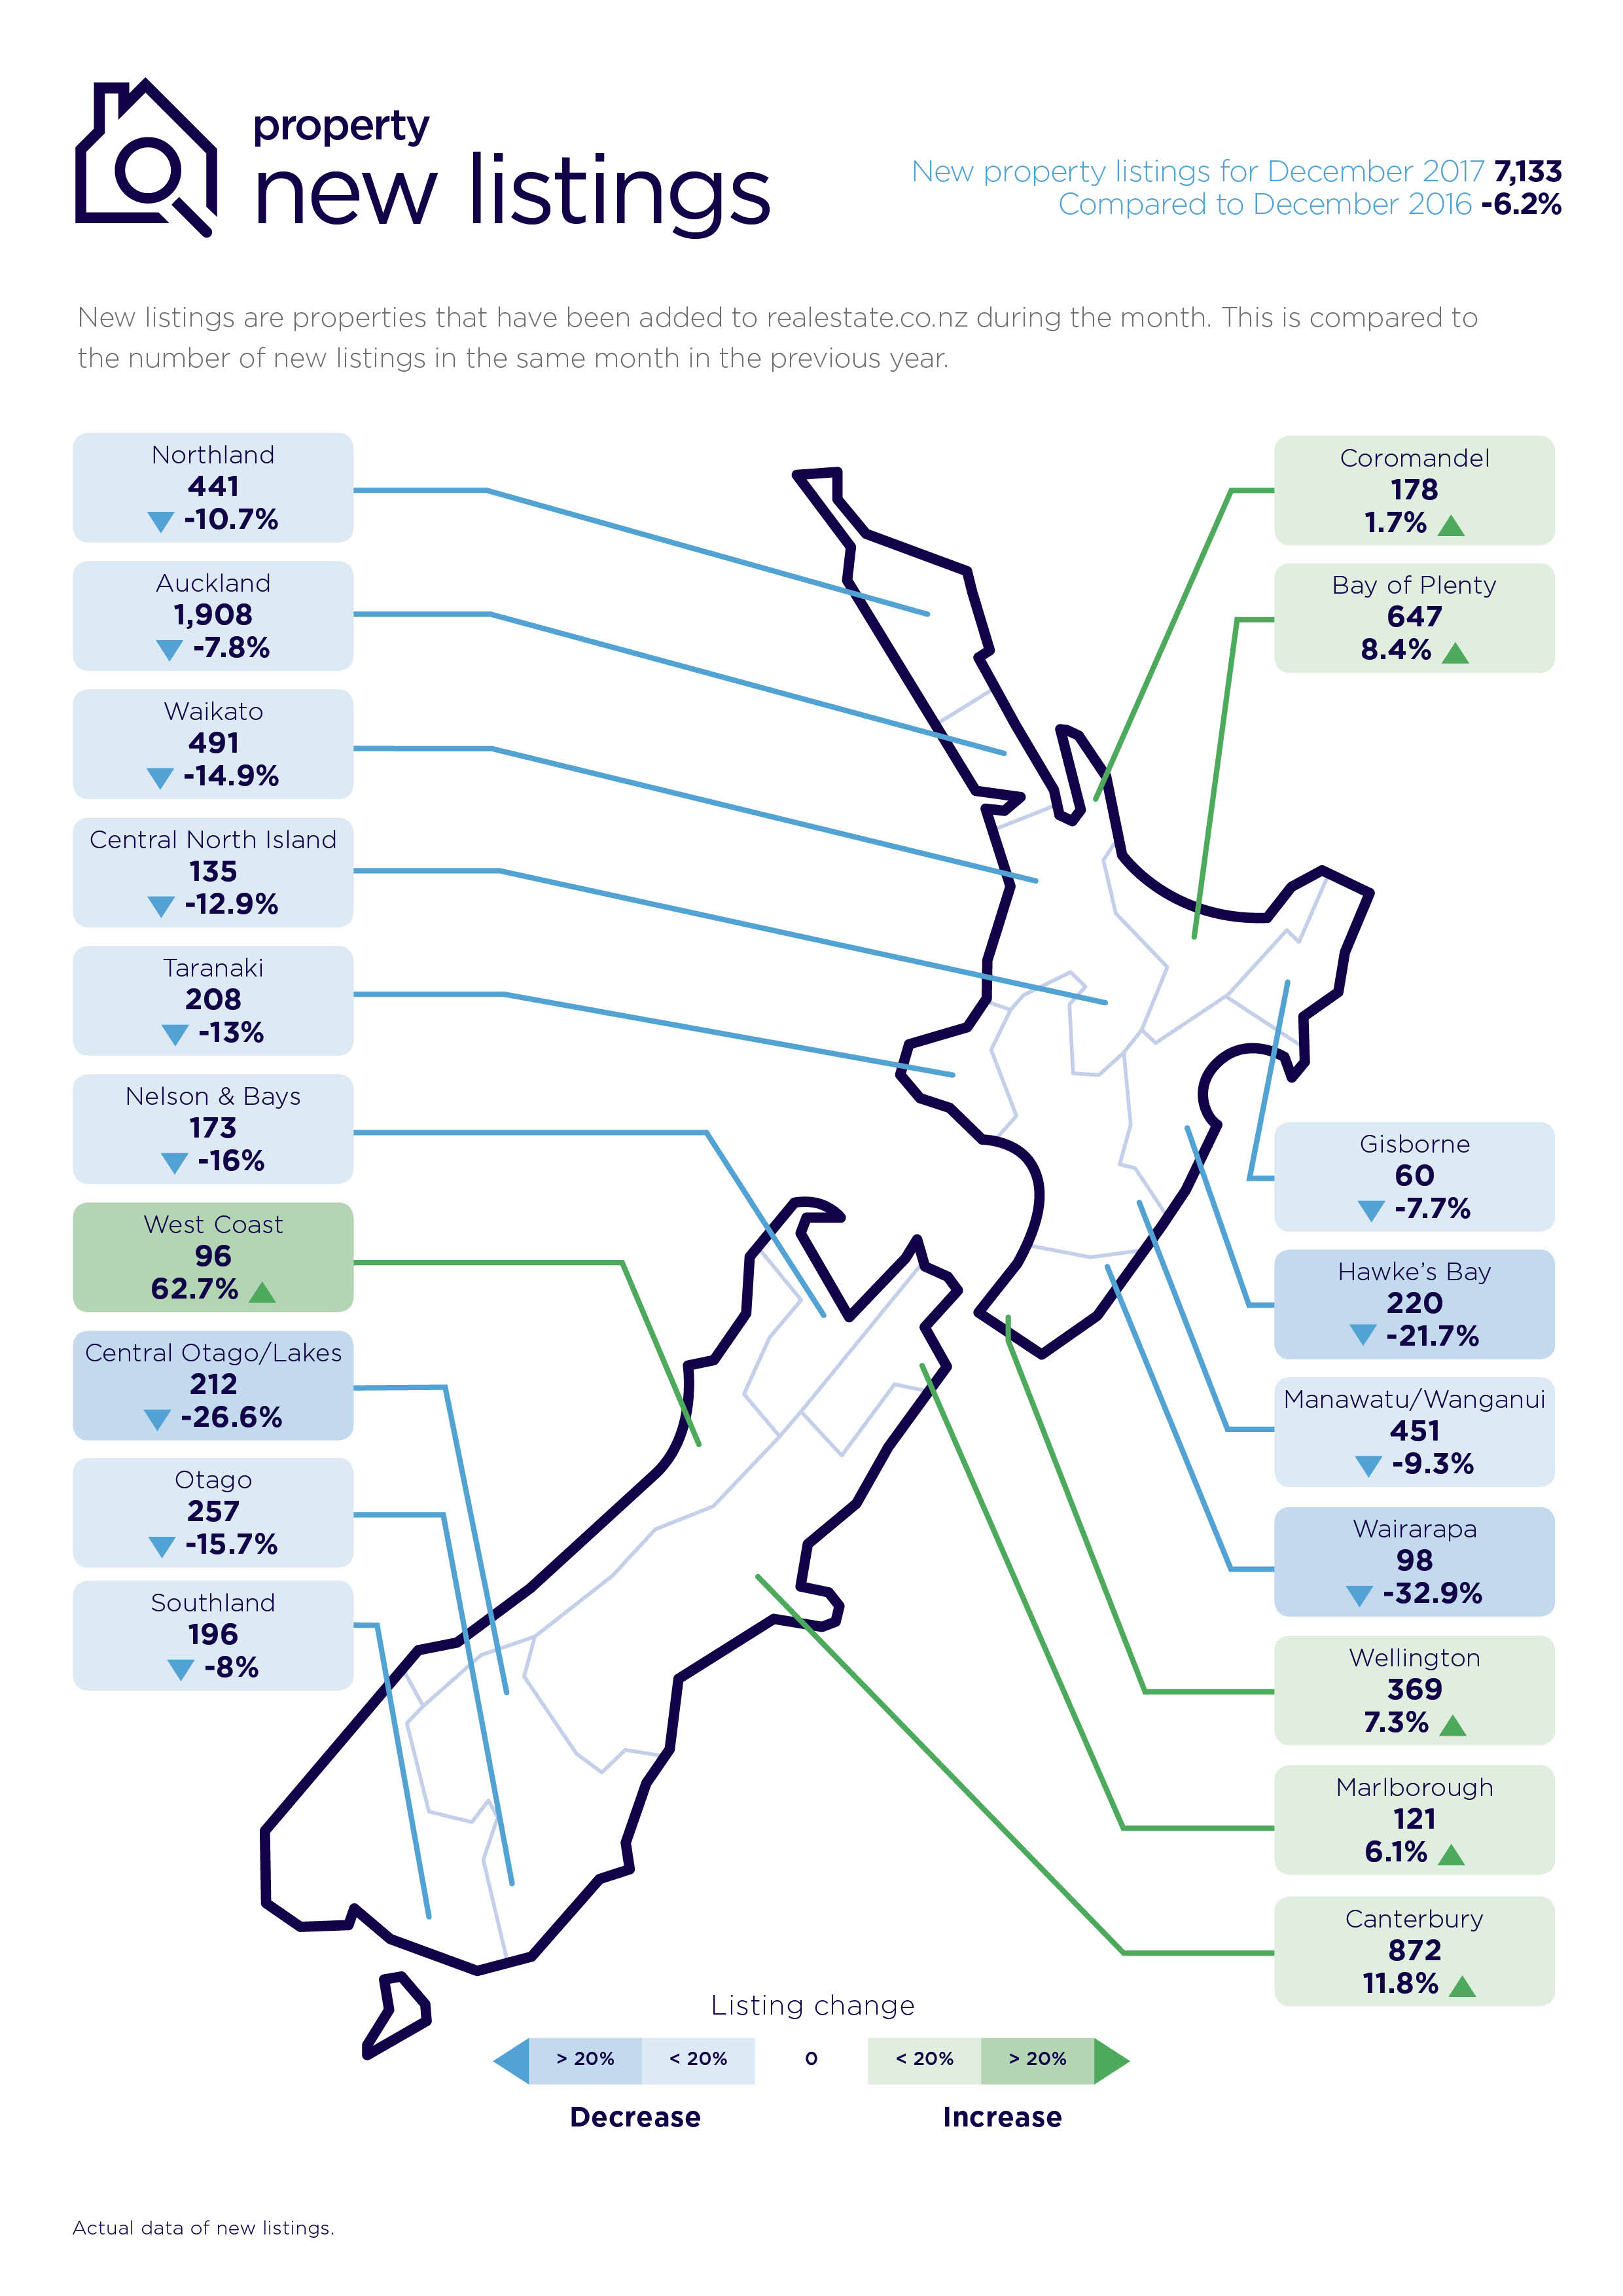
The latest figures show new listings are down 6.2 per cent in December compared with December 2016 – just 7,133 compared with 7,606 – and are at an all-time low. The average asking price hit $660,798 up 3.8 per cent from November 2017.
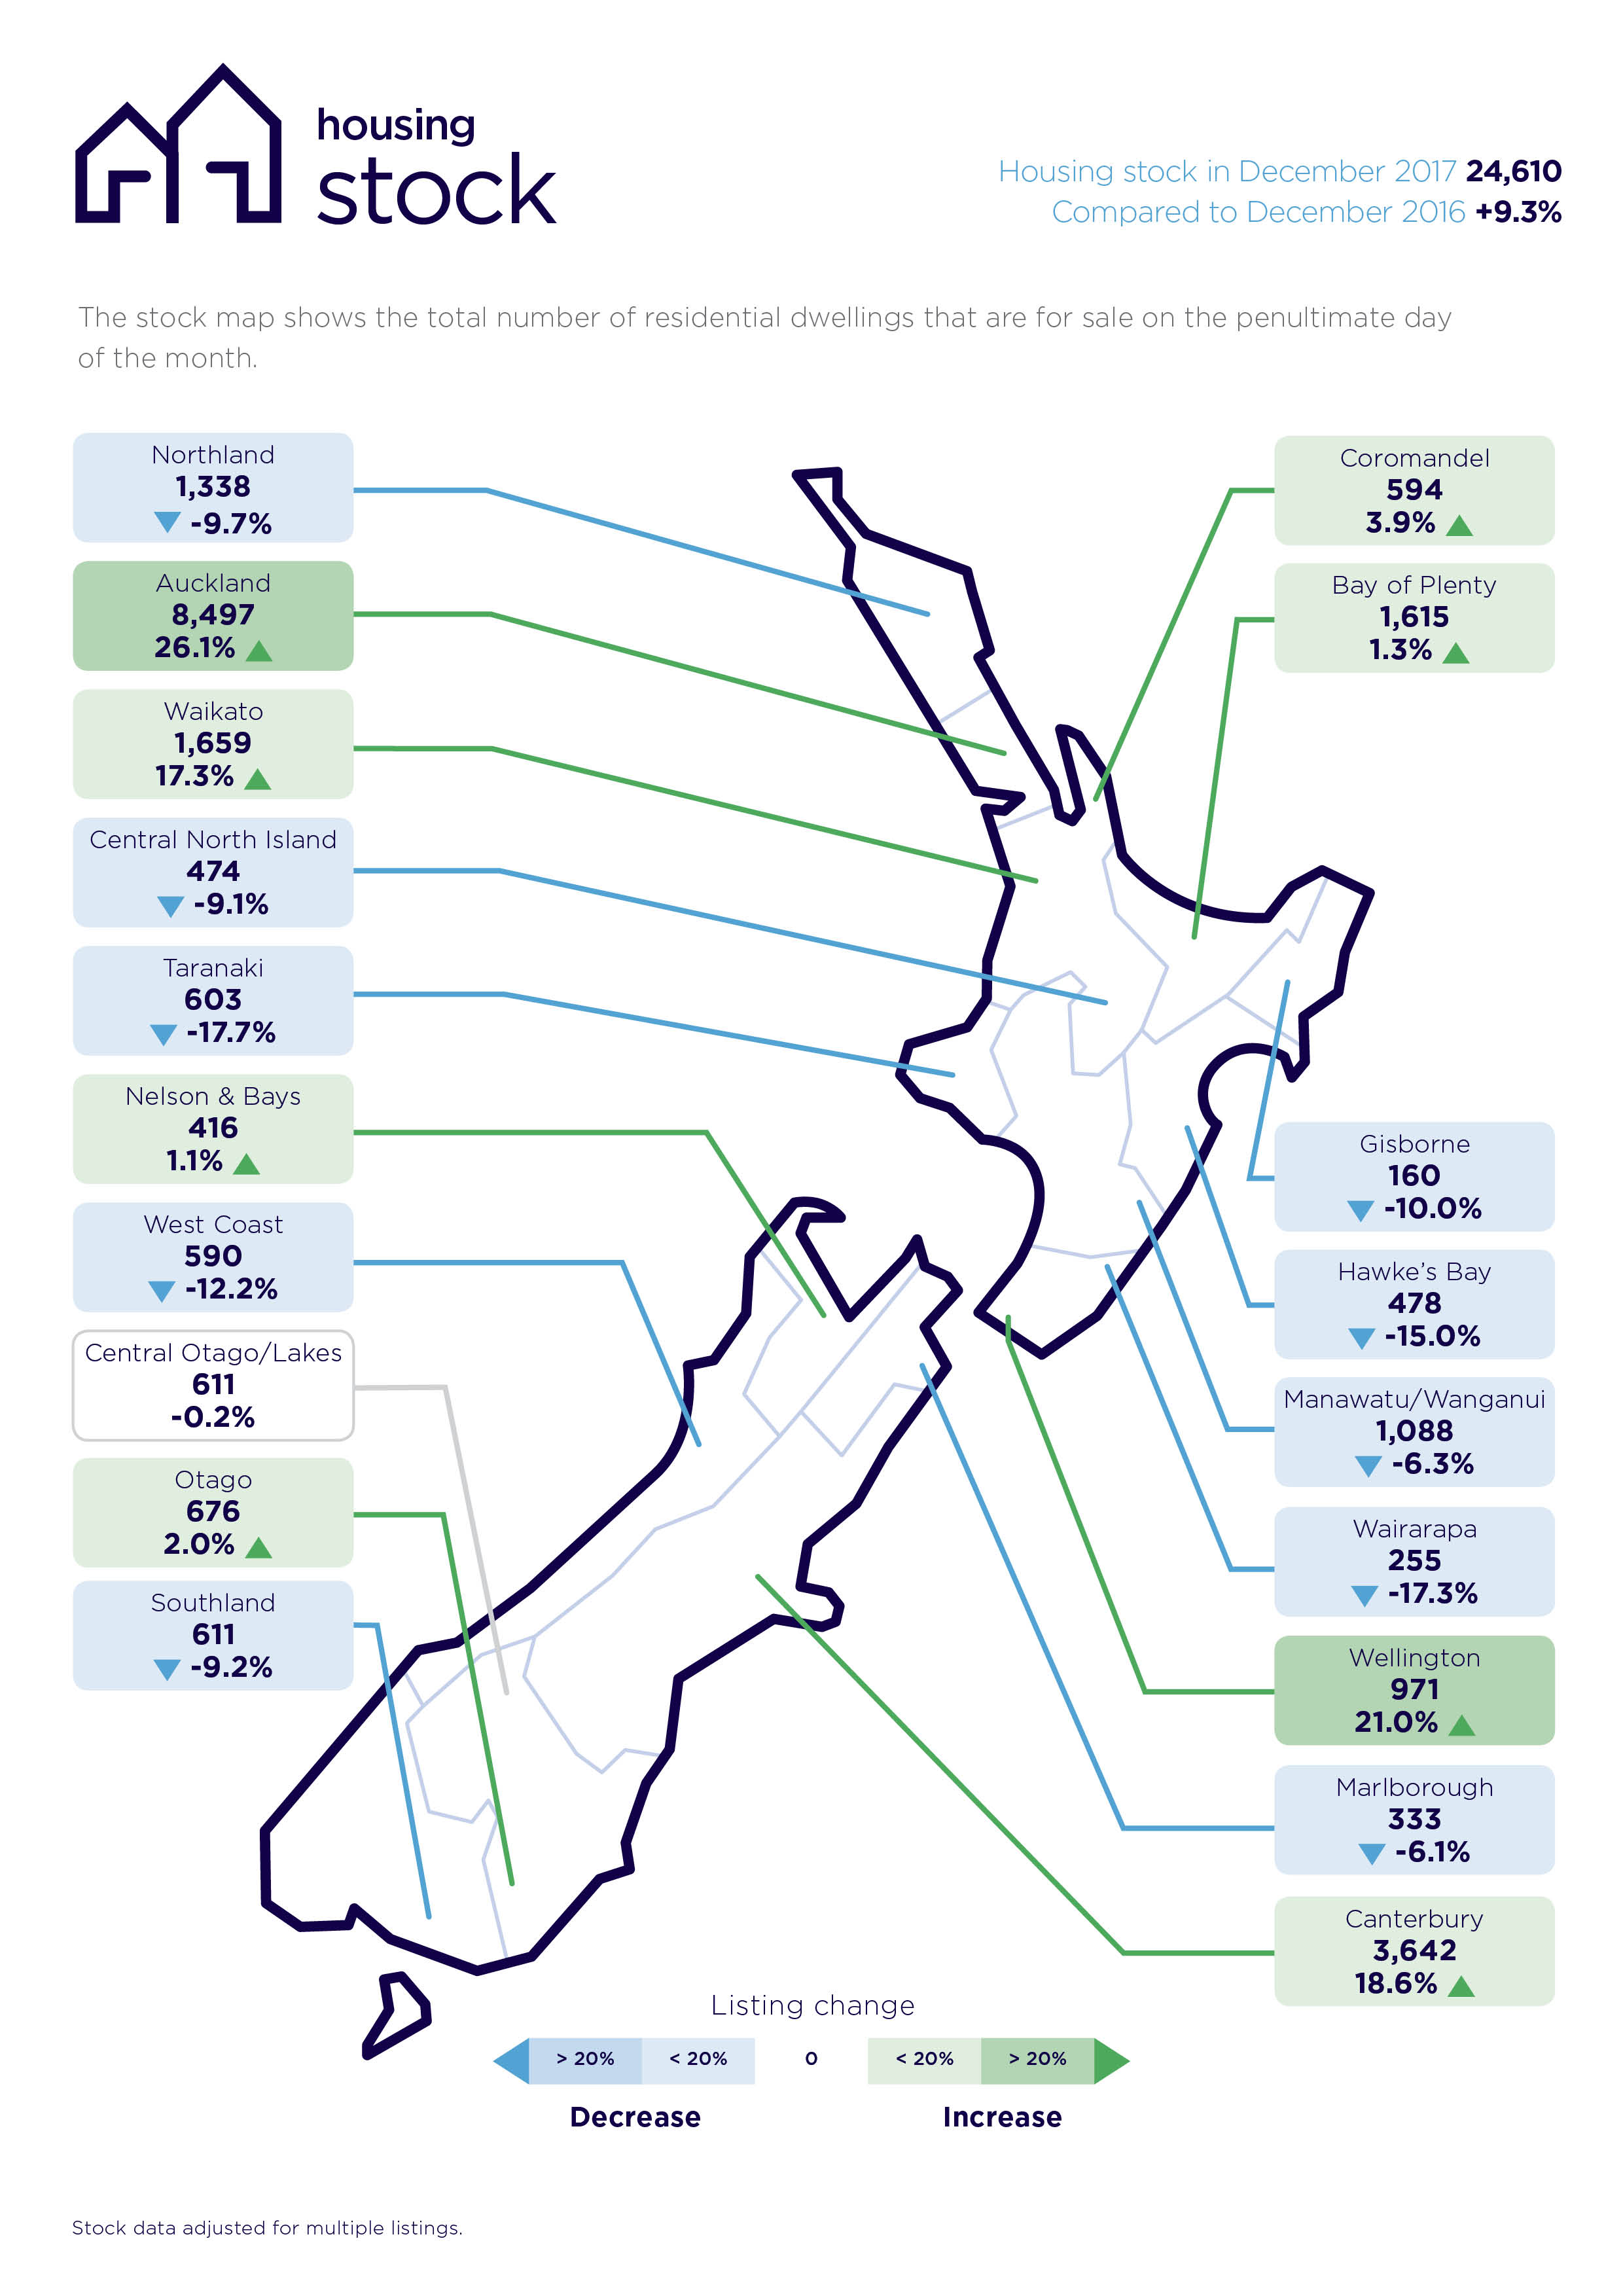
Total housing stock continues to build, up 9.3 per cent when compared with December 2016.
Auckland leads the charge
Auckland has painted an interesting picture over the summer break moving from a sellers’ market to a buyers’ market – the first time since February 2011.
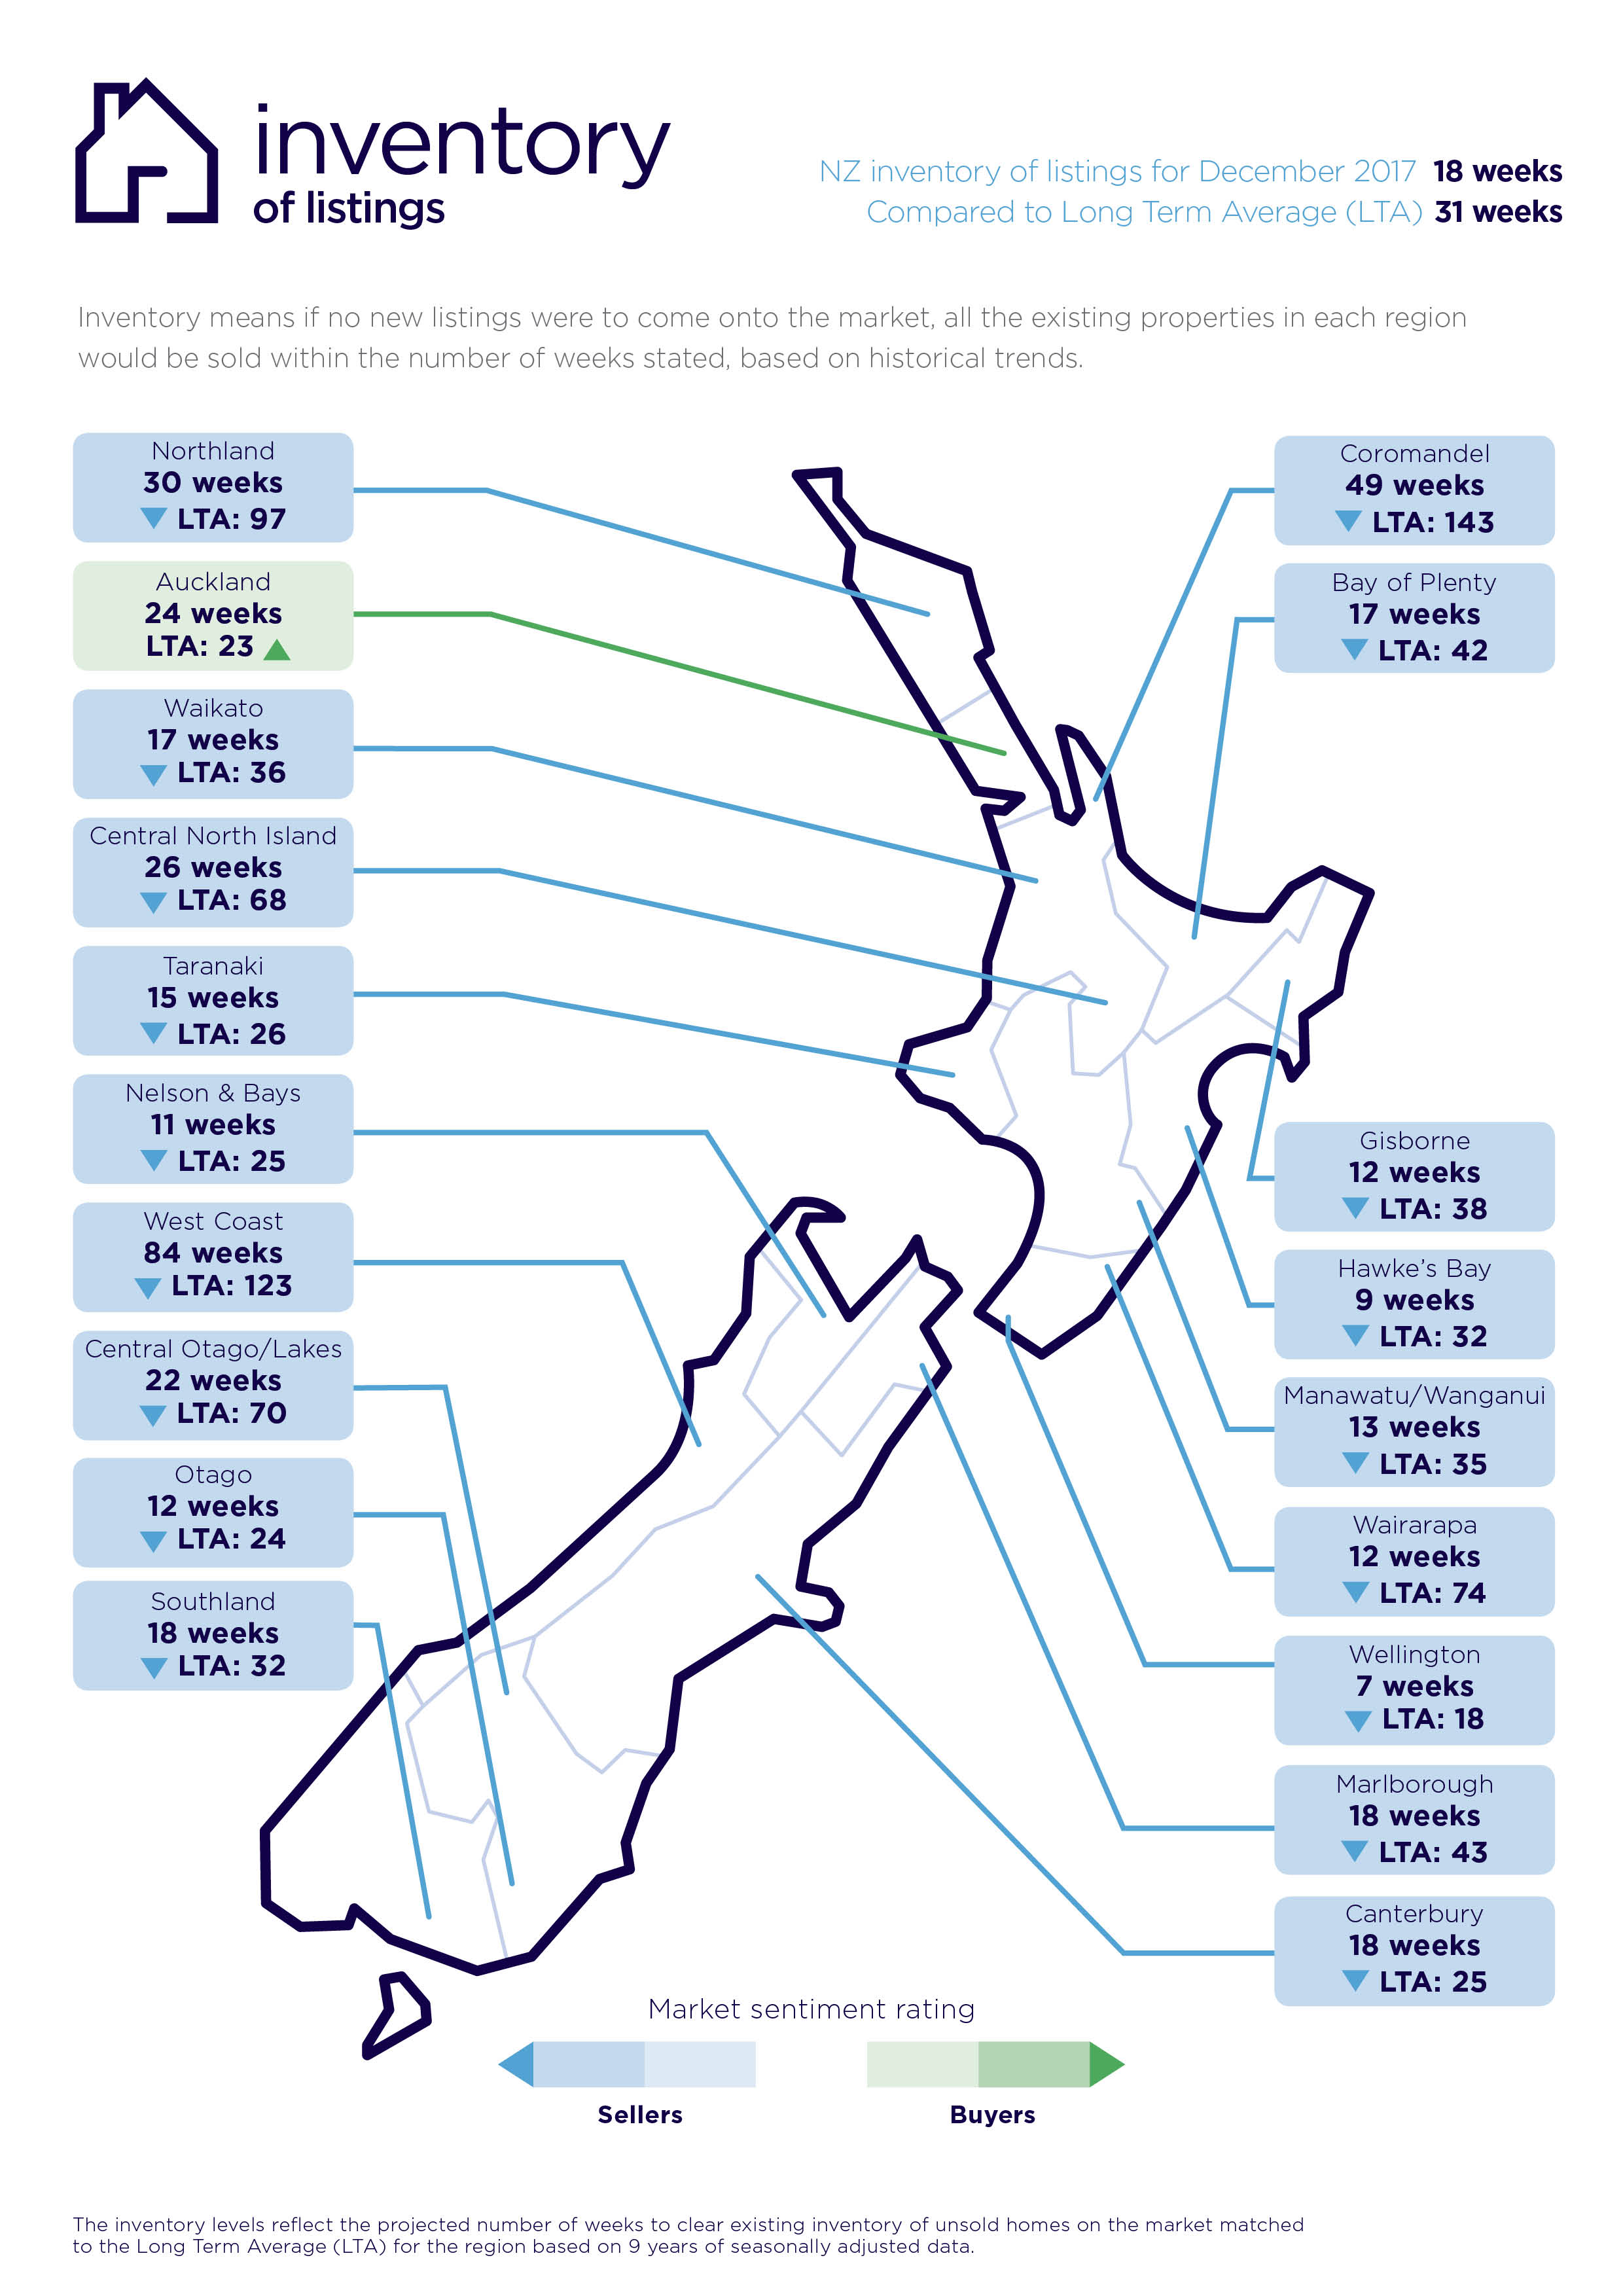
Theoretically, if no new listings came onto the market in Auckland and all existing stock was sold, there would be no houses for sale in 24 weeks which has over taken the long-term average – making it a buyers’ market.
New listings are low (down 7.8 per cent to 1,908), however total stock (up 26.1 per cent to 8,497) and average asking prices (up 2.7 per cent) are heading in the other direction.
“This is the first time we have seen Auckland shift to a buyers’ market since February 2011. The average asking price is still increasing despite high levels of stock. Auckland saw new property valuations last year which may be leading vendors to expect more than the market wants to pay,” says Vanessa Taylor, spokesperson for realestate.co.nz.
While the average Auckland Council house valuation is now more than one million dollars, vendors and buyers need to remember this is an average, not necessarily a starting point,
“December is always a low month on the housing charts, so it will be interesting to see if these trends continue throughout 2018”, comments Vanessa Taylor.
Central Otago / Lakes knocks Auckland off top asking price hot spot
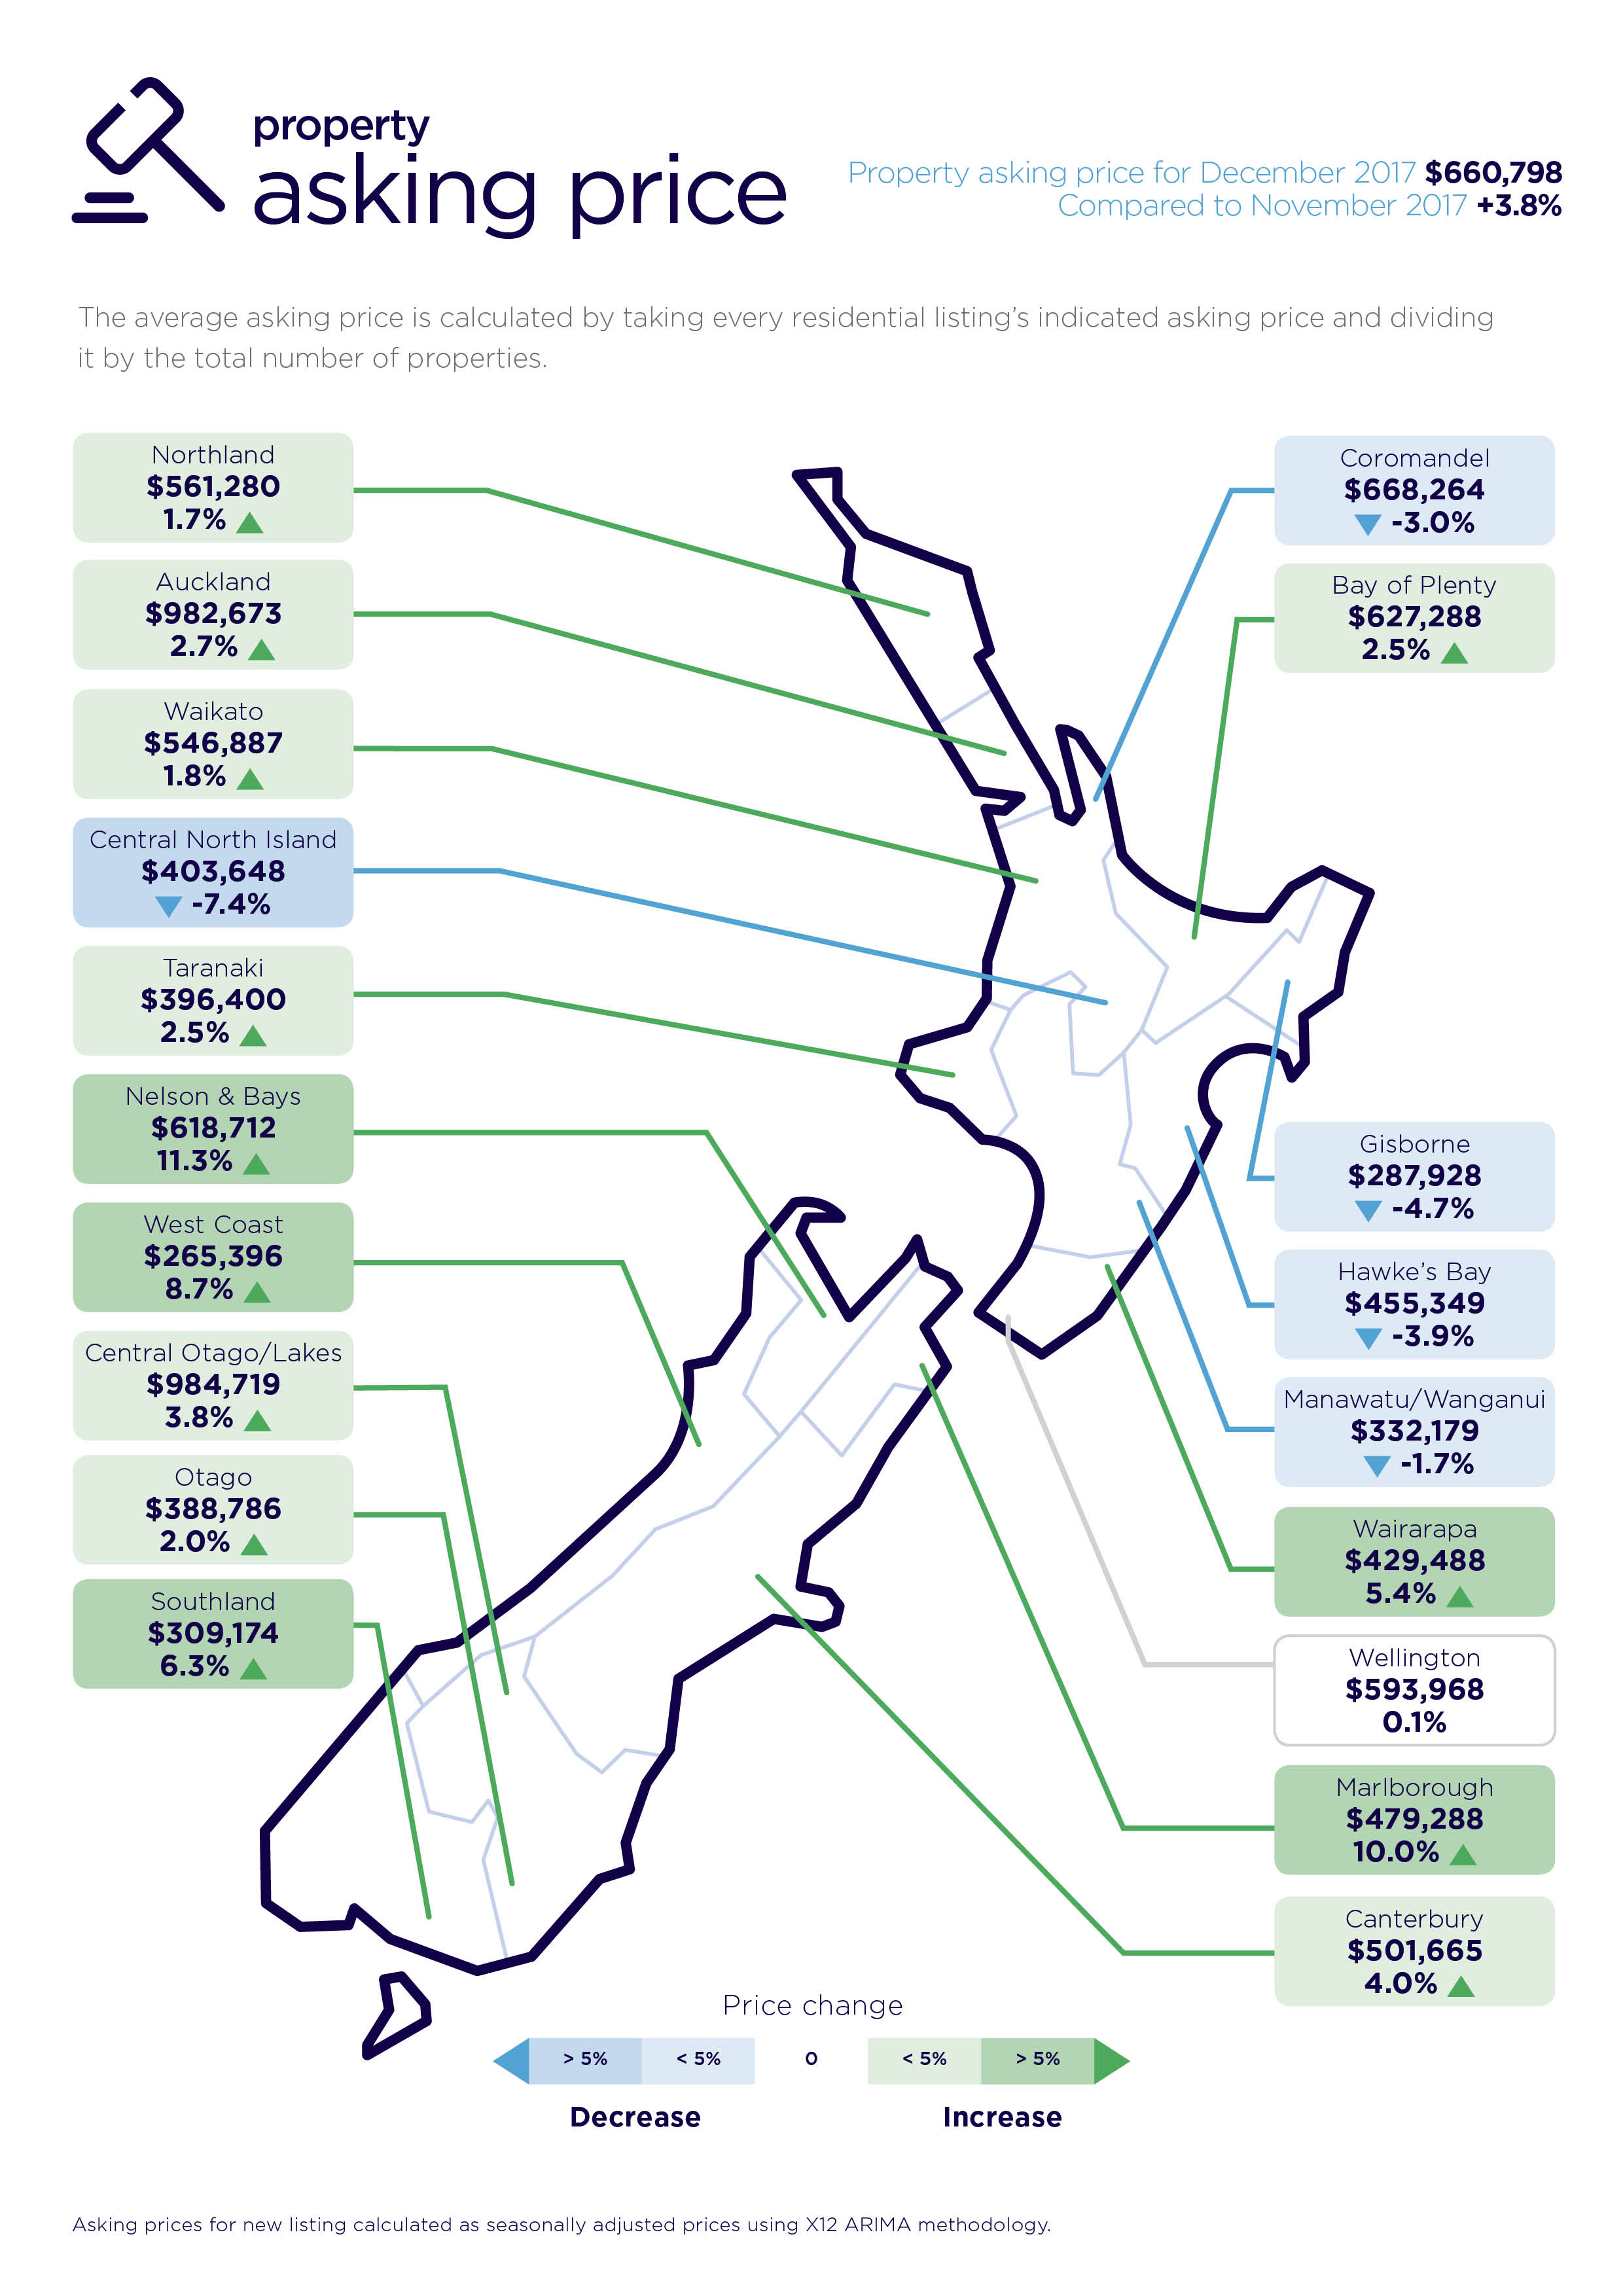
Nationally, the asking price moved up 3.8 per cent compared to the previous month, to $660,798. Central Otago/Lakes region matched the national movement to edge ahead of Auckland with an average asking price of $984,719. The last time we saw this region knock Auckland off the top spot was January 2016.
Areas which experienced the biggest asking price increases included Nelson & Bays (up 11.3 per cent to $618,712), Marlborough (up 10.0 per cent up to $479,288), West Coast (up 8.7 per cent to $265,396), Southland (up 6.3 per cent to $309,174) and Wairarapa (up 5.4 per cent to 429,488).
The biggest decreases in asking price were in the Central North Island (down 7.4 per cent to $403,648) and Gisborne (down 4.7 per cent to $287,928).
New listings slump
Overall new listings were down across the country with 13 of the 19 regions experiencing a drop.
Auckland contributed significantly, with only 1,908 new houses listed last month, down 7.8 per cent on the previous December’s 2,070. But the biggest fall was in the Wairarapa, down by 32.9 per cent to 98 year on year.
“Central Otago / Lakes region also showed a significant drop, with new house listings down 26.6 per cent to 212 properties. This would appear to have had some effect on the region’s climbing asking prices,” said Vanessa Taylor.
Another region with a significant new listings fall was Hawke’s Bay, down 21.7 per cent with only 220 new properties.
Total housing stock continues to build in the major centres
Auckland’s housing stock continued to rise in December, increasing by 26.1 per cent on December 2016 to 8,497. Other big increases were recorded by Wellington (up 21 per cent to 971) and Canterbury (up 18.6 per cent to 3,642).
“With Auckland leading the charge into a buyers’ market due to increasing stock levels, it will be interesting to watch if Wellington and Canterbury follow suit” says Vanessa.
Nationally, housing stock in December was lower than November but still up by 9.3 per cent on the December of 2016.
Glossary of terms
Being the only provider of real estate data in real time, realestate.co.nz offers valuable property market information not available from other sources.
• Average asking price gives an indication of current market sentiment. Statistically, asking prices tend to correlate closely with the sales prices recorded in future months when those properties are sold. As it looks at different data, average asking prices may differ from recorded sales data released at the same time.
• Inventory is a measure of how long it would take, theoretically, to sell the current stock
at current average rates of sale if no new properties were to be listed for sale. It provides a measure of the rate of turnover in the market.
• New listings are a record of all the new listings on realestate.co.nz for the relevant
calendar month. As realestate.co.nz reflects 97 per cent of all properties listed through registered
estate agents in New Zealand, this gives a representative view of the New Zealand property market.
• Demand: the increase or decrease in the number of views per listing in that region, taken over a rolling three-month time frame, compared to the same three-month time frame the previous year – including the current month.
• Seasonal adjustment is a method realestate.co.nz uses to better represent the core underlying trend of the property market in New Zealand. This is done using methodology from the New Zealand Institute of Economic Research.
• Truncated mean is the method realestate.co.nz uses to provide statistically relevant asking prices.
The top and bottom 10 per cent of listings in each area are removed before the average is
calculated, to prevent exceptional listings from providing false impressions.
Share
-
.svg)
.svg)
.svg)