
.svg)


Download the New Zealand Property Report as a print-ready PDF.
New Zealand property market in major centres stays cool over hot summer, while the regions are still pumping.
Real-time statistics from realestate.co.nz show that while the major centres in New Zealand continue to cool there’s lively activity across regional New Zealand.
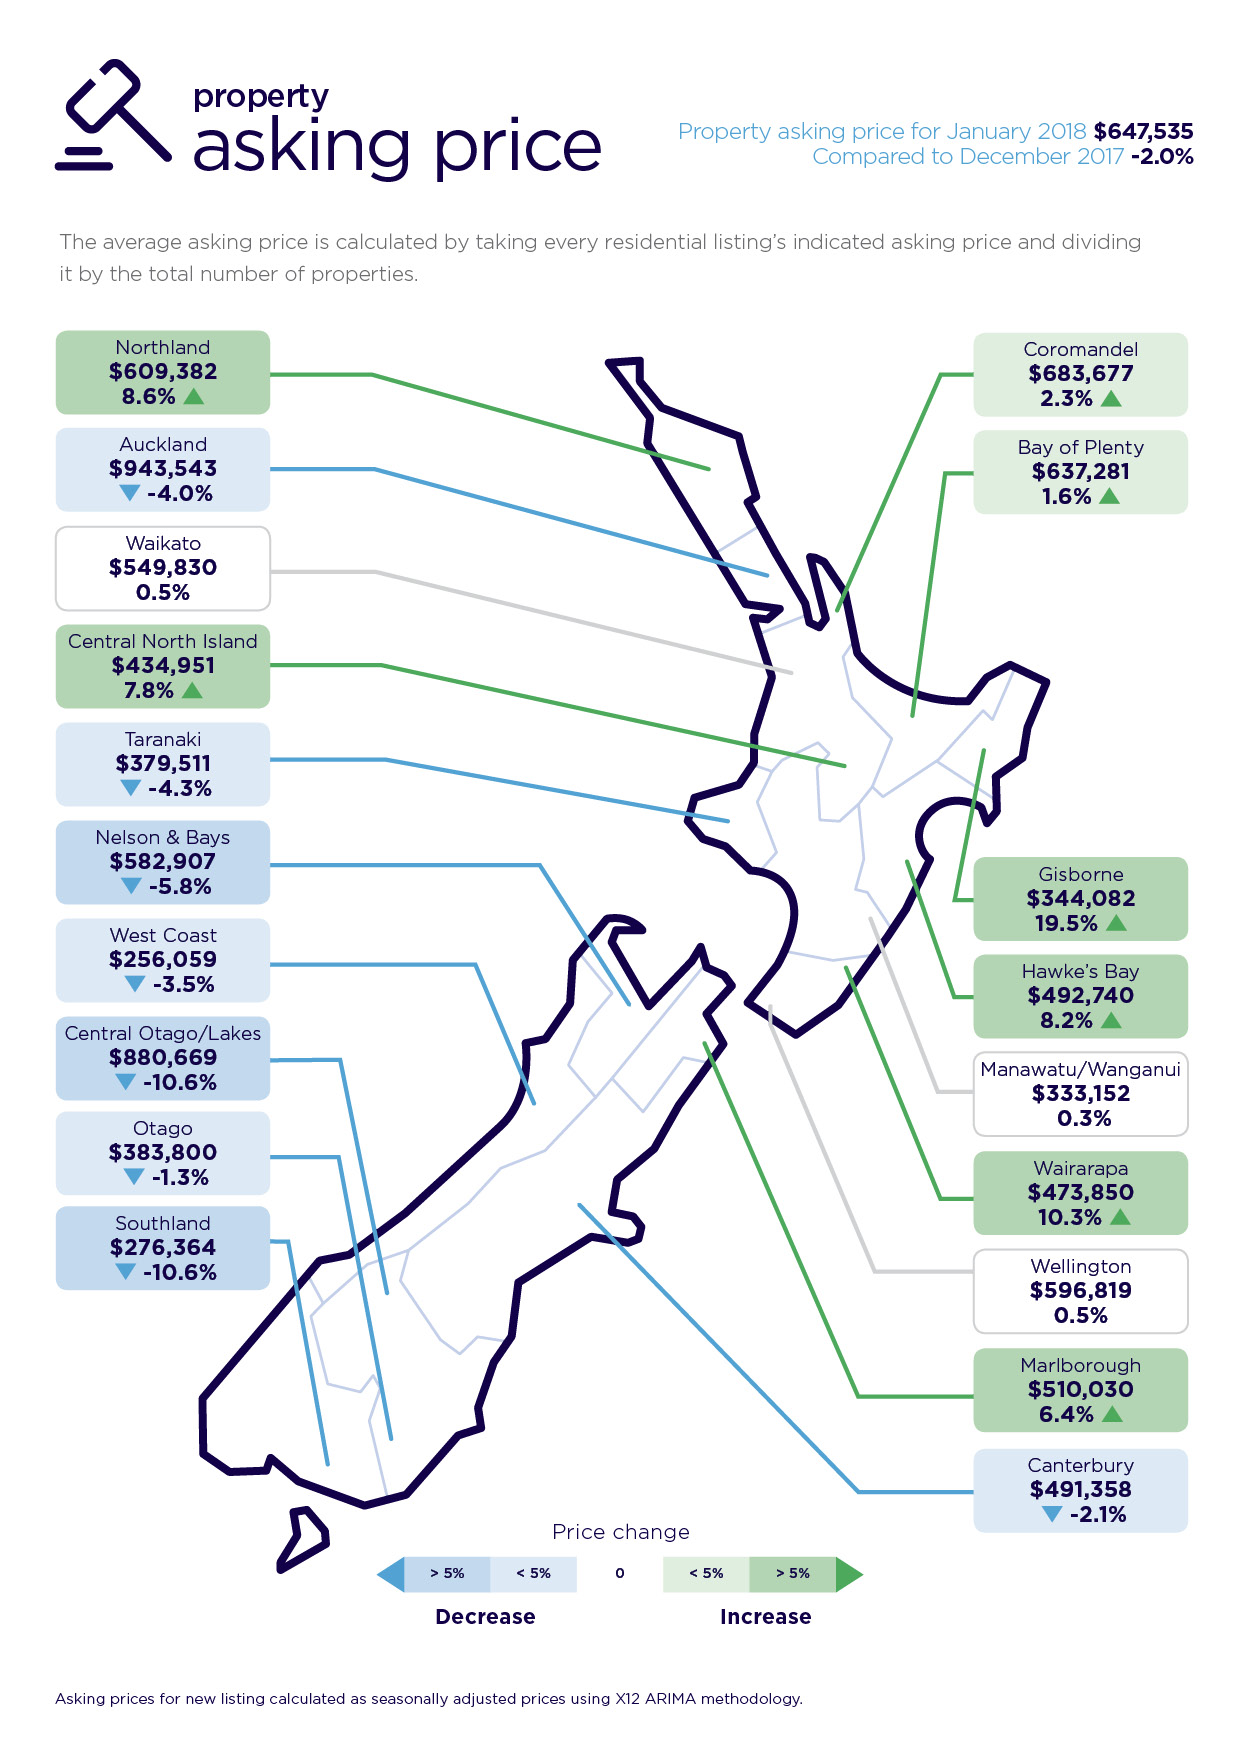
Asking prices either fell, or remained stable in Auckland, Wellington, Canterbury, Waikato and Otago compared to the prior month.
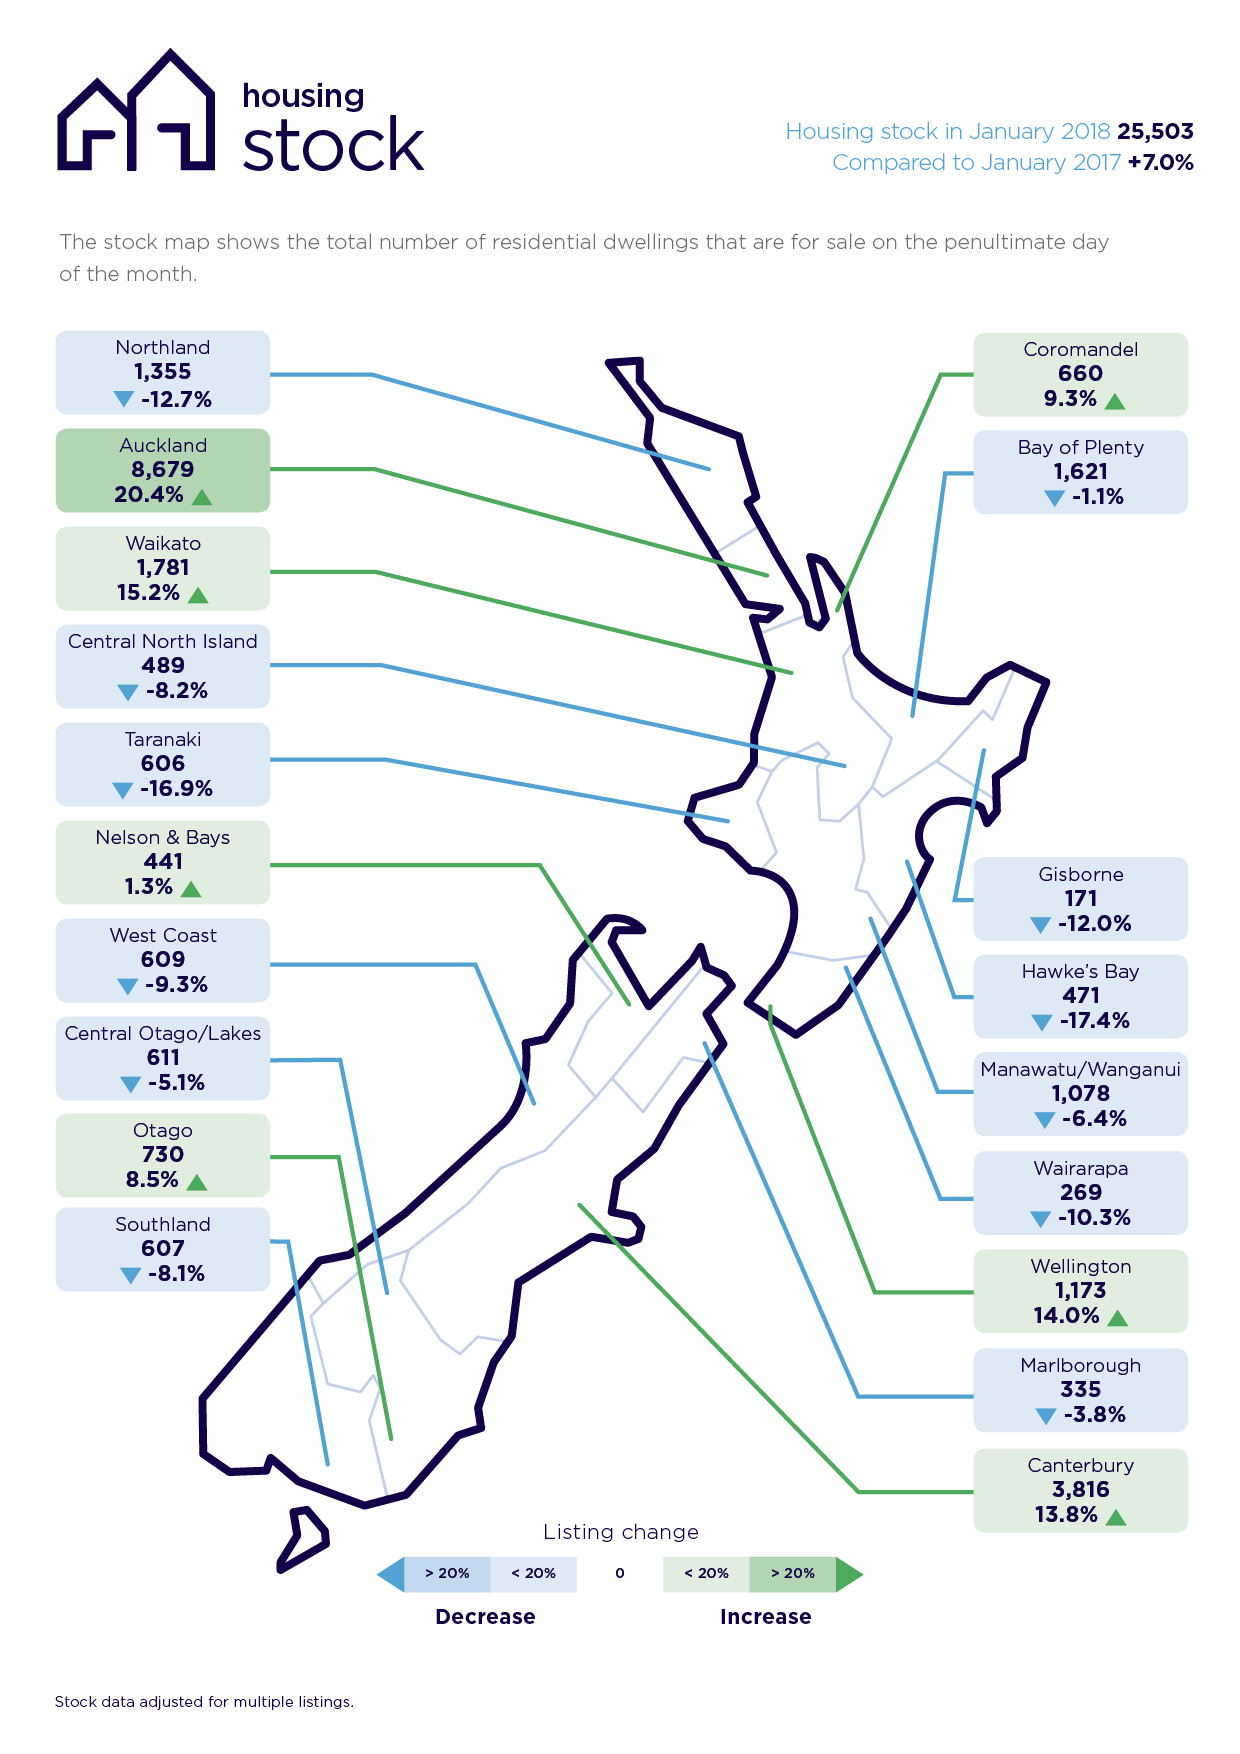
“Total housing stock was up in these five main regions compared to the same time a year ago, indicating that many properties are not selling as quickly.”
By contrast Northland, Central North Island, Bay of Plenty, Gisborne, Hawke's Bay, Wairarapa, and Marlborough were a hive of activity in January, says realestate.co.nz spokesperson Vanessa Taylor.
“It’s interesting that most of these regions are known holiday destinations and it could well be that sellers in these locations are taking advantage of the visitor season and a sellers’ market.”
Asking prices were up and total stock numbers were down in all these regions, she says.
New listings were down in Northland, Central North Island, Bay of Plenty and Hawke's Bay, but up in Wairarapa and Marlborough.
Gisborne led the country with a 19.5 per cent hike in asking prices compared to December to reach an average of $344,082. This was followed by the Wairarapa region which was up 10.3 per cent and an average asking price of $473,850.
Northland and Hawke's Bay are very similar in profile, with Northland’s asking price up 8.6 per cent to $609,382 and Hawke's Bay up 8.2 per cent to $492,740.
Central North Island follows closely behind with average asking prices up 7.8 per cent to $434,951 compared to the previous month.
The Marlborough region, a popular holiday destination, is the only South Island region to reach “hot status” with a 6.4 per cent increase in average asking prices to $510,030.
“Central Otago-Lakes would be the other holiday destination you could assume would be on the list, but it painted a different picture,” says Vanessa.
In Central Otago-Lakes, asking prices fell 10.6 per cent compared to the previous month while total stock fell 5.1 per cent when compared to the same period last year.
Aucklanders interest in Bay of Plenty falls
Tauranga has been recently described as the most unaffordable city in New Zealand to buy a new home (annual Demographia International Housing Affordability Survey).
“However, it looks like Aucklanders are less interested with the region than they previously were,” says Vanessa.
Real time data from realestate.co.nz shows that viewings of listings to the region from Aucklanders has fallen each January over the last three years (Jan 2016 – Jan 2018).
Despite this, Bay of Plenty asking prices continue to rise and are an all-time high of $637,281, a 1.6 per cent increase on December 2017.
Listings are also in scarce supply in the Bay of Plenty. The region registered a record low in new property listings compared with January 2017, with 466 new listings (down 12.6 per cent on the previous year).
Major centres stay cool
Vanessa Taylor says a less frenetic market in the main centres means purchasers have the time to take a more considered approach.
“They can take more time to consider all options (such as whether to sell, buy or renovate) with less competitive pressure to purchase immediately.
“Buyers have more time to view all the options and negotiate without the pressure of a hot market,” she says.
Asking prices fell in the Auckland region compared to the previous month (-4.0 per cent to $943,543). Falls were also registered in Christchurch (-2.1 per cent) and Otago (1.3% per cent). In the Waikato and Wellington region asking prices were relatively stable (+0.5 per cent) in both centres.
Total stock was up in all five regions compared to the same month a year ago.
In Auckland total stock was up (+20.4 per cent) followed by Waikato (+15.2 per cent), Wellington (+14.0%), Canterbury (+13.8%) and Otago (+8.5 per cent).
New property listings varied among the five regions, with the Otago region recording a 13.9 per cent increase new property listings compared to the same month in the previous year, followed by Wellington (+ 7.4 per cent), Canterbury (+1.1 per cent). Falls were recorded in Auckland (-9.7 percent) and the Waikato (-8.6 per cent).
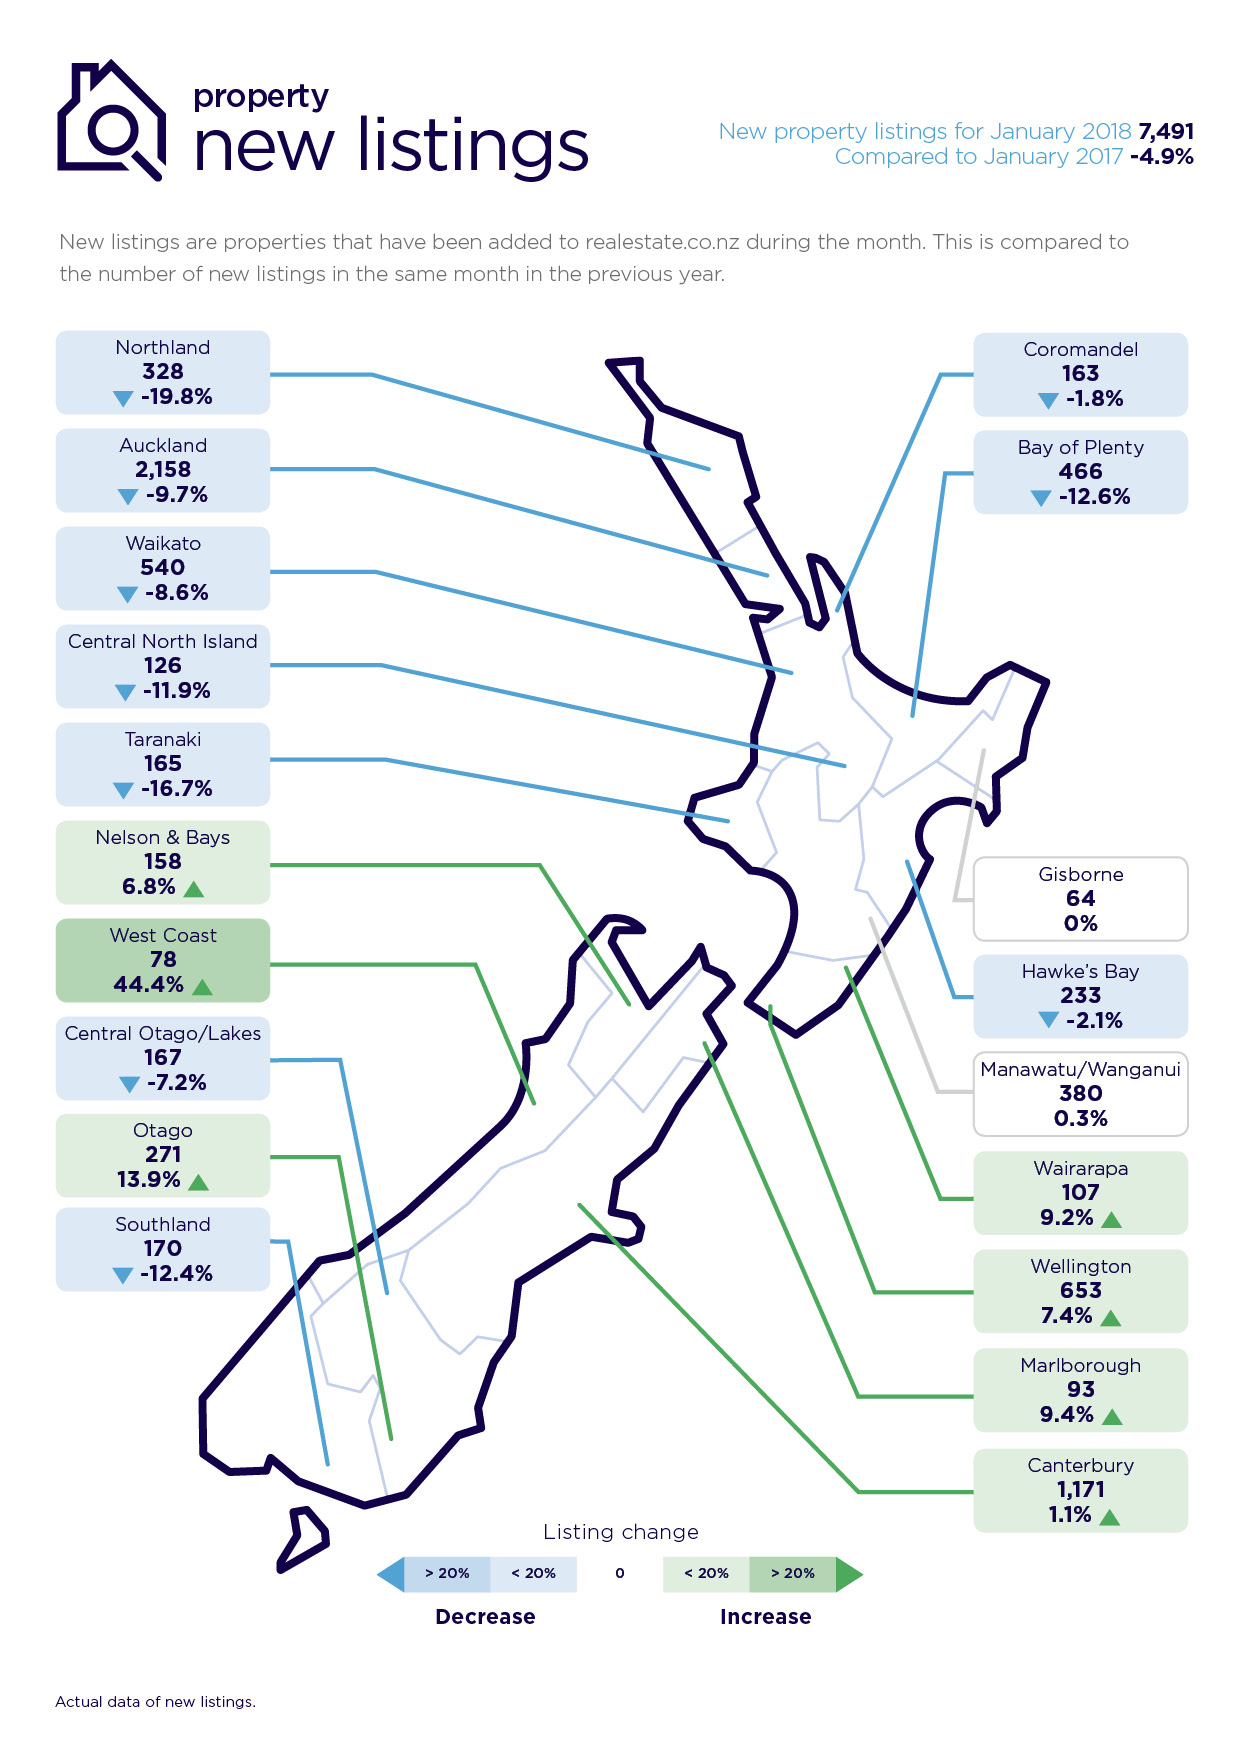
New property listings and average asking prices fall across the country
Nationally, there were 7,491 new property listings across the country which is a 4.9 per cent decrease on the same period last year.
However, total housing stock is up 7.0 per cent compared to January 2017, which indicates that many properties are not selling as quickly as in previous years, says realestate.co.nz spokesperson Vanessa Taylor.
The average asking price across the country was $647,535 which is a 2.0 per cent fall compared to December 2017.
Glossary of terms
Being the only provider of real estate data in real time, realestate.co.nz offers valuable property market information not available from other sources.
• Average asking price gives an indication of current market sentiment. Statistically, asking prices tend to correlate closely with the sales prices recorded in future months when those properties are sold. As it looks at different data, average asking prices may differ from recorded sales data released at the same time.
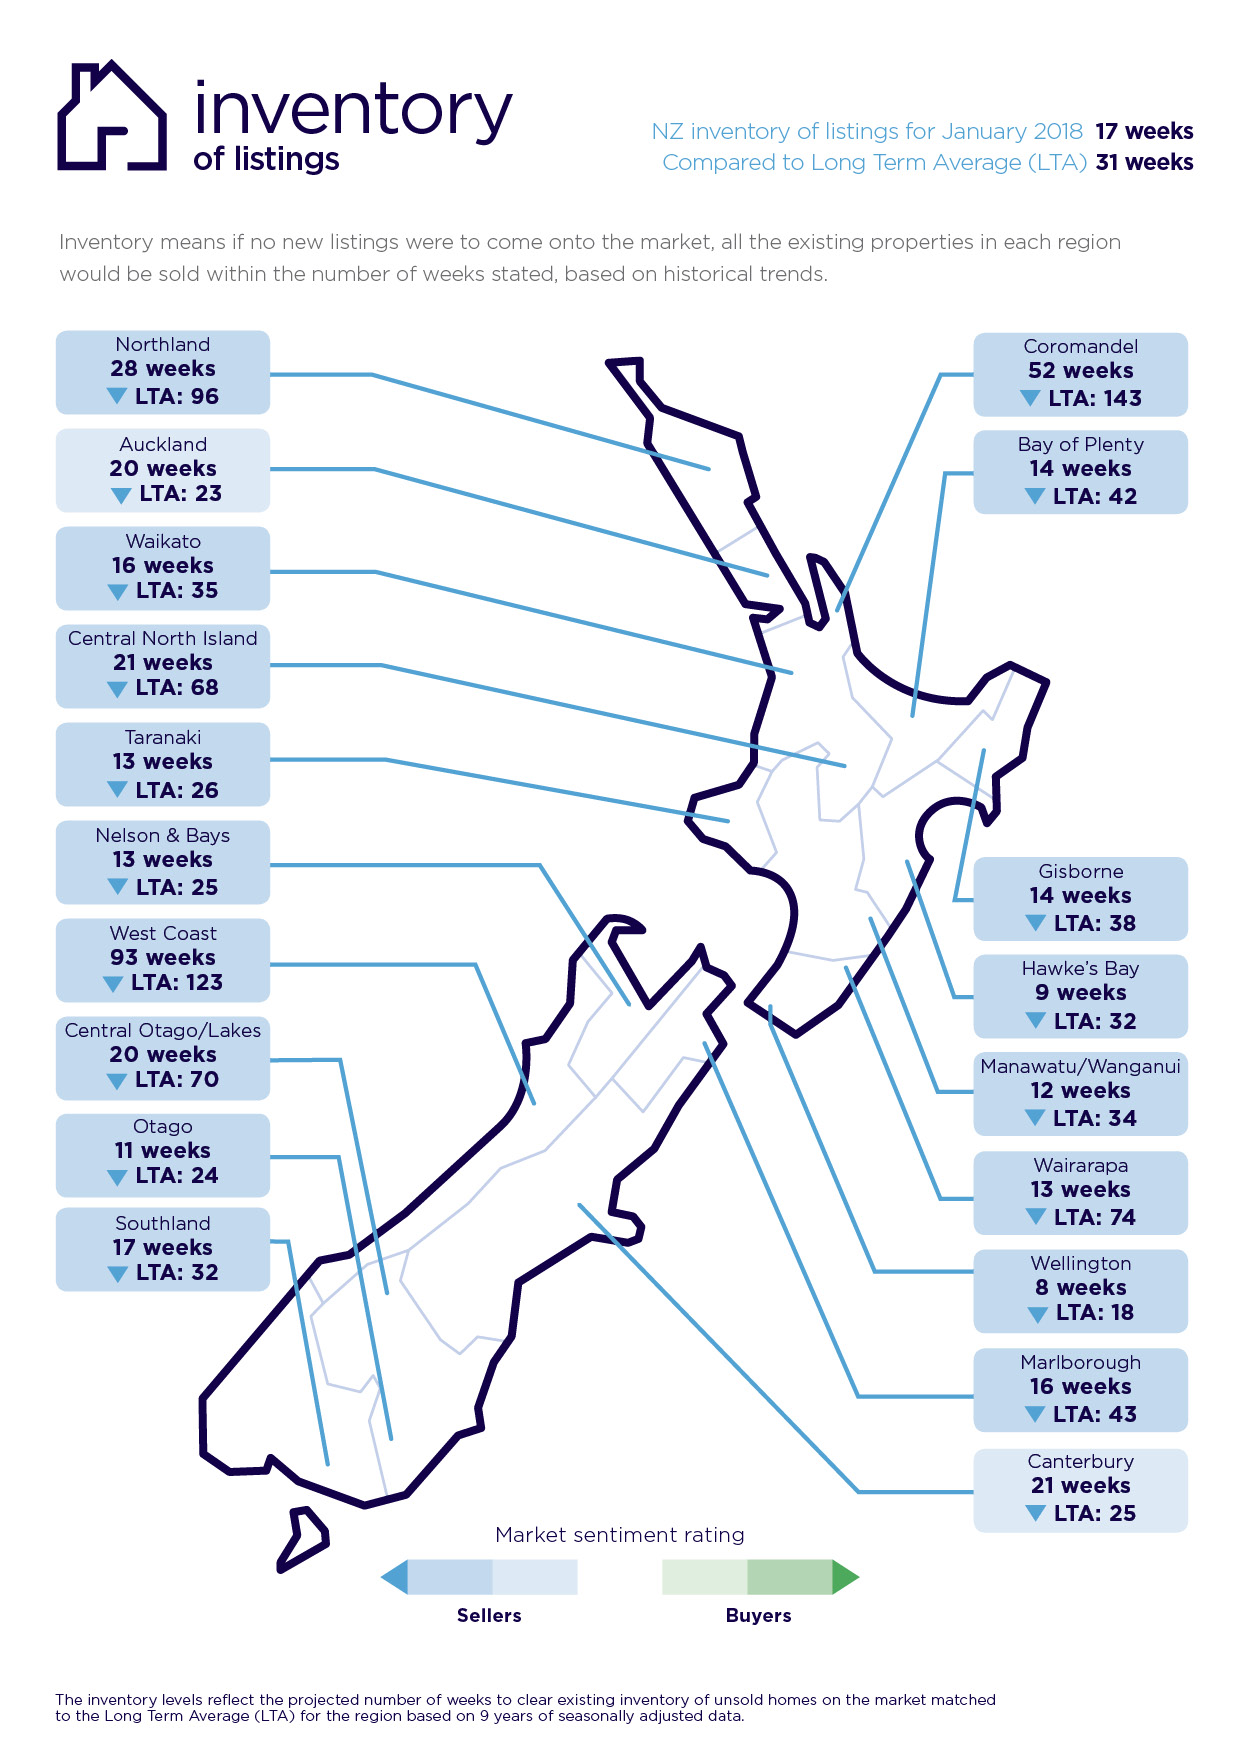
• Inventory is a measure of how long it would take, theoretically, to sell the current stock at current average rates of sale if no new properties were to be listed for sale. It provides a measure of the rate of turnover in the market.
• New listings are a record of all the new listings on realestate.co.nz for the relevant calendar month. As realestate.co.nz reflects 97 per cent of all properties listed through registered estate agents in New Zealand, this gives a representative view of the New Zealand property market.
• Demand: the increase or decrease in the number of views per listing in that region, taken over a rolling three-month time frame, compared to the same three-month time frame the previous year – including the current month.
• Seasonal adjustment is a method realestate.co.nz uses to better represent the core underlying trend of the property market in New Zealand. This is done using methodology from the New Zealand Institute of Economic Research.
• Truncated mean is the method realestate.co.nz uses to provide statistically relevant asking prices. The top and bottom 10 per cent of listings in each area are removed before the average is calculated, to prevent exceptional listings from providing false impressions.
Share
-
.svg)
.svg)
.svg)