
.svg)


Download the New Zealand Property Report as a print-ready PDF.
New property listings drop significantly in June, while asking prices and buyer interest hold steady. Auckland region records a fall in new listings and asking prices are back to 2017 levels.
Real-time statistics from realestate.co.nz show across the country, new property listings fell in 15 of the 19 regions in June, which represents a 9.9% drop compared to June last year. Nationally, there were a total of 8,136 new property listings.
“Three regions recorded all-time new listing lows in June compared to the previous year,” realestate.co.nz spokesperson Vanessa Taylor.
These were the Gisborne (down 41.4%, 41 listings), West Coast (down 25.8%, 49 listings) and the Wairarapa region (down 27%, 84 listings).
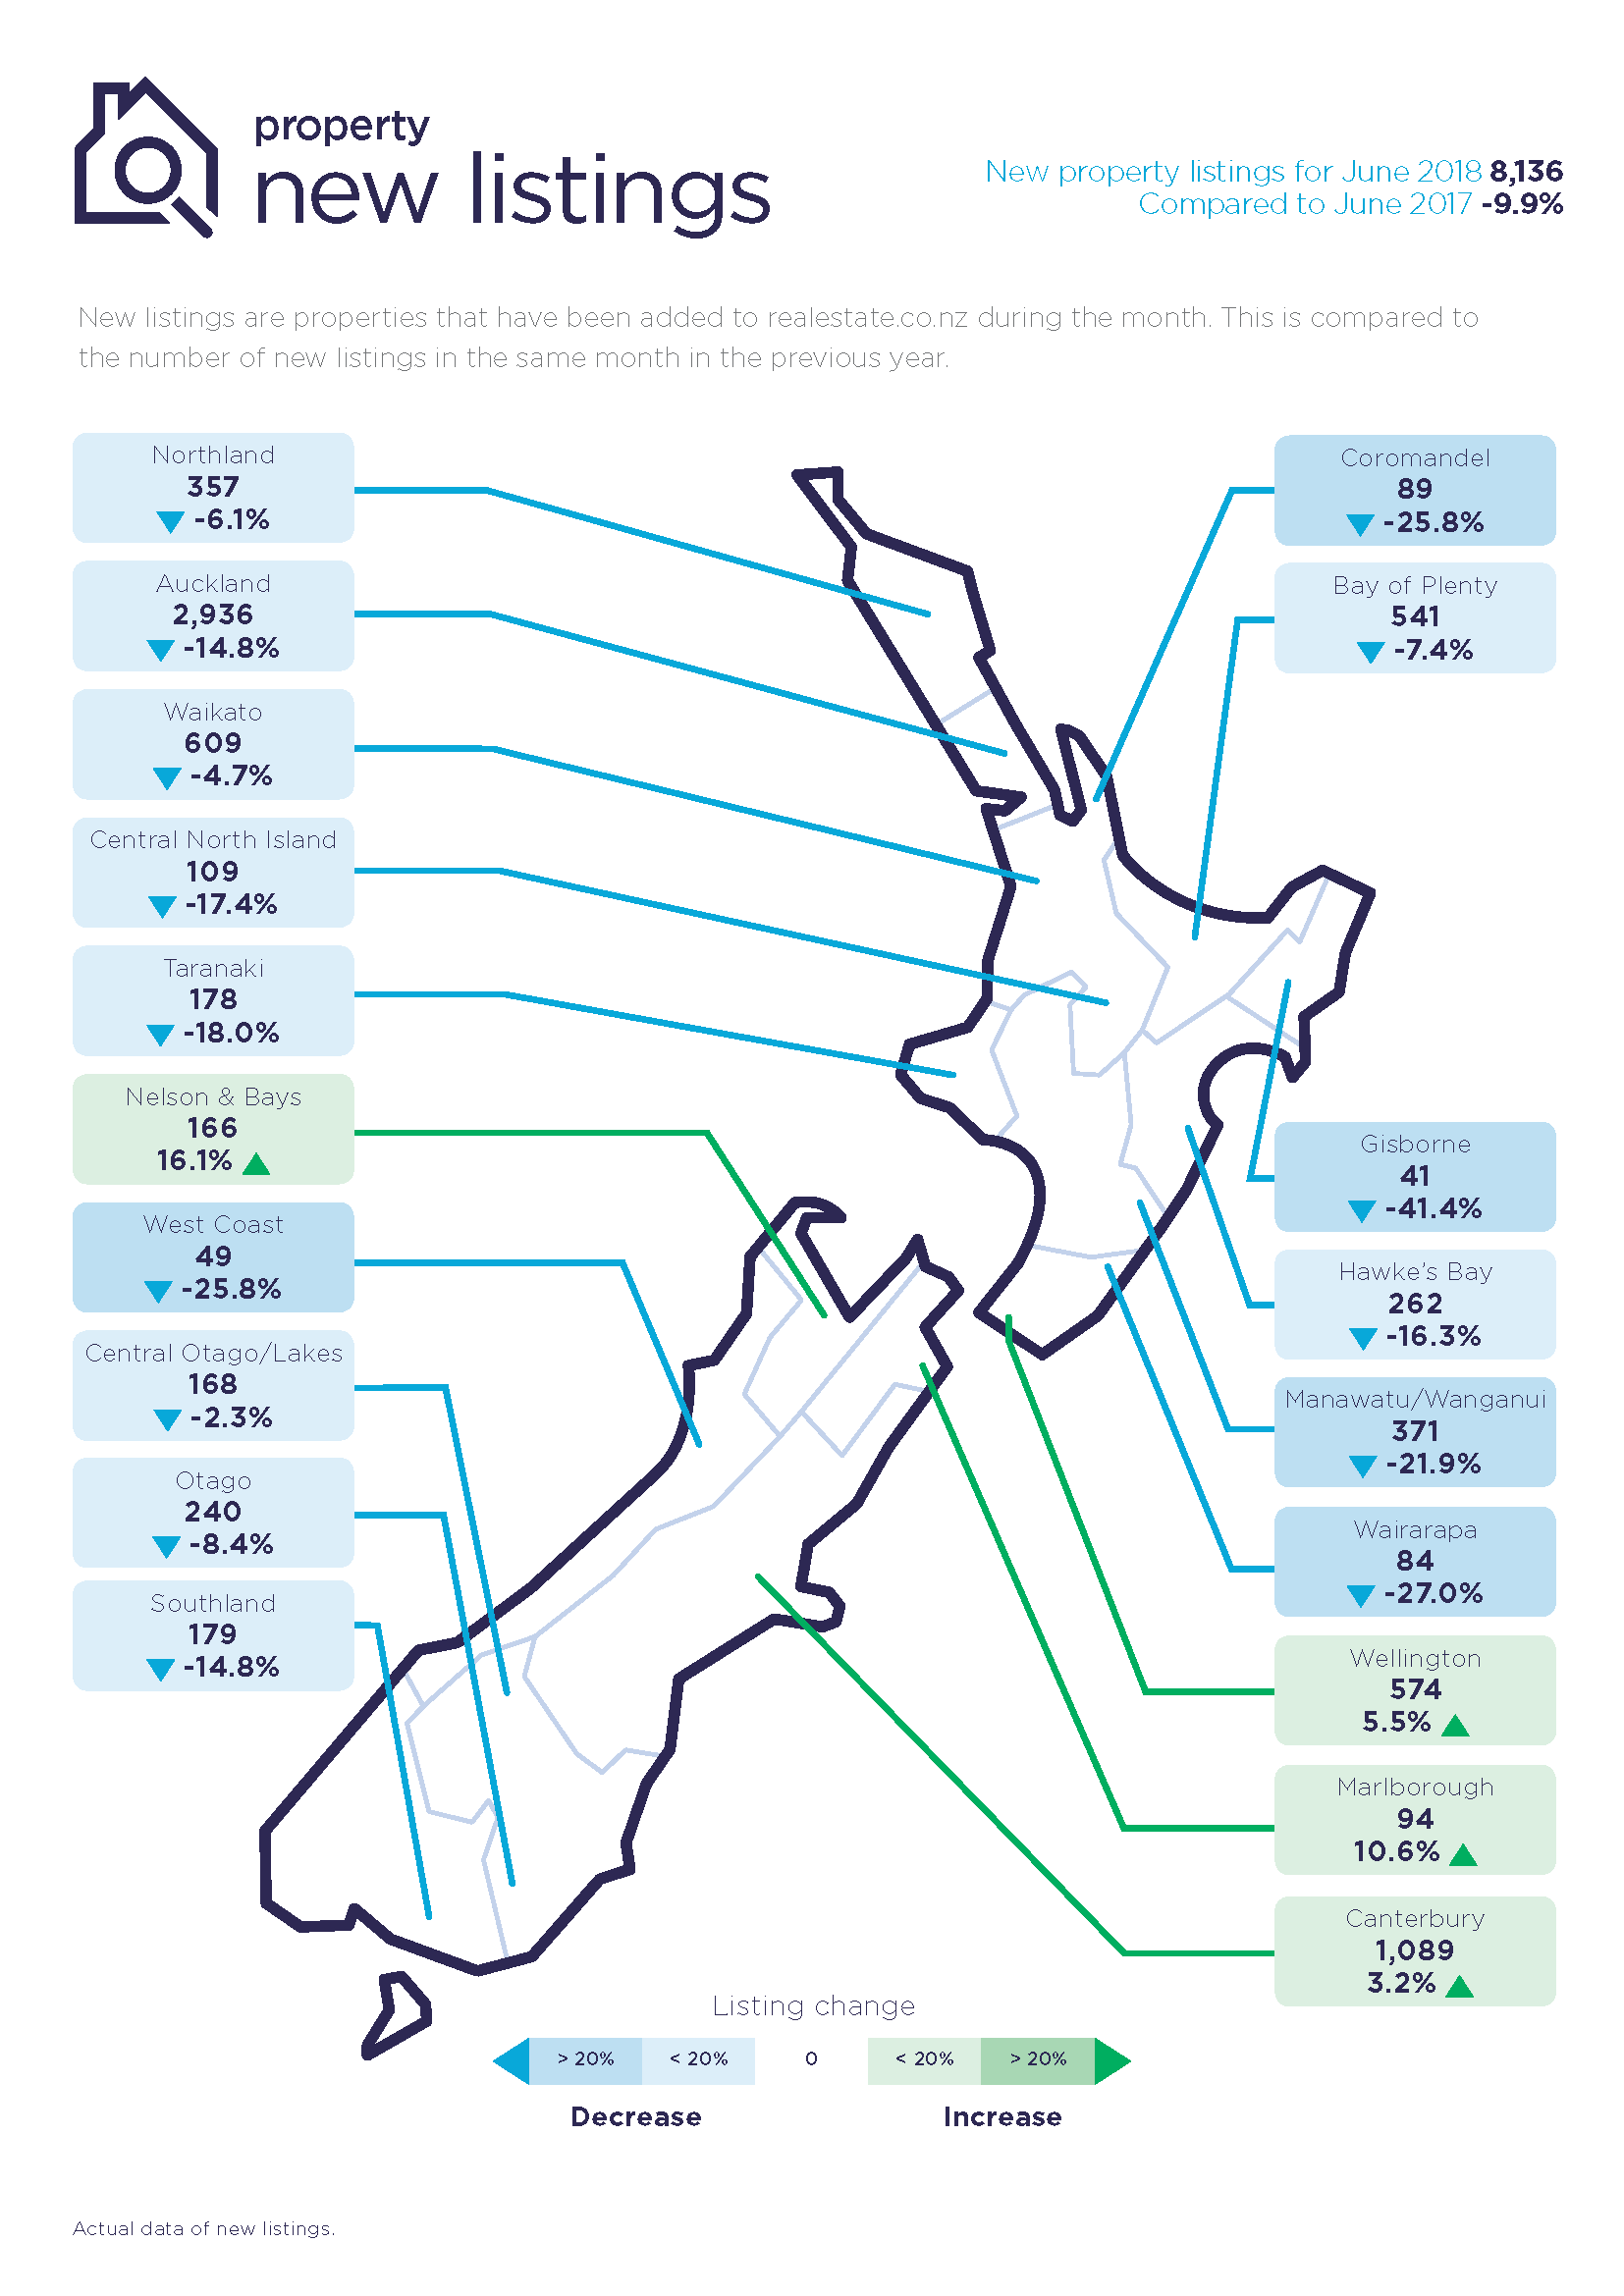
New property listings in the Auckland region for the month of June fell 14.8% (2,936 new listings) compared to June 2017.
“We haven’t seen Auckland new listings under 3,000 for the month of June since 2014,” says Vanessa.
New listings fell in every region in the North Island apart from Wellington, which recorded a 5.5% increase (574 listings) compared with June 2017. A good sign for the capital city.
In the South Island, three of the seven regions recorded increases in new listings compared to June 2017. Nelson & Bays was up 16.1% (166 new listings), Marlborough up 10.6% (94 new listings) and Canterbury up 3.2% (1,089 new listings).
“Typically, in winter we hibernate, and this June was no exception with cold weather felt across the country,” says Vanessa.
“The reality is that people want to sell their property when they feel that it’s looking its best and potential buyers are more likely to go out to open homes.”
Asking prices remain stable nationally, but Auckland region falls back to 2017 levels
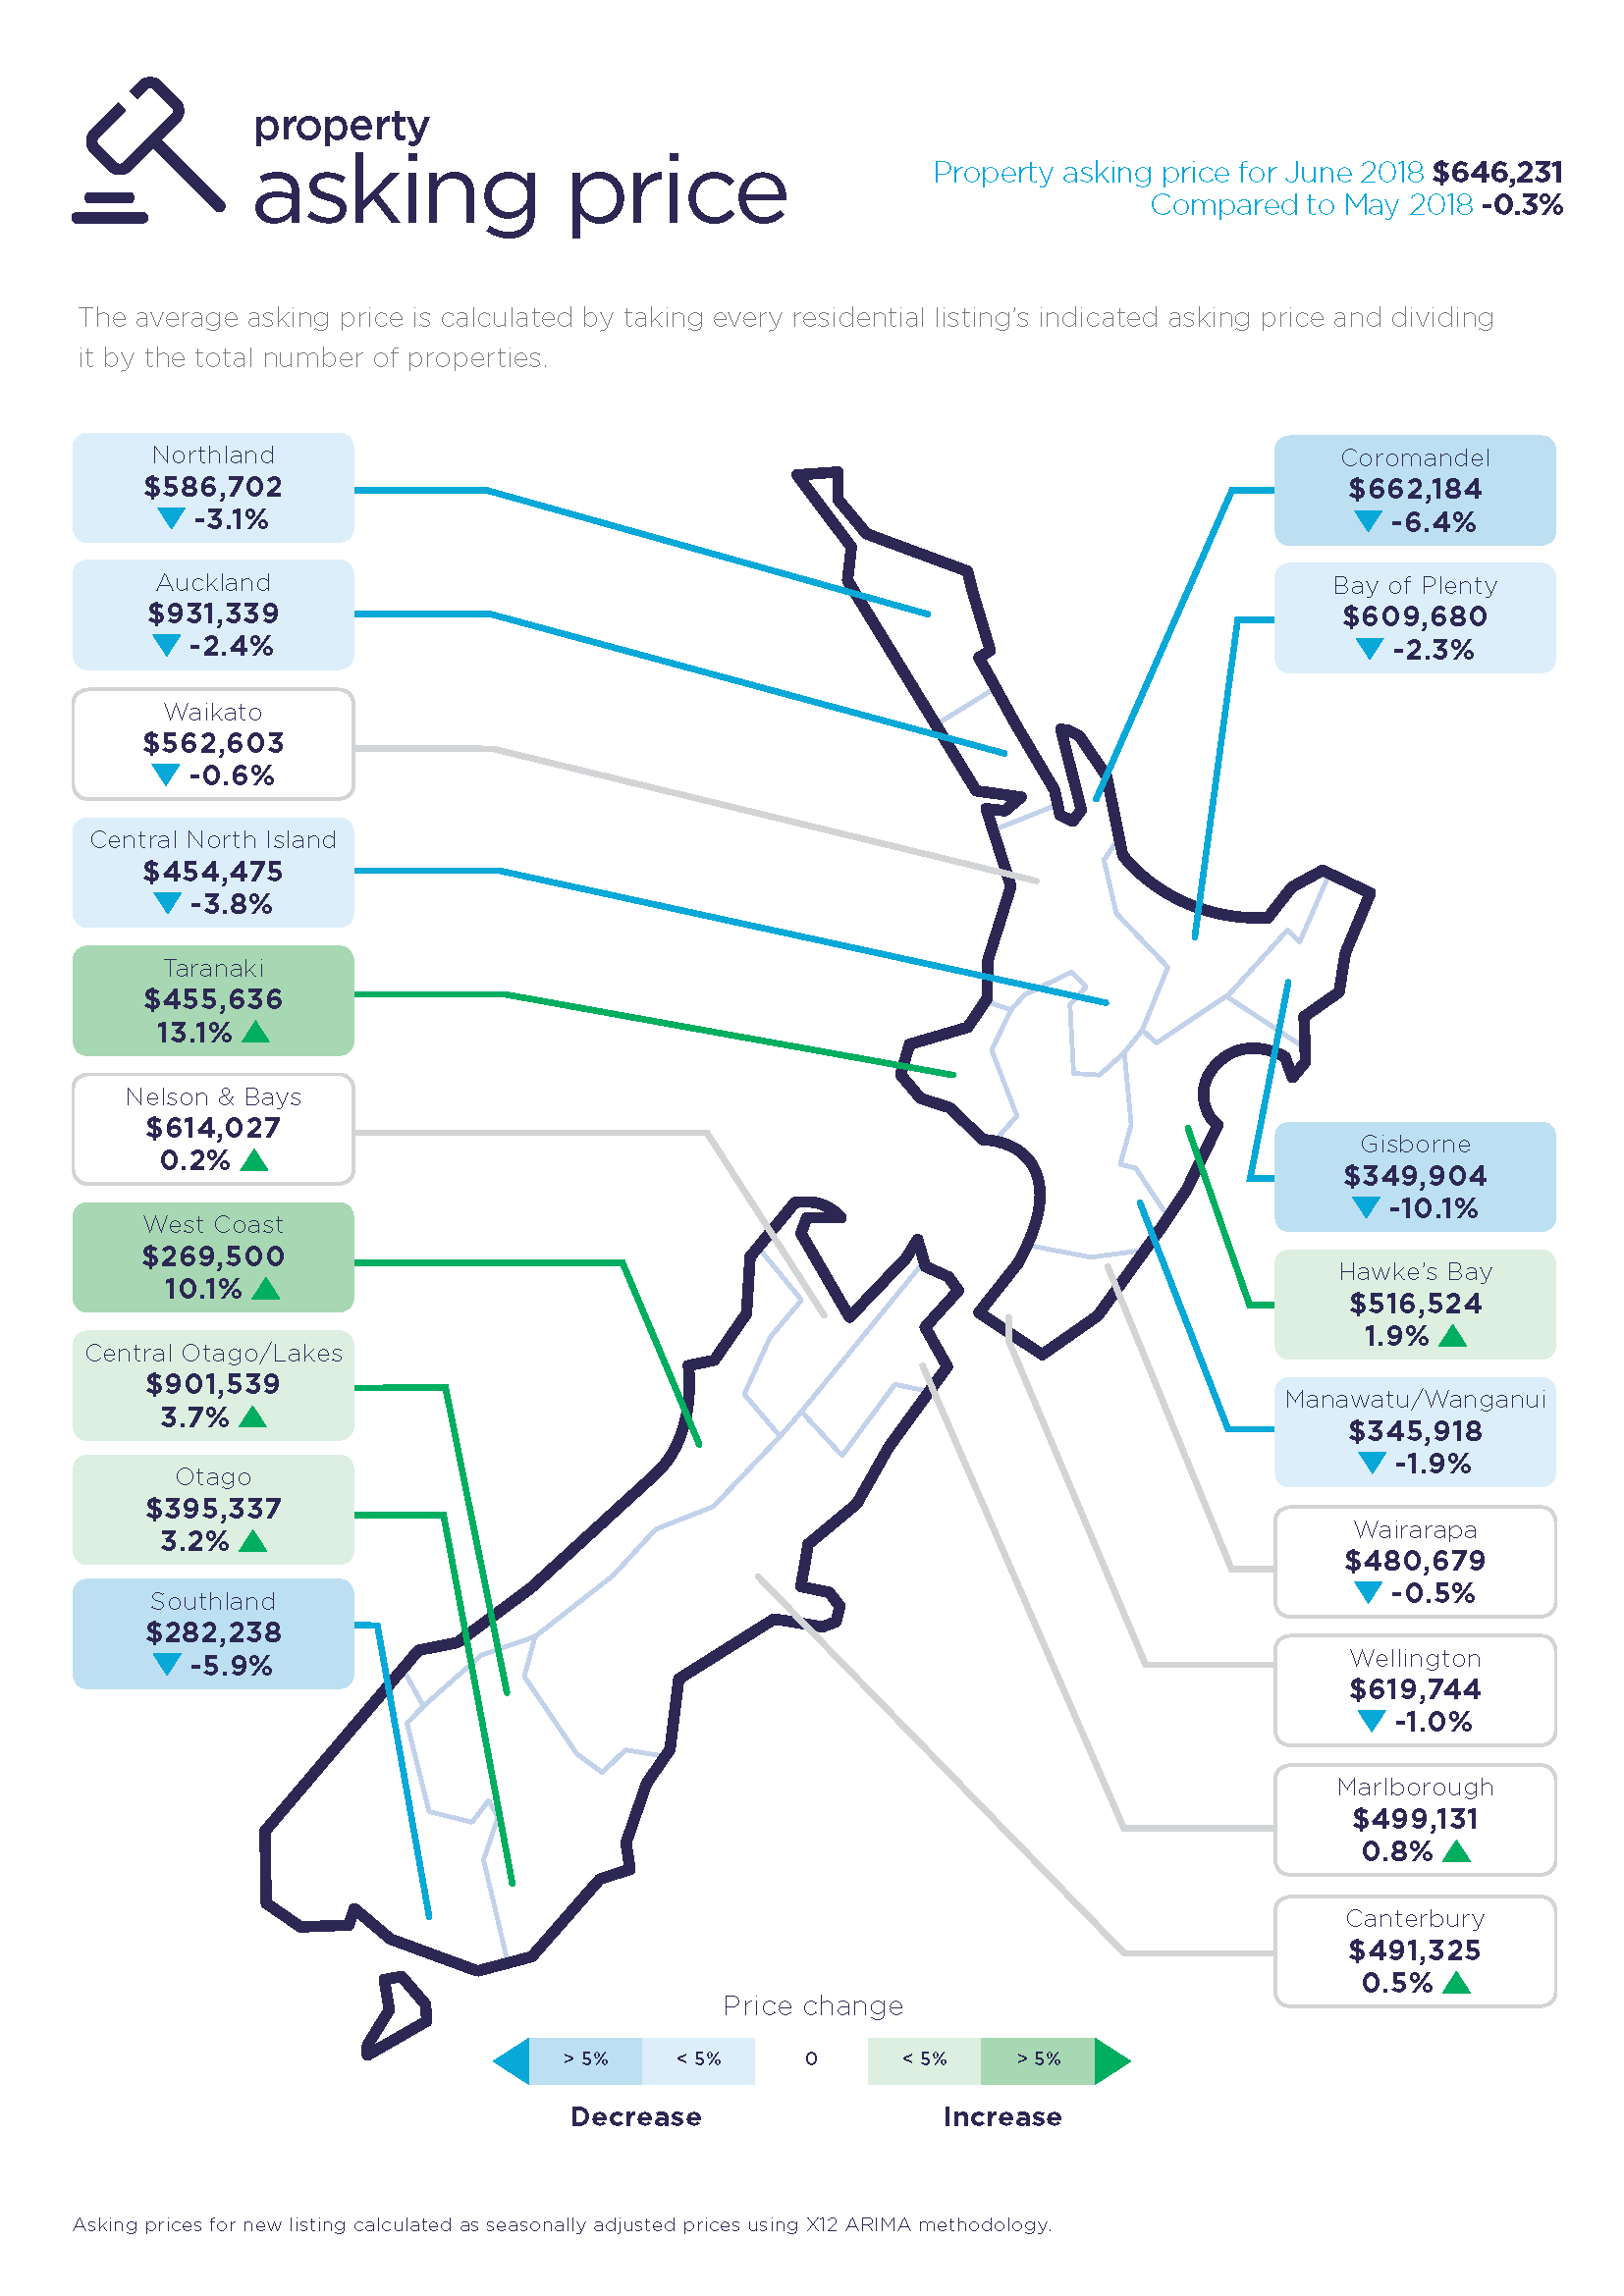
While asking prices in June were stable nationally (average asking price $646,231 representing a 0.3% decrease on May 2018), June was a month where a small number of regions impacted on asking pricing levels.
In the Auckland region in June, asking prices fell 2.4% to $931,339 compared to the prior month.
The last time that asking prices were at this level (around the $930,000 mark) was in the spring of 2017 (August, September, October 2017).
Also notable in June was the narrowing of the gap in asking prices between the Auckland and Central/Otago Lakes regions.
The Central Otago/Lakes region’s asking prices increased 3.7% to a little over $900,000 compared to the average asking price in the Auckland region which stood at just over $930,000.
“We often see these two regions dance for the top spot in average asking price and June sees the gap narrow again. The $30,000 difference speaks more about the individual strengths of an attractive lifestyle region and a major metropolitan hub,” she says.
Taranaki region in a classic supply and demand situation
“The star performer on asking price front in June was the Taranaki region,” says Vanessa Taylor.
Asking prices were up 13.1% in June to $455,636 compared to the prior month.
June new property listings were down 18.0% (178 new listings) compared to the same month in 2017.
“This is a classic supply and demand profile,” she says.
Buyer interest holds steady
In last month’s realestate.co.nz report, the results of research commissioned by the company was released showing there were many more buyers than sellers intending to be active in the New Zealand property market in the next 12 months.*
“We said at the time that this would put increasing pressure on housing stock in the next 12 months,” says Vanessa.
“Our own tracking of unique visitors to our website is also reflecting this research,” she says.
More than 800,000 unique users** visited realestate.co.nz in June.
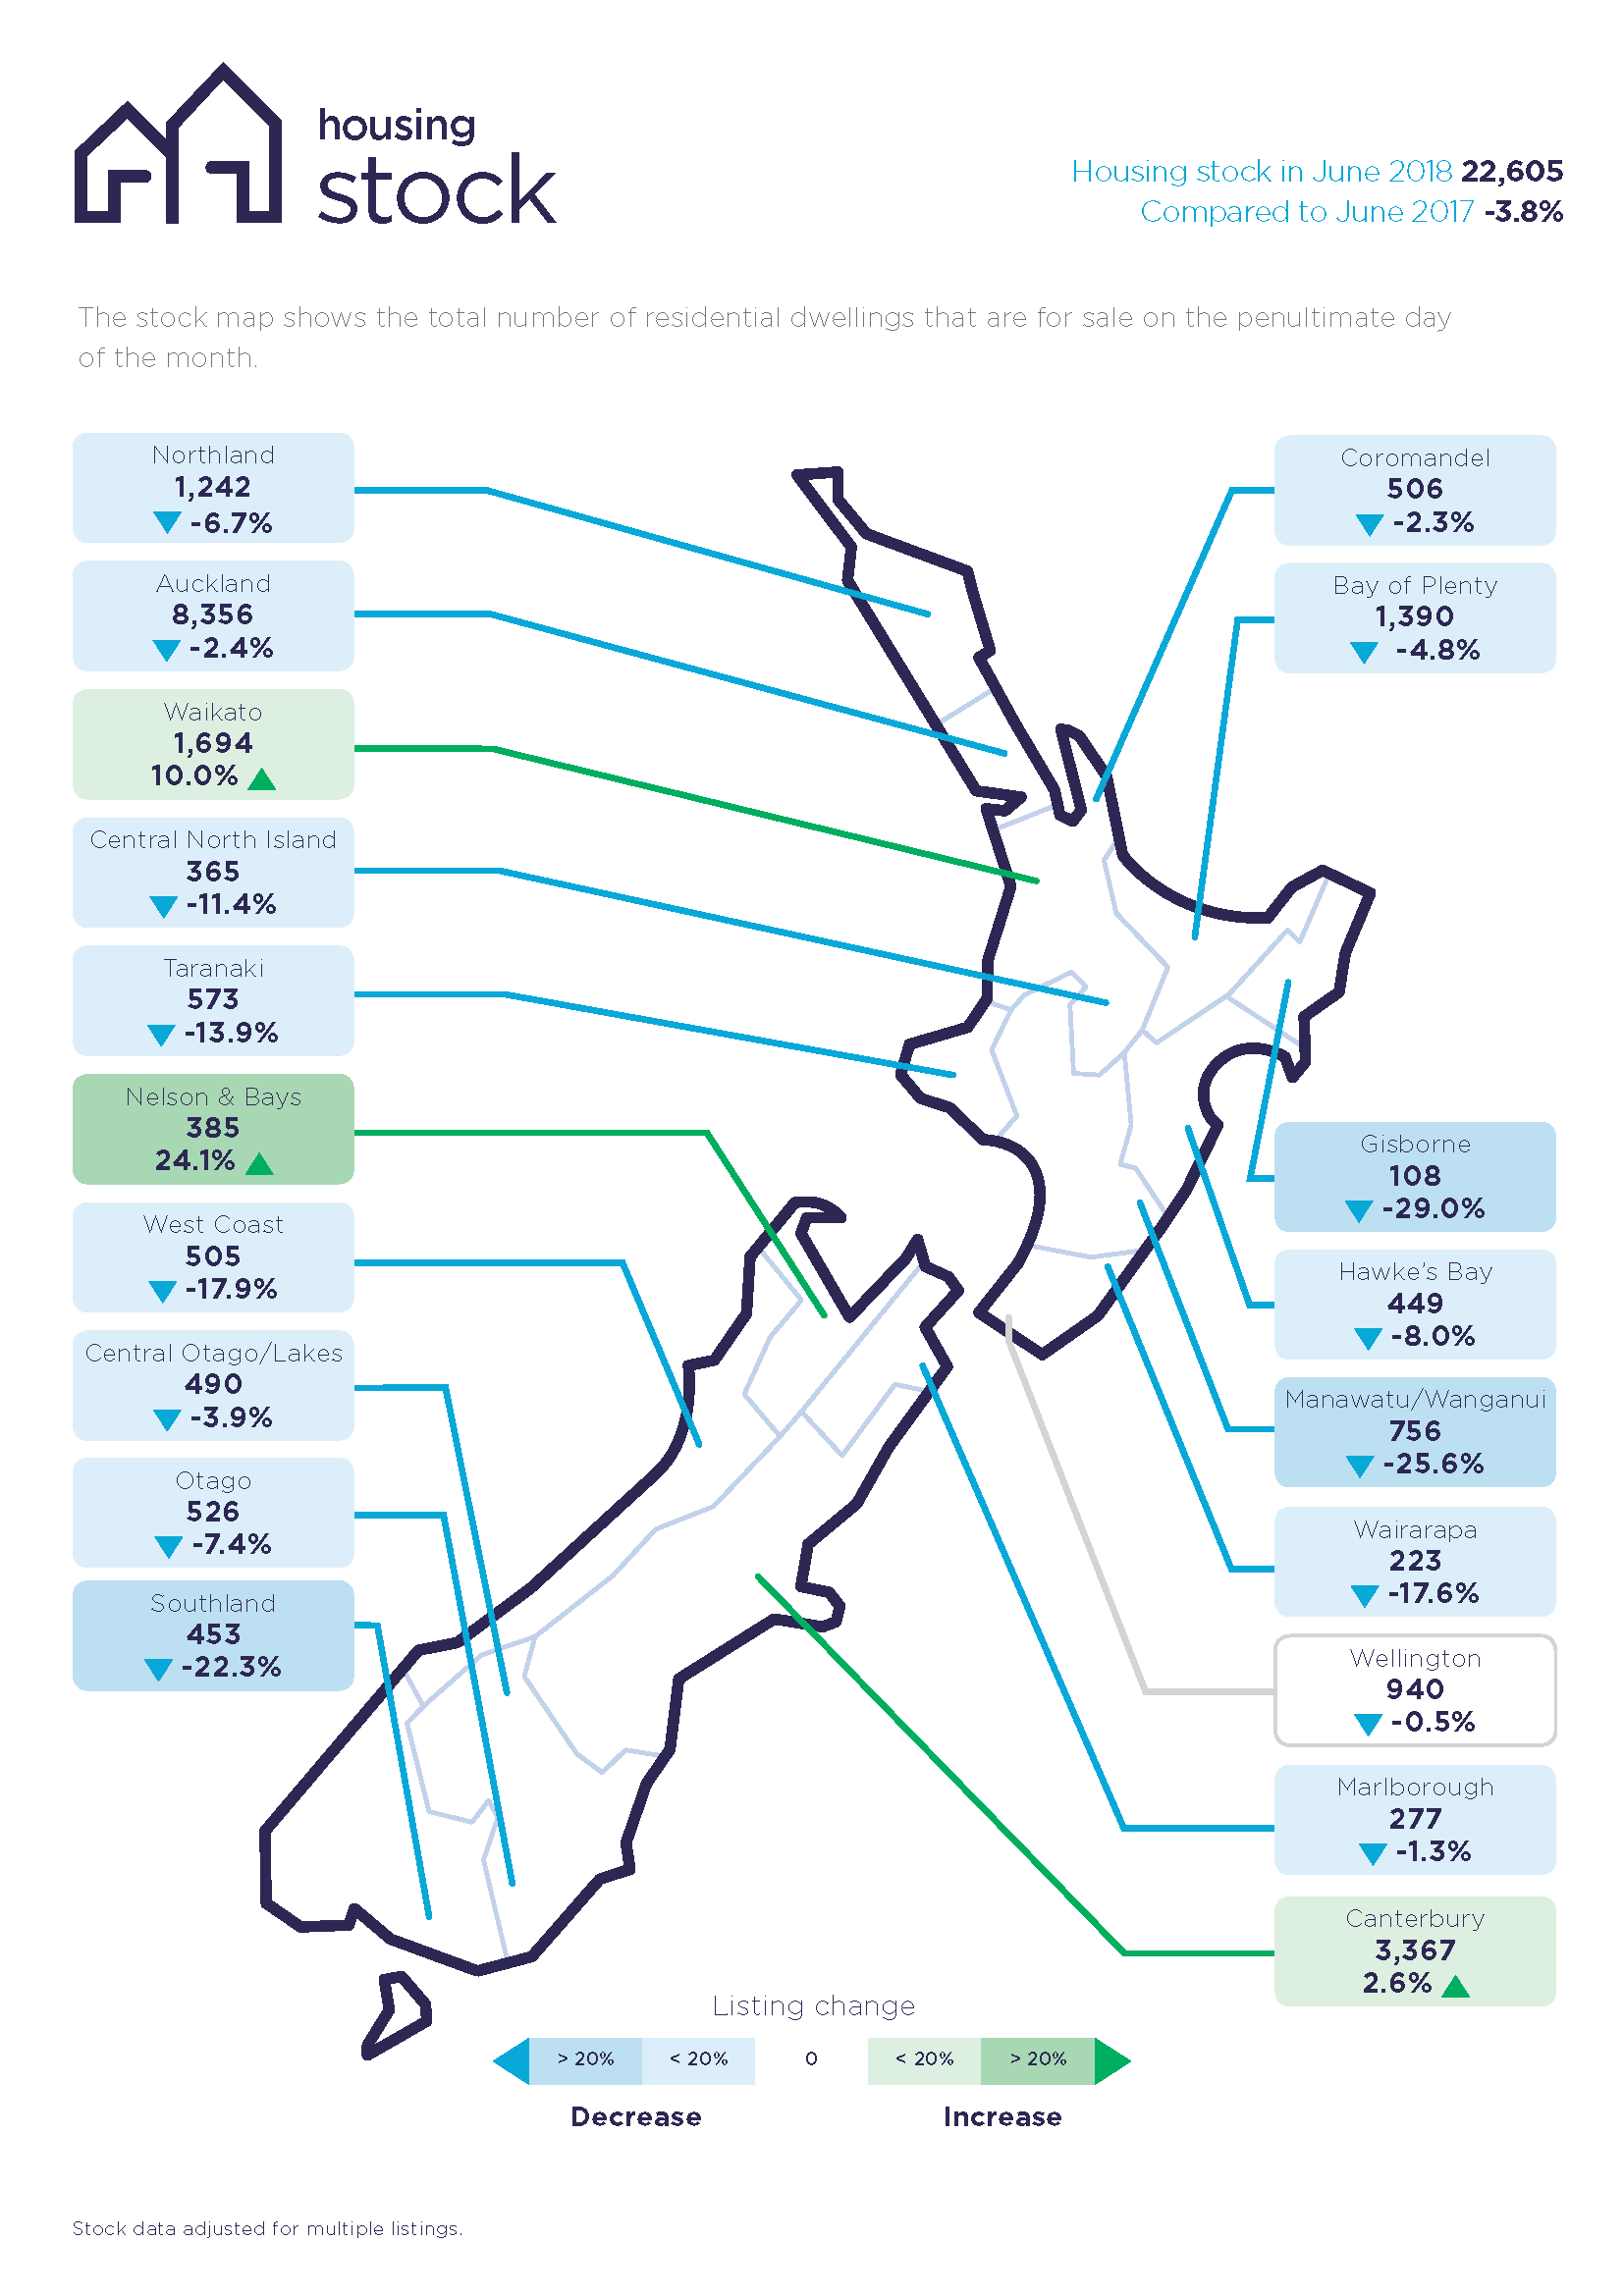
“With 22,605 homes for sale on the site in June, it shows that the property market is still busy, despite the cooler months,” says Vanessa.
“Our users spend an average of 8:11 minutes on site viewing more than eight pages per session.
“It’s fair to say New Zealanders are still active in the property market,” she says.
For media enquiries, please contact:
Liz Holt PPR T: +64 21 042 6590 E: liz.holt@ppr.co.nz
*Horizon Research: Results of April 2018 Online Property Media Monitor for realestate.co.nz.
1,345 members of the Horizon Research national panel which represents the New Zealand adult population.
** New Zealanders have an average of 3.2 devices per person. If all persons used their 3.2 devices at different times to search the site, the actual number of New Zealanders on realestate.co.nz would be in the order of 250,000 in June.
Glossary of terms
As the only provider of real estate data in real time, realestate.co.nz offers valuable property market information not available from other sources.
• Average asking price gives an indication of current market sentiment. Statistically, asking prices tend to correlate closely with the sales prices recorded in future months when those properties are sold. As it looks at different data, average asking prices may differ from recorded sales data released at the same time.
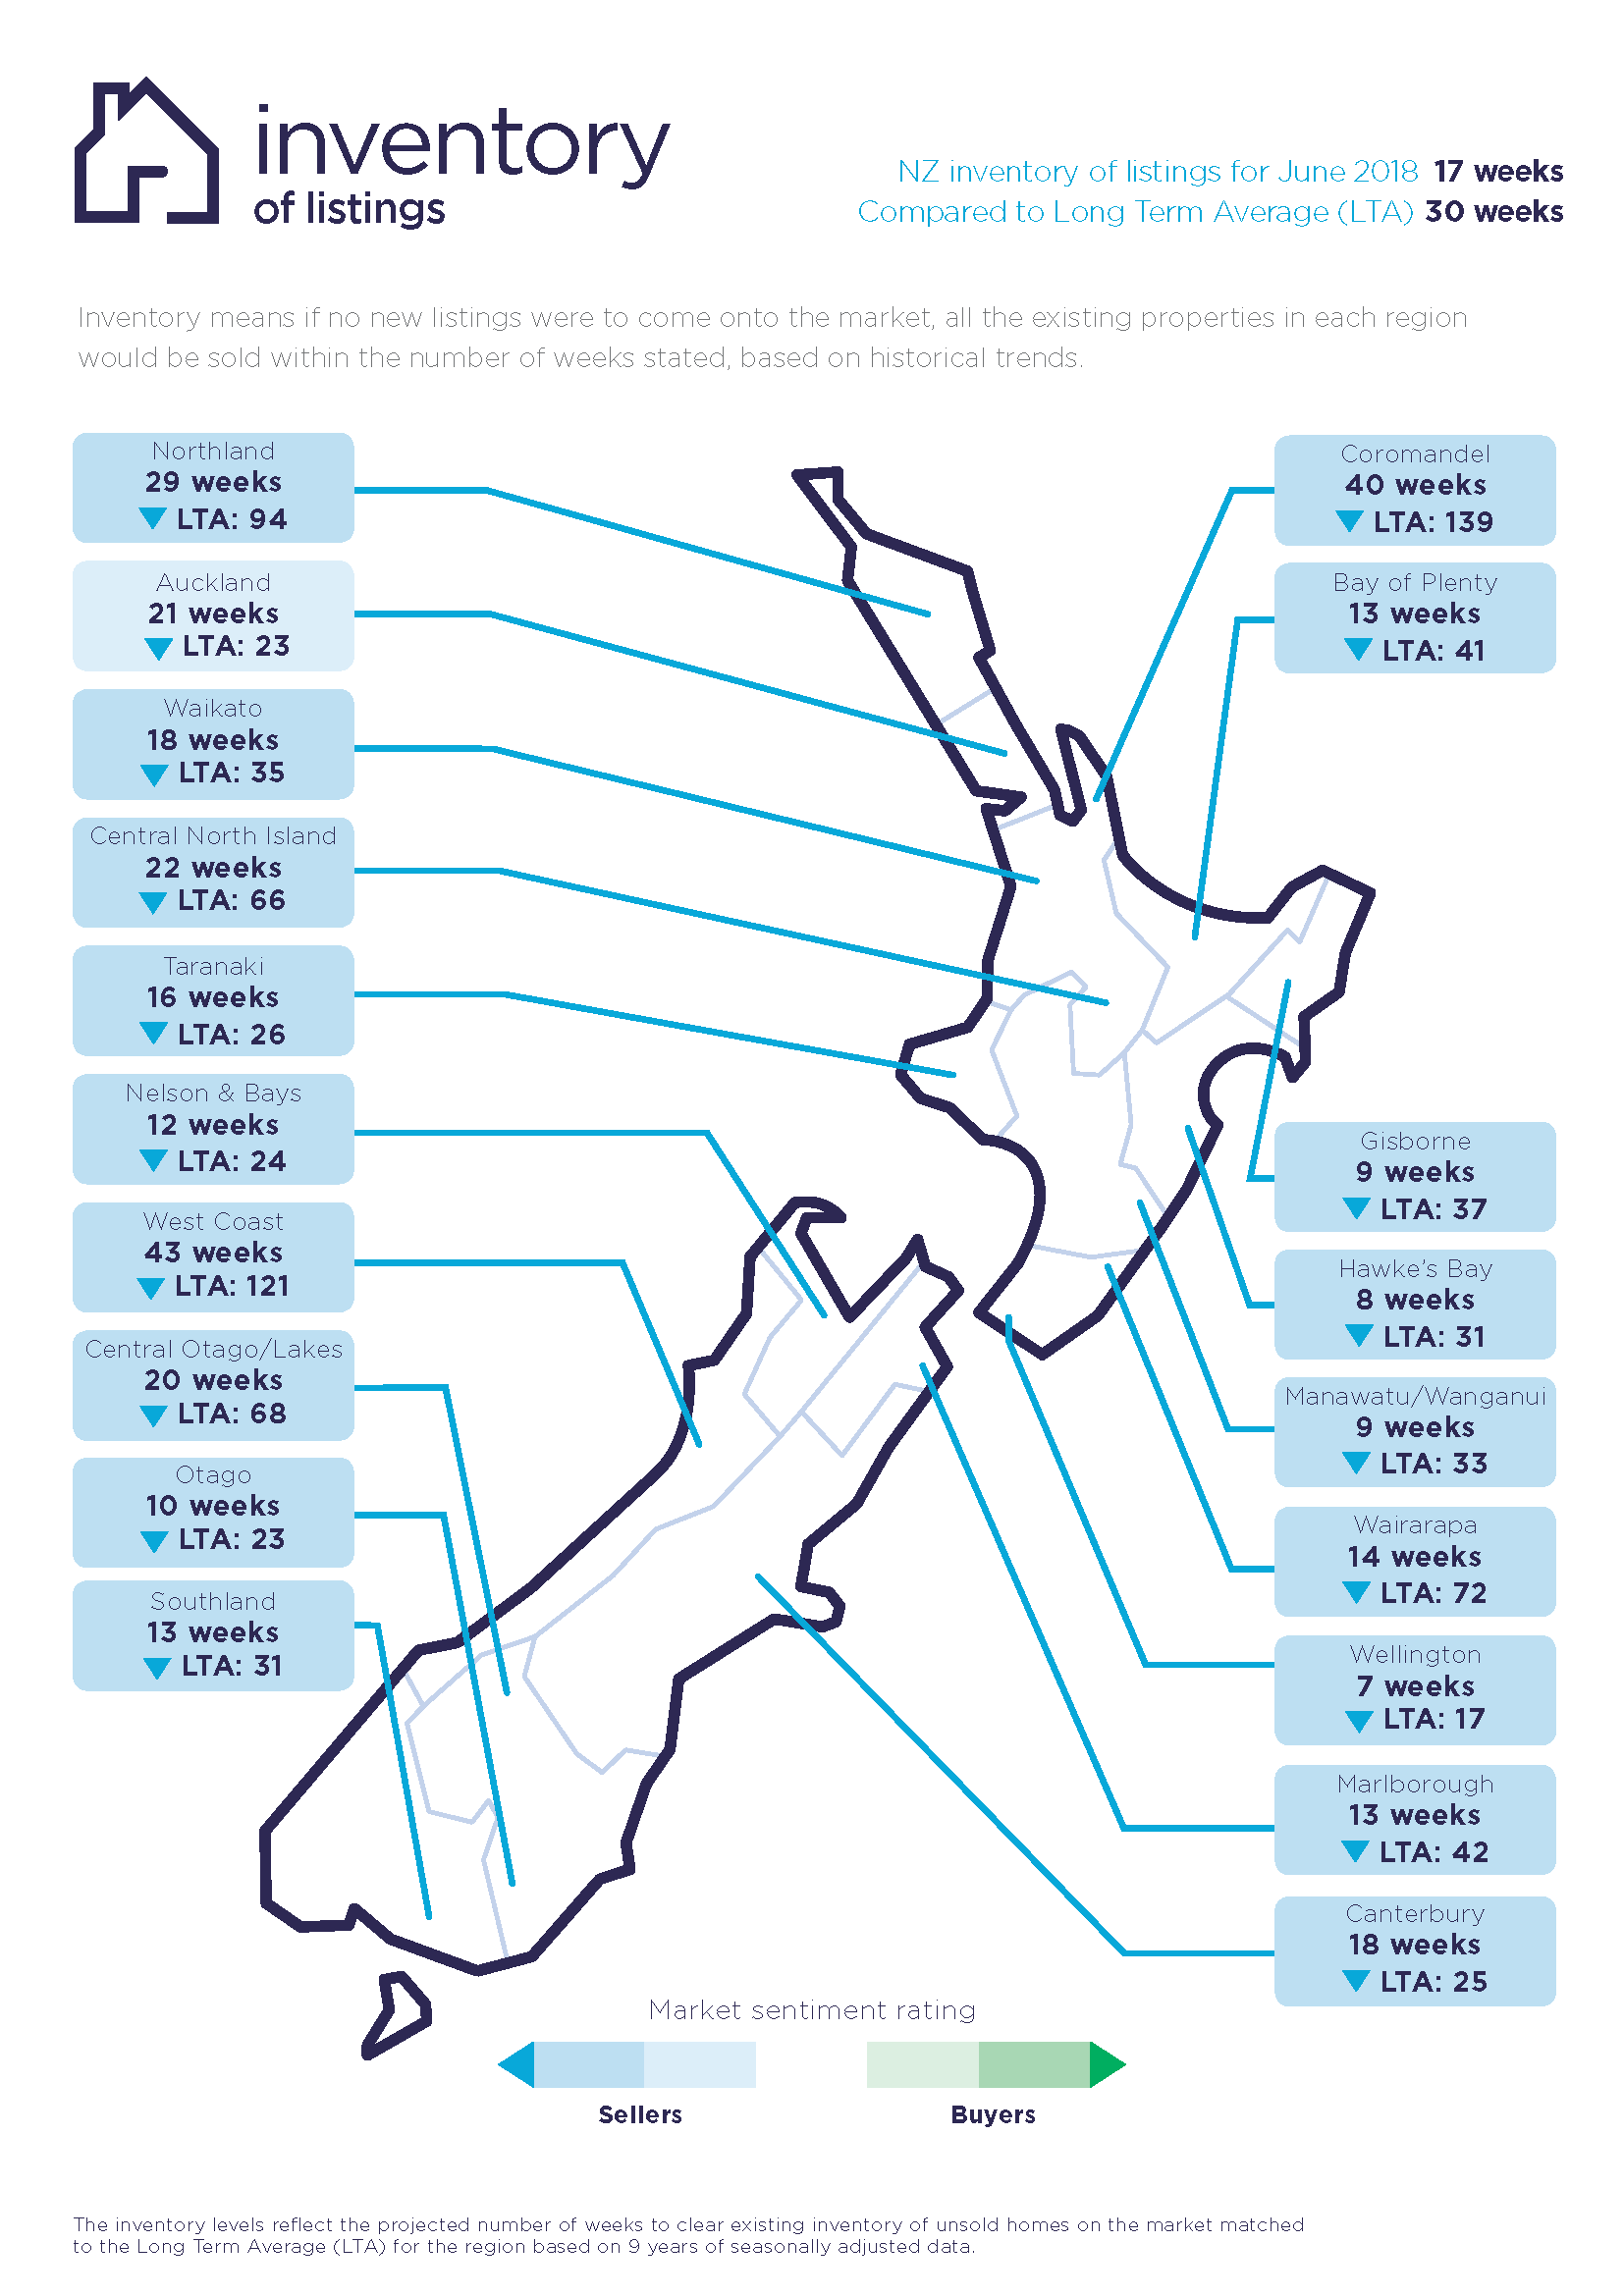
• Inventory is a measure of how long it would take, theoretically, to sell the current stock at current average rates of sale if no new properties were to be listed for sale. It provides a measure of the rate of turnover in the market.
• New listings are a record of all the new listings on realestate.co.nz for the relevant calendar month. As realestate.co.nz reflects 97% of all properties listed through registered estate agents in New Zealand, this gives a representative view of the New Zealand property market.
• Demand: the increase or decrease in the number of views per listing in that region, taken over a rolling three-month time frame, compared to the same three-month time frame the previous year – including the current month.
• Seasonal adjustment is a method realestate.co.nz uses to better represent the core underlying trend of the property market in New Zealand. This is done using methodology from the New Zealand Institute of Economic Research.
• Truncated mean is the method realestate.co.nz uses to provide statistically relevant asking prices. The top and bottom 10% of listings in each area are removed before the average is calculated, to prevent exceptional listings from providing false impressions.
Share
-
.svg)
.svg)
.svg)