
.svg)


Winter’s chill isn’t cooling the market – record high asking prices nationally.
The national average asking price is up 20.2%, and the stock squeeze continues with 33.3% less properties available compared to June last year.
Our real-time data this month has shown that 15 of New Zealand’s 19 regions hit 14-year record high asking prices in June, as stock challenges continue to put pressure on the property market.
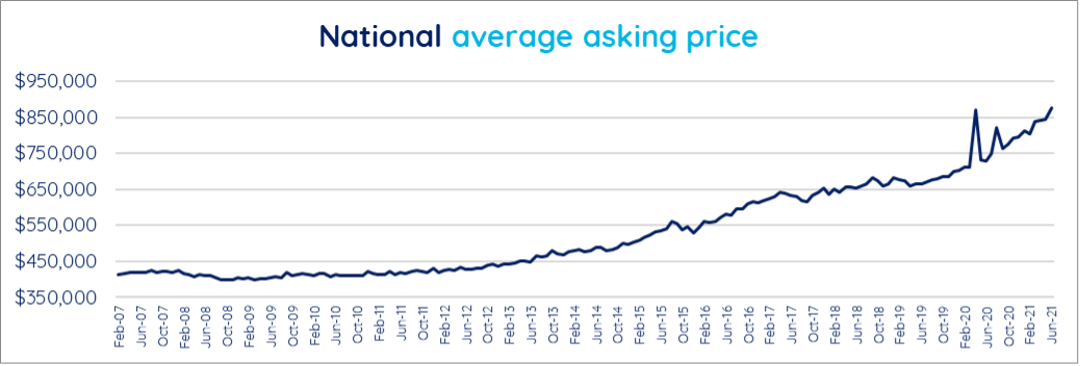
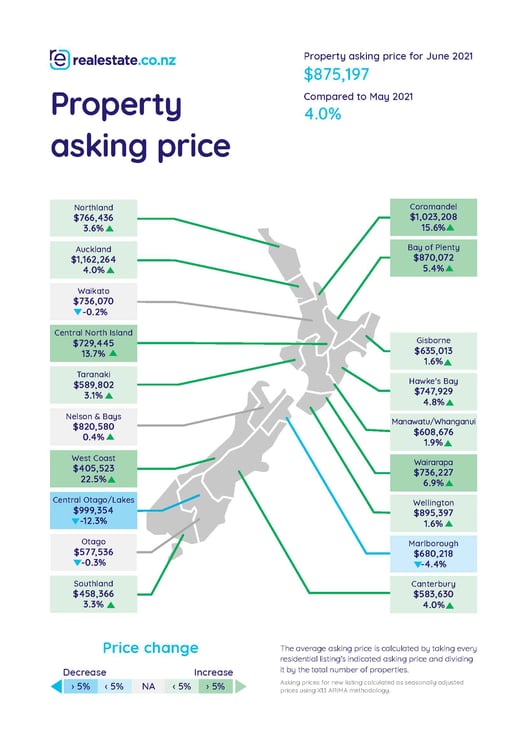
The national average asking price is now $875,197 – up 20.2% from $728,328 in June 2020.
“On average, Kiwi homes are costing nearly $150,000 more than they did this time last year and there aren’t any signs to suggest it will slow down,” says Vanessa Williams, spokesperson for realestate.co.nz.
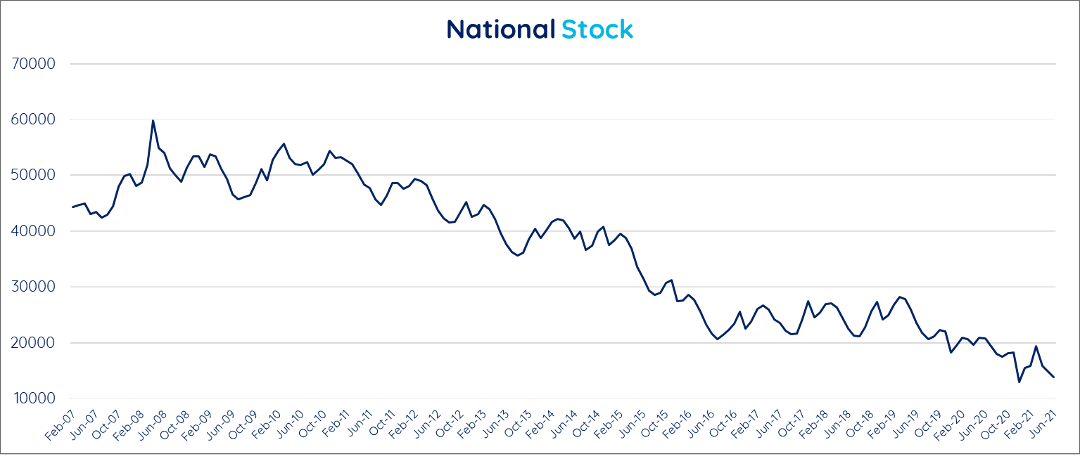
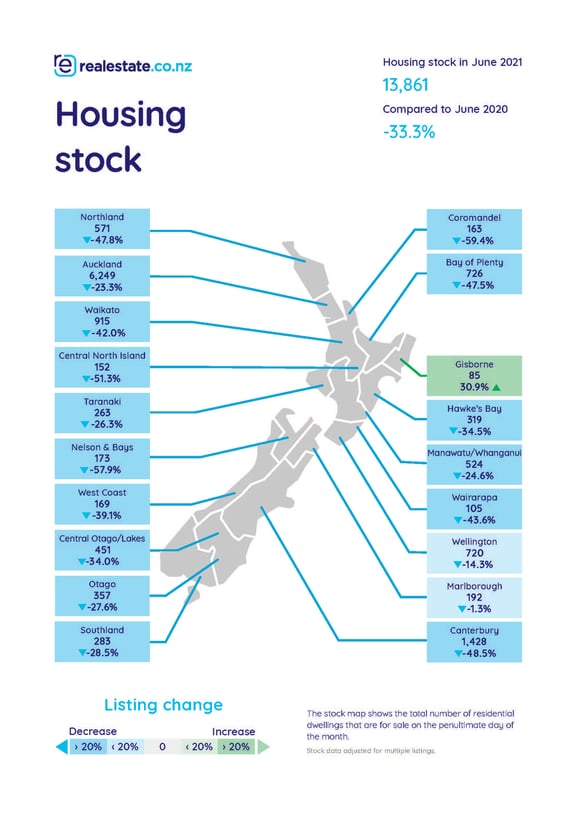
Total stock shortages continue to prove challenging for buyers, with 14-year record lows in five regions and national housing stock was down 33.3% on June 2020.
“This is a classic case of supply and demand. While Kiwis have closed borders and are unable to travel, property remains a focus. Demand is high, but there are not enough homes to purchase,” says Vanessa.
The region with the greatest average asking price increase in June was the West Coast, which moved from $256,921 to $405,523—a 57.8% jump in the last 12 months. Although not a record high, this is the highest asking price for the region in 14 years aside from April 2020, which was skewed substantially by COVID-19 and New Zealand being in lockdown.
This month REINZ reported that the West Coast was the only region in New Zealand with a rental yield of more than 5%, suggesting it is the best spot for investors.
Wairarapa and the Central North Island both broke 14-year records, with average asking prices increasing by 37.1% and 35.7% respectively.
Although their asking prices still increased year-on-year, Waikato (up 11.8% to $736,070), and Marlborough (up 28.7% to $680,218) regions didn’t break records.
Central Otago / Lakes District was the only region that saw prices cool year-on-year, with a -4.2% decrease to $999,354.
“This region has been a noteworthy outlier recently. Central Otago / Lakes District was one of the five regions that hit record stock lows this month (-34.0%), so it isn’t as if there is a surplus of properties pushing prices down,” Vanessa says.
District-level data paints an interesting picture: Queenstown district asking prices are down -13.4% compared to this time last year and are down by -27.5% from May 2021. Central Otago district asking prices also dipped by -3.7% from May, although rose by 4.2% compared to last year.
Total stock surges downward, particularly in Coromandel and Nelson & Bays, while demand smolders.
There were 14-year record stock shortages in Northland (-47.8%), Nelson & Bays (-57.9%), Canterbury (-48.5%), Coromandel (-59.4%) and Central Otago/Lakes District (-34.0%).
“There is a constant downward trend of the total inventory available for Kiwis to buy,” says Vanessa. “At the height of the market, we saw around 60,000 homes available at the end of April 2008. Today, we have under 14,000 homes available to buy.”
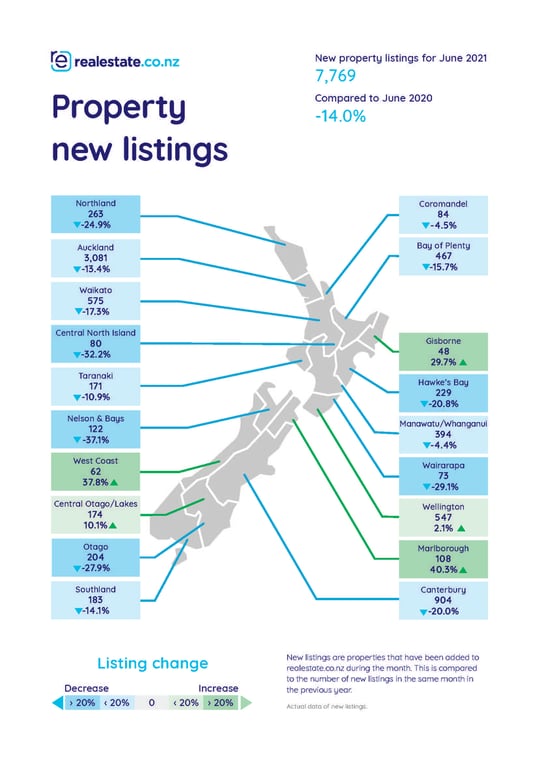
Only a handful of regions saw new listings rise year-on-year, including Marlborough (40.3%), the West Coast (37.8%), Gisborne (29.7%), Central Otago / Lakes District (10.1%) and Wellington (2.1%).
Looking ahead: Public and private sectors incentivised to address stock challenge.
New Zealand has seen several initiatives during 2021 focused on addressing housing stock challenges. For example, retail banks announced incentivised interest rates available to those Kiwis looking to build.
Vanessa suggests this is a step in the right direction if we want to get on top of the long-term stock shortage. “We’re seeing investors encouraged to refocus their resources into new builds rather than existing homes, and lower interest rates for those who are building or buying new. These are heartening signs.”
Auckland City Council looks to be taking the stock challenge seriously too—reports of increased apartment developments in central Auckland suburbs like Remuera, Newmarket, Takapuna and Mt Albert hit headlines this month.
“We may not see the benefit of these incentives immediately, but we’ll certainly feel the buzz of a building boom in the medium to long-term.”
For media enquiries, please contact:
Ashley Harder | 021 712 210 | ashley@realestate.co.nz
Glossary of terms:
As the only provider of real estate data in real-time, realestate.co.nz offers valuable property market information not available from other sources.
Average asking price is not a valuation. It is an indication of current market sentiment. Statistically, asking prices tend to correlate closely with the sales prices recorded in future months when those properties are sold. As it looks at different data, average asking prices may differ from recorded sales data released at the same time.
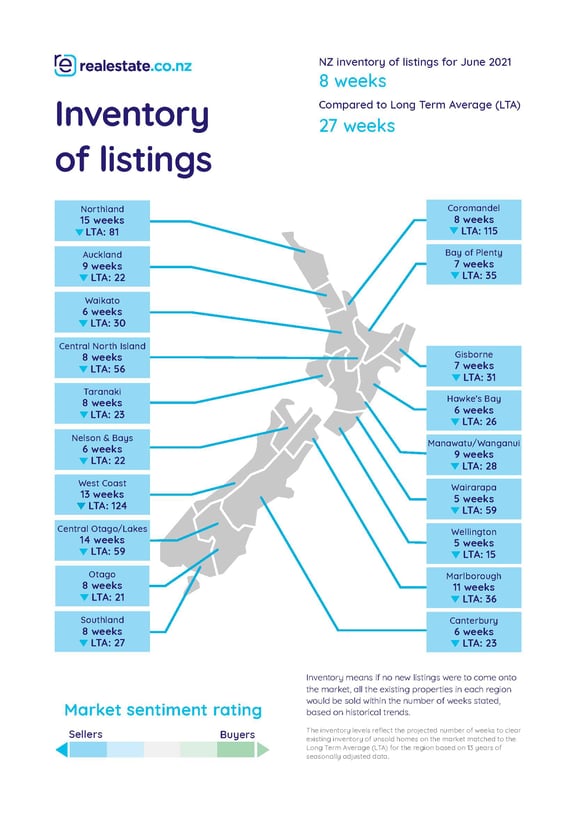
Inventory is a measure of how long it would take, theoretically, to sell the current stock at current average rates of sale if no new properties were to be listed for sale. It supplies a measure of the rate of turnover in the market.
New listings are a record of all the new listings on realestate.co.nz for the relevant calendar month. As realestate.co.nz reflects 97% of all properties listed through registered estate agents in New Zealand, this gives a representative view of the New Zealand property market.
Demand: the increase or decrease in the number of views per listing in that region, taken over a rolling three-month period, compared to the same three-month period the previous year – including the current month.
Seasonal adjustment is a method realestate.co.nz uses to better represent the core underlying trend of the property market in New Zealand. This is done using methodology from the New Zealand Institute of Economic Research.
Truncated mean is the method realestate.co.nz uses to supply statistically relevant asking prices. The top and bottom 10% of listings in each area are removed before the average is calculated, to prevent exceptional listings from providing false impressions.
Share
-
.svg)
.svg)
.svg)