
.svg)


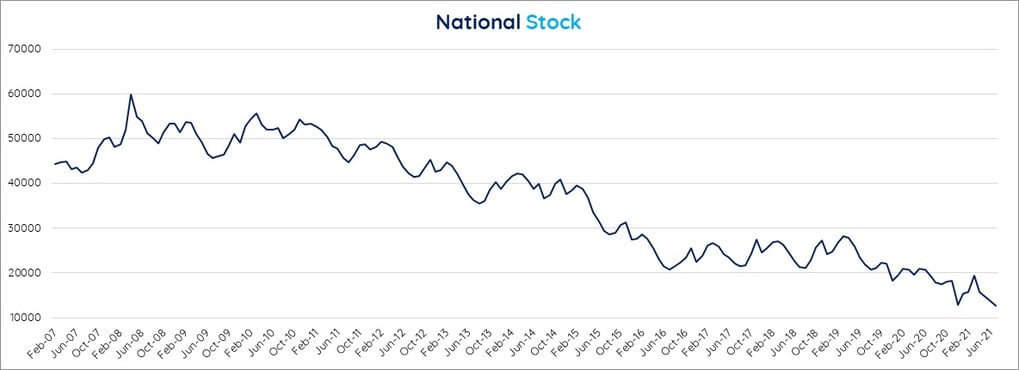
National housing stock hits a 14-year record low
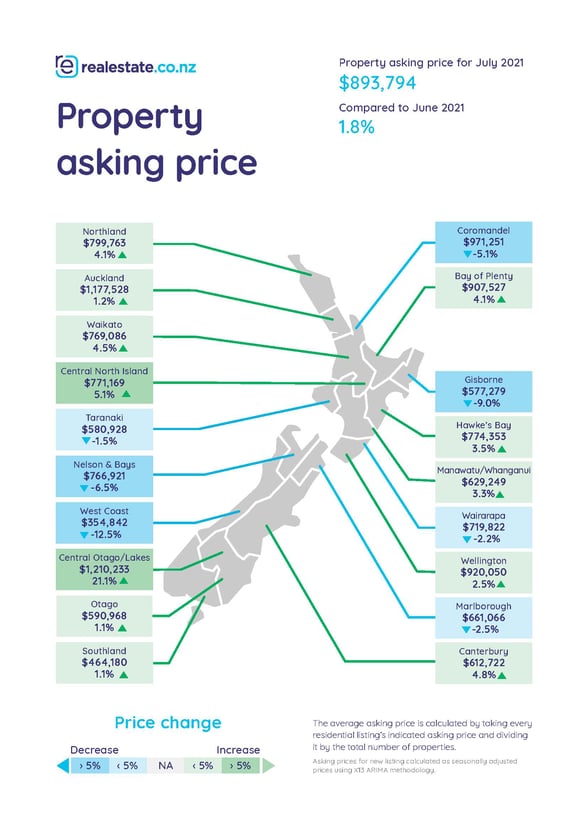
- Record high asking prices nationally, driven by 11 regions
- Eight regions plunged to 14-year record low stock
July was another record-breaking month for the New Zealand housing market—the national average asking price reached an all-time high at $893,794, while national inventory hit a record low, down -34.8% since this time last year.
-2.png?width=994&height=350&name=image%20(8)-2.png)
Vanessa Williams, spokesperson for realestate.co.nz, believes the national average asking price trend tells a fascinating story.
“When records began in 2007 through to 2013, national average asking prices rose by about $50,000 over that seven-year period. In the following five years they rose by about $200,000. But since the end of 2019, they’ve gone up by $200,000 again in the last two years.”
The Central North Island saw the highest asking price jump—up 48.0% to $771,169 compared to this time last year. Manawatu / Wanganui (up 25.8%) and Wellington (up 25.0%) followed, with average asking prices hitting $629,249 and $920,050 respectively.
Vanessa suggests winter’s chill may be playing a role in regions like the Central North Island. “With holidaymakers heading off to ski spots like Ruapehu last month, it could be that the winter wonderland is enticing Kiwis to purchase in areas with mountainous landscapes.”
Continuing the longstanding race for first, Central Otago / Lakes District has overtaken Auckland as the most expensive region to purchase a property, despite having its tourism intake impacted by COVID-19. Allowing for seasonal adjustment, the average home in the region is now priced at a record $1,210,233. Although dethroned from the top spot, Auckland also hit another all-time high—the asking price for a home in the Auckland region is now $1,177,528, up 19.3% on July 2020.
Other record highs include Hawke's Bay (up 23.8% to $774,353), Bay of Plenty (up 23.7% to $907,527), Waikato (up 17.3% to $769,086) Northland (up 16.5% to $799,763), Canterbury (up 16.4% to $612,722), Southland (up 14.6% to $464,180) and Otago (up 14.0% to $590,968).
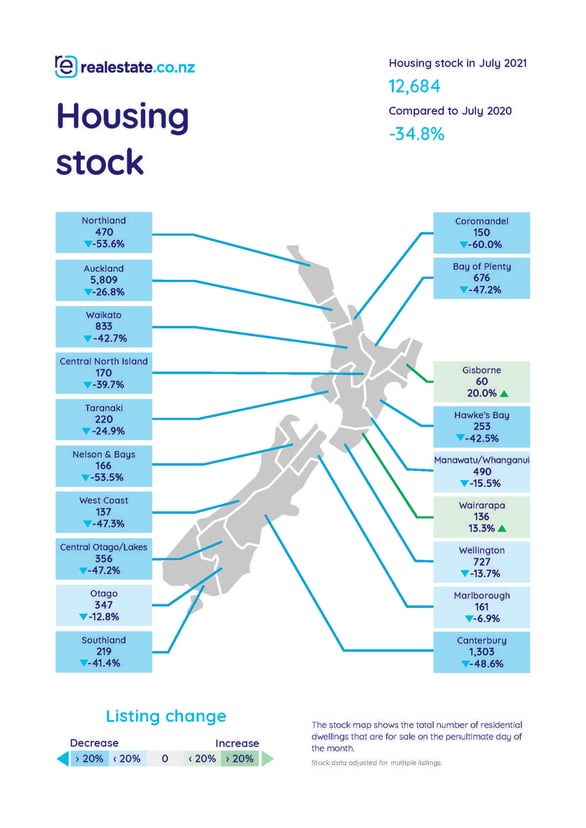
Record stock shortages in eight regions and nationally
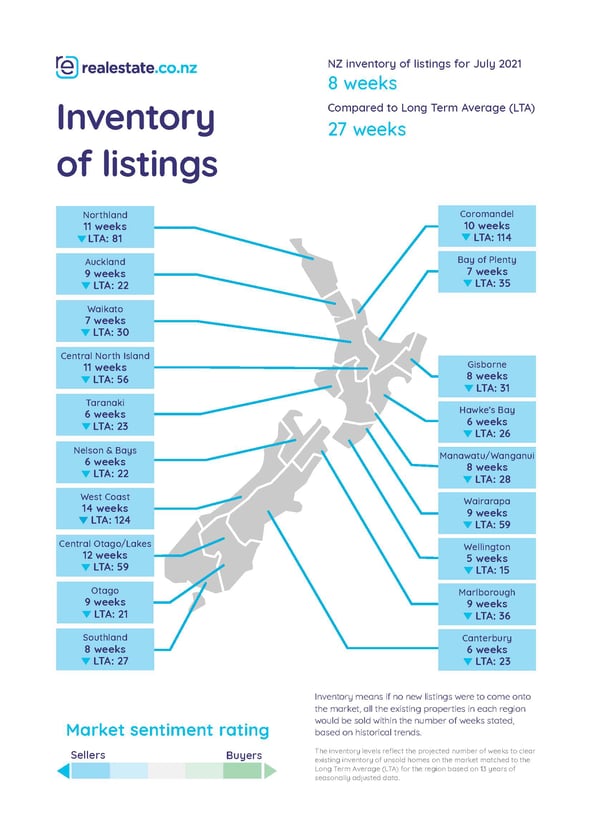
There are now only 12,684 homes available to purchase across the country, down -34.8% compared to July 2020—a 14-year record low.
Coromandel, Northland, and Nelson & Bays have seen their housing stock more than halve in a year, dipping -60.0%, -53.6%, and -53.5% respectively.
Vanessa suggests that the Coromandel’s supply is stark, but the stock shortages in Northland and Nelson & Bay are more intriguing.
“The Coromandel is often an outlier—the region is always attractive to buyers and investors alike, so it’s no surprise that availability is tight. There were 150 homes available to buy in the region at the end of June, a record low for the bach lovers’ peninsula.”
“But at its peak in December 2010 Northland had over 4,600 properties available to buy.” Vanessa continued. “Now it has just 470—a drop of 90% in nine years.”
“Although on a smaller scale, Nelson & Bays is a similar story. At the height of its housing availability, the region had 1,072 properties to buy. This month, it had only 166.”
Canterbury (-48.6%), the West Coast (-47.3%), Central Otago / Lakes District (-47.2%), Southland
(-41.4%), and Taranaki (-24.9%), also hit 14-year record lows.
Wairarapa was the only region that saw housing stock increase—there were 136 homes available to purchase in the region last month—up 13.3% since last year.
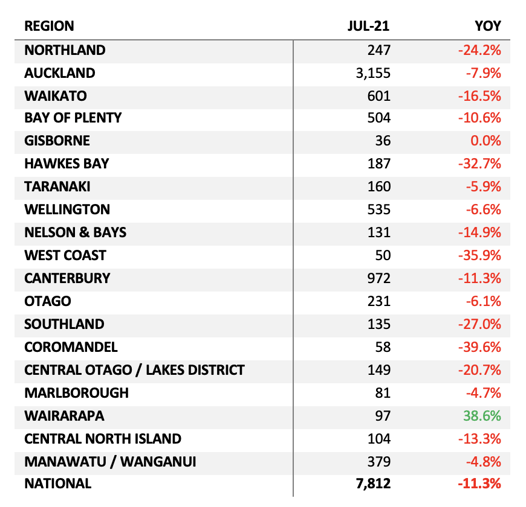
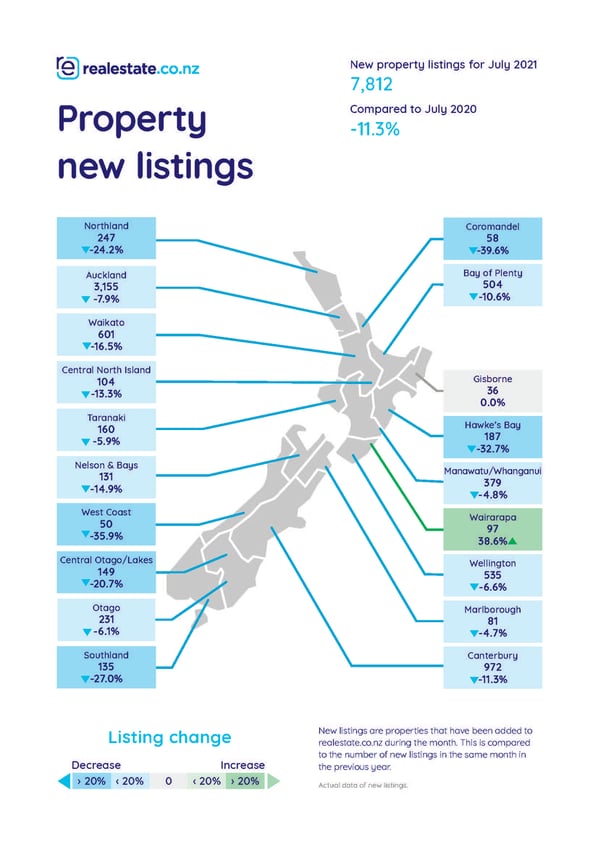
Northland and Coromandel new listings were in lockstep with their stock shortages—down -24.2% and -39.6% respectively. Although not record lows, the only time there were less new listings in these regions was in April 2020 when we were in COVID-19 lockdown.
The West Coast (-35.9%), Hawke’s Bay (-32.7%), and Southland (-27.0%) also had noteworthy dips in new listings compared to this time last year.
Wairarapa was an outlier again—they were the only region that saw a year-on-year increase in new property listings.
“Wairarapa bucked the trend this month—the bump in new listings and a stock increase. It was heartening to see vendors so active in the region; it might be one to watch in the coming months.” said Vanessa.
For media enquiries, please contact:
Ashley Harder | 021 712 210 | ashley@realestate.co.nz
Glossary of terms:
As the longest-standing provider of real estate data in real-time, realestate.co.nz offers valuable property market information not available from other sources.
Average asking price is not a valuation. It is an indication of current market sentiment. Statistically, asking prices tend to correlate closely with the sales prices recorded in future months when those properties are sold. As it looks at different data, average asking prices may differ from recorded sales data released at the same time.
Inventory is a measure of how long it would take, theoretically, to sell the current stock at current average rates of sale if no new properties were to be listed for sale. It supplies a measure of the rate of turnover in the market.
New listings are a record of all the new listings on realestate.co.nz for the relevant calendar month. As realestate.co.nz reflects 97% of all properties listed through registered estate agents in New Zealand, this gives a representative view of the New Zealand property market.
Seasonal adjustment is a method realestate.co.nz uses to better represent the core underlying trend of the property market in New Zealand. This is done using methodology from the New Zealand Institute of Economic Research.
Truncated mean is the method realestate.co.nz uses to supply statistically relevant asking prices. The top and bottom 10% of listings in each area are removed before the average is calculated, to prevent exceptional listings from providing false impressions.
Share
-
.svg)
.svg)
.svg)