
.svg)


Smouldering demand as New Zealand eagerly awaits spring listing surge and alert level change
Another month of records: national average asking price is now $900,671, with the lowest housing stock since records began 14 years ago.
As New Zealand settled into its second collective Level 4 lockdown, behaviour in its housing market exhibited a remarkable difference when compared to the first wave of COVID-19—this time around, it seems the Kiwi love affair with property remained strong.
Real-time data from realestate.co.nz has shown that from 18th August 2021 – 30th August 2021, their visitors started spending more time on site (up 6.7%) and viewed more pages (up 7.4%) when compared to the previous period when the COVID-19 Delta variant still hadn’t reached the community.
Vanessa Williams, spokesperson for realestate.co.nz, says that although they saw a similar trend in April 2020, their site saw a notable difference in browsing behaviour this time around.
“Looking back on our data from April 2020, both visits to our site and the time spent looking at properties dropped initially. It wasn’t a surprise; Kiwis were going through a range of emotions,” said Vanessa. “Then slowly, we started to see time spent on site grow as people started thinking about buying a new home again, and they had more time to spend searching.”
However, Vanessa says that with this lockdown, the change happened almost instantly. “It was as if we saw a shift in browsing behaviour overnight. Although visits to our site cooled, it wasn’t nearly the drop we saw in April 2020. And those that were browsing seemed to be seriously searching. The story hasn’t changed—market demand is strong.”
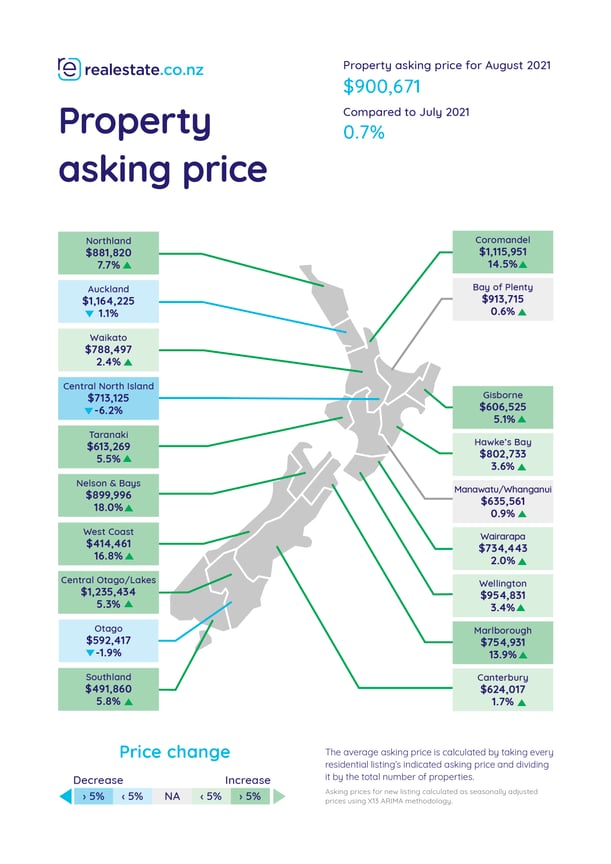
National average asking price hits $900,671, led by eleven regions
For the first time, New Zealand’s national average asking price surpassed $900,000 this month, up 9.7% compared to August 2020. Eleven regions lead the charge—with Coromandel (up 39.7% to $1,115,951), the West Coast (up 35.3% to $414,461), and Manawatu / Wanganui (up 30.6% to $635,561) seeing the highest year-on-year jumps.
“It’s too early to see if the Delta lockdown will have any impact on the national average asking price, but if the last year of data tells us anything, it seems unlikely,” said Vanessa.
Central Otago / Lakes has held its title as the most expensive area to purchase a property—the region hit another record high this month. A property near the Remarkables now costs $1,235,434—up 16.5% compared to this time last year.
“Initially, the impact of COVID-19 was felt the most acutely in this region, so it’s rather heartening to see that the property market in Central Otago / Lakes has weathered the storm.”
Although it didn’t hit a record high this month, Auckland has kept close on its tail. The average Auckland home is now priced at $1,164,225, up 18.9% year-on year.
Other 14-year record high average asking prices were Hawke’s Bay (up 29.2% to $802,733), Southland (up 26.6% to $491,860), Wellington (up 26.4% to $954,831), Nelson & Bays (up 24.9% to $899,996), Northland (up 23.3% to $881,820), Bay of Plenty (up 19.9% to $913,715), Taranaki (up 19.8% to $613,269), Waikato (up 19.3% to $788,497), Canterbury (up 17.8% to $624,017).
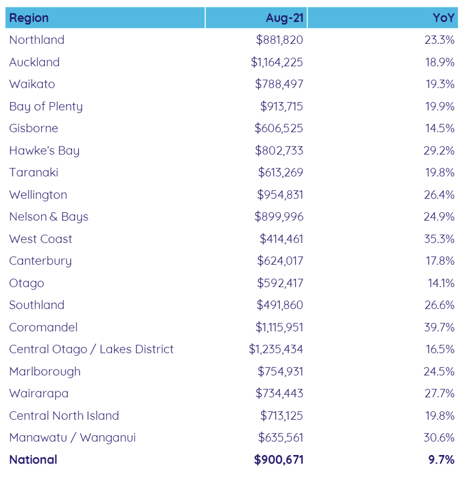
(The above data is calculated on a seasonally adjusted 80% truncated mean)
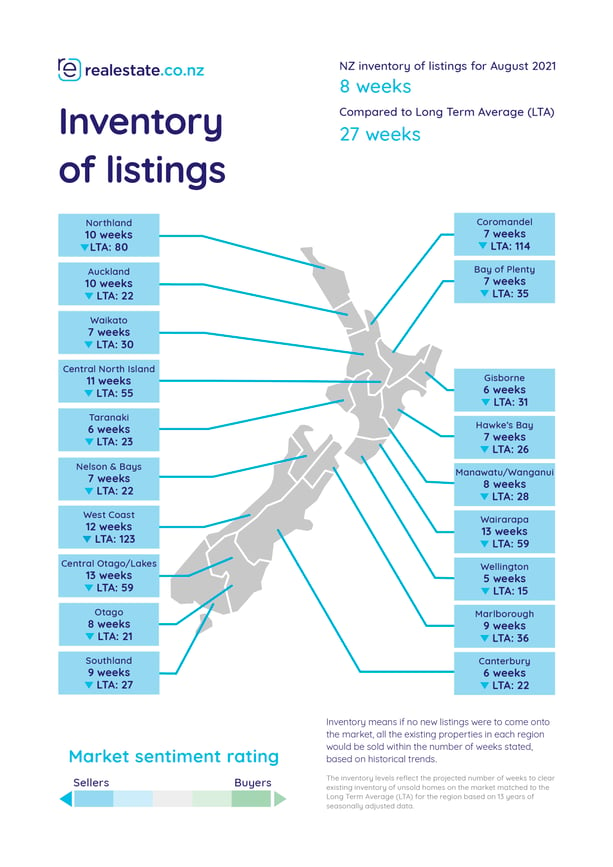
Listings cool in line with alert level restrictions
On average, realestate.co.nz gets between 300-500 new listings per working day in the current market. When the lockdown began on the 18th of August, that number dropped to less than 150. But Vanessa says this is to be expected.
“During Alert Level 4, I’d be very surprised to see agents listing new properties in droves. They can’t hold viewings or get photos collected, so I’d expect much fewer properties coming to market.”
“What will be interesting, however, is what happens this spring,” Vanessa continued. “There could be a swell of pent-up properties bursting onto the market.”
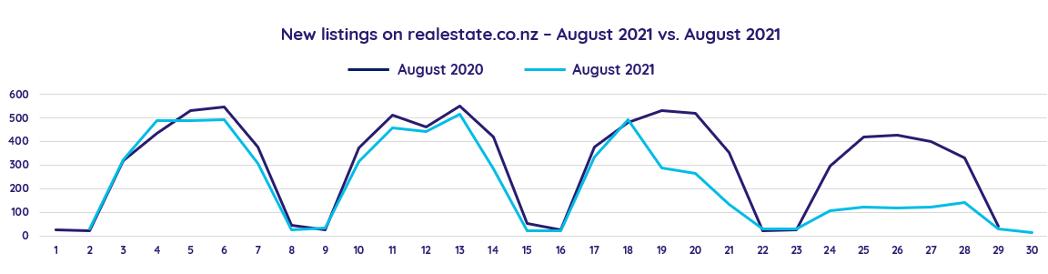
What a difference a level makes: New Zealand was in a Level 2 and Auckland was in level 3 lockdown in August 2020.
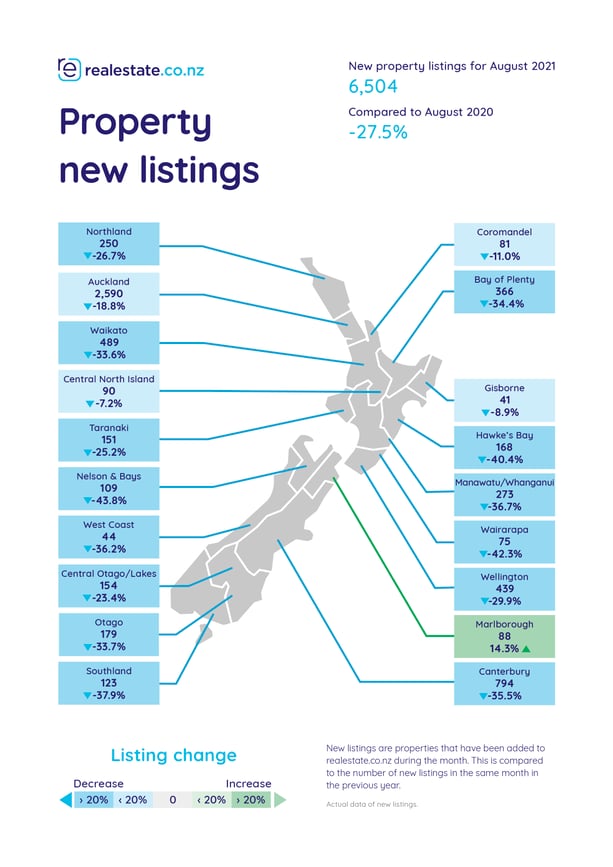
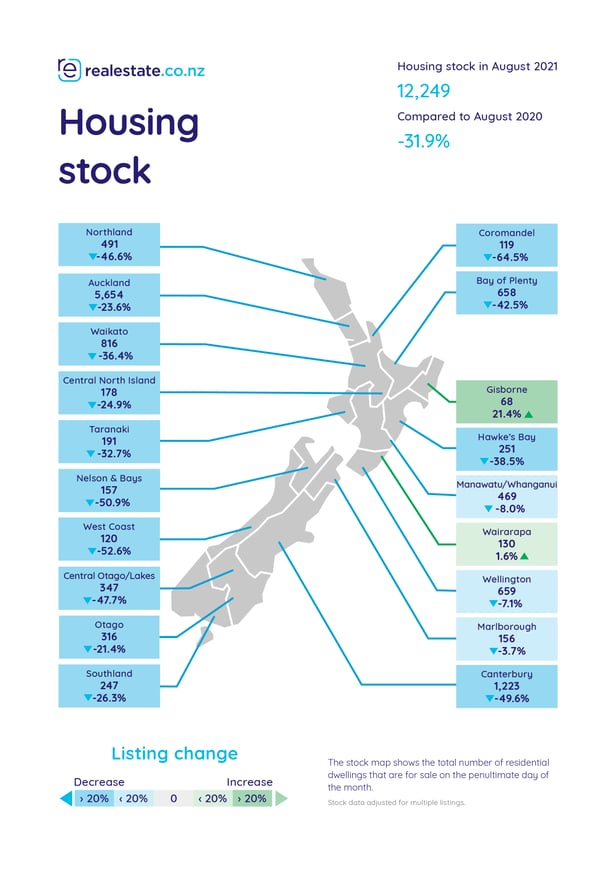
Looking ahead: -31.9% less houses to buy since this time last year, but stock could bloom in spring
New Zealand saw another month of record-low stock in August, both nationally and in seven regions, including the Coromandel (-64.5% year-on-year), Central Otago / Lakes district (-47.7% year-on-year), Canterbury (-49.6% year-on-year), the West Coast (-52.6% year-on-year), Nelson & Bays (-50.9% year-on-year), Taranaki (-32.7% year-on-year), and the Bay of Plenty (-42.5% year-on-year).
This trend has been ongoing for several months, and Vanessa wonders if the stock shortage may be partly down to a self-fulfilling prophecy. “Plenty of factors are at play with our stock shortage, but with several reports of sellers unable to find a new home to live in, it’s no wonder that some have been hesitant to list their houses. This contributes to lower stock—it becomes a bit of a cycle.”
“But spring is on our doorstep,” Vanessa continued. “This is one of the best times to buy and sell property. With a large portion of the country coming into Alert Level 3 and plenty of sellers waiting to list their properties, I wouldn’t be surprised if we see a heavy transaction season.”
For media enquiries, please contact:
Ashley Harder | 021 712 210 | ashley@realestate.co.nz
As the longest-standing provider of real estate data in real-time, realestate.co.nz offers valuable property market information not available from other sources to make it easier for New Zealanders to buy and sell property.
Glossary of terms:
Average asking price is neither a valuation nor the sale price. It is an indication of current market sentiment. Statistically, asking prices tend to correlate closely with the sales prices recorded in future months when those properties are sold. As it looks at different data, average asking prices may differ from recorded sales data released at the same time.
New listings are a record of all the new residential dwellings listed for sale on realestate.co.nz for the relevant calendar month. As the site reflects 97% of all properties listed through licensed real estate agents in New Zealand, this gives a representative view of the New Zealand property market.
Seasonal adjustment is a method realestate.co.nz uses to better represent the core underlying trend of the property market in New Zealand. This is done using methodology from the New Zealand Institute of Economic Research.
Truncated mean is the method realestate.co.nz uses to supply statistically relevant asking prices. The top and bottom 10% of listings in each area are removed before the average is calculated, to prevent exceptional listings from providing false impressions.
Stock is the total number of residential dwellings that are for sale on realestate.co.nz on the penultimate day of the month.
Share
-
.svg)
.svg)
.svg)