
.svg)


Download the full New Zealand Property Report as a PDF
Real-time statistics from realestate.co.nz show June as a month of highs and lows right across the country.
Four regions saw an all-time high average asking prices, while four other regions registered all-time low new listing numbers.
When realestate.co.nz started collecting data 12 years ago (2007), the average asking price for a home in New Zealand was $410,666.
By June this year, it had climbed to $659,422 which is a 60.6% increase.
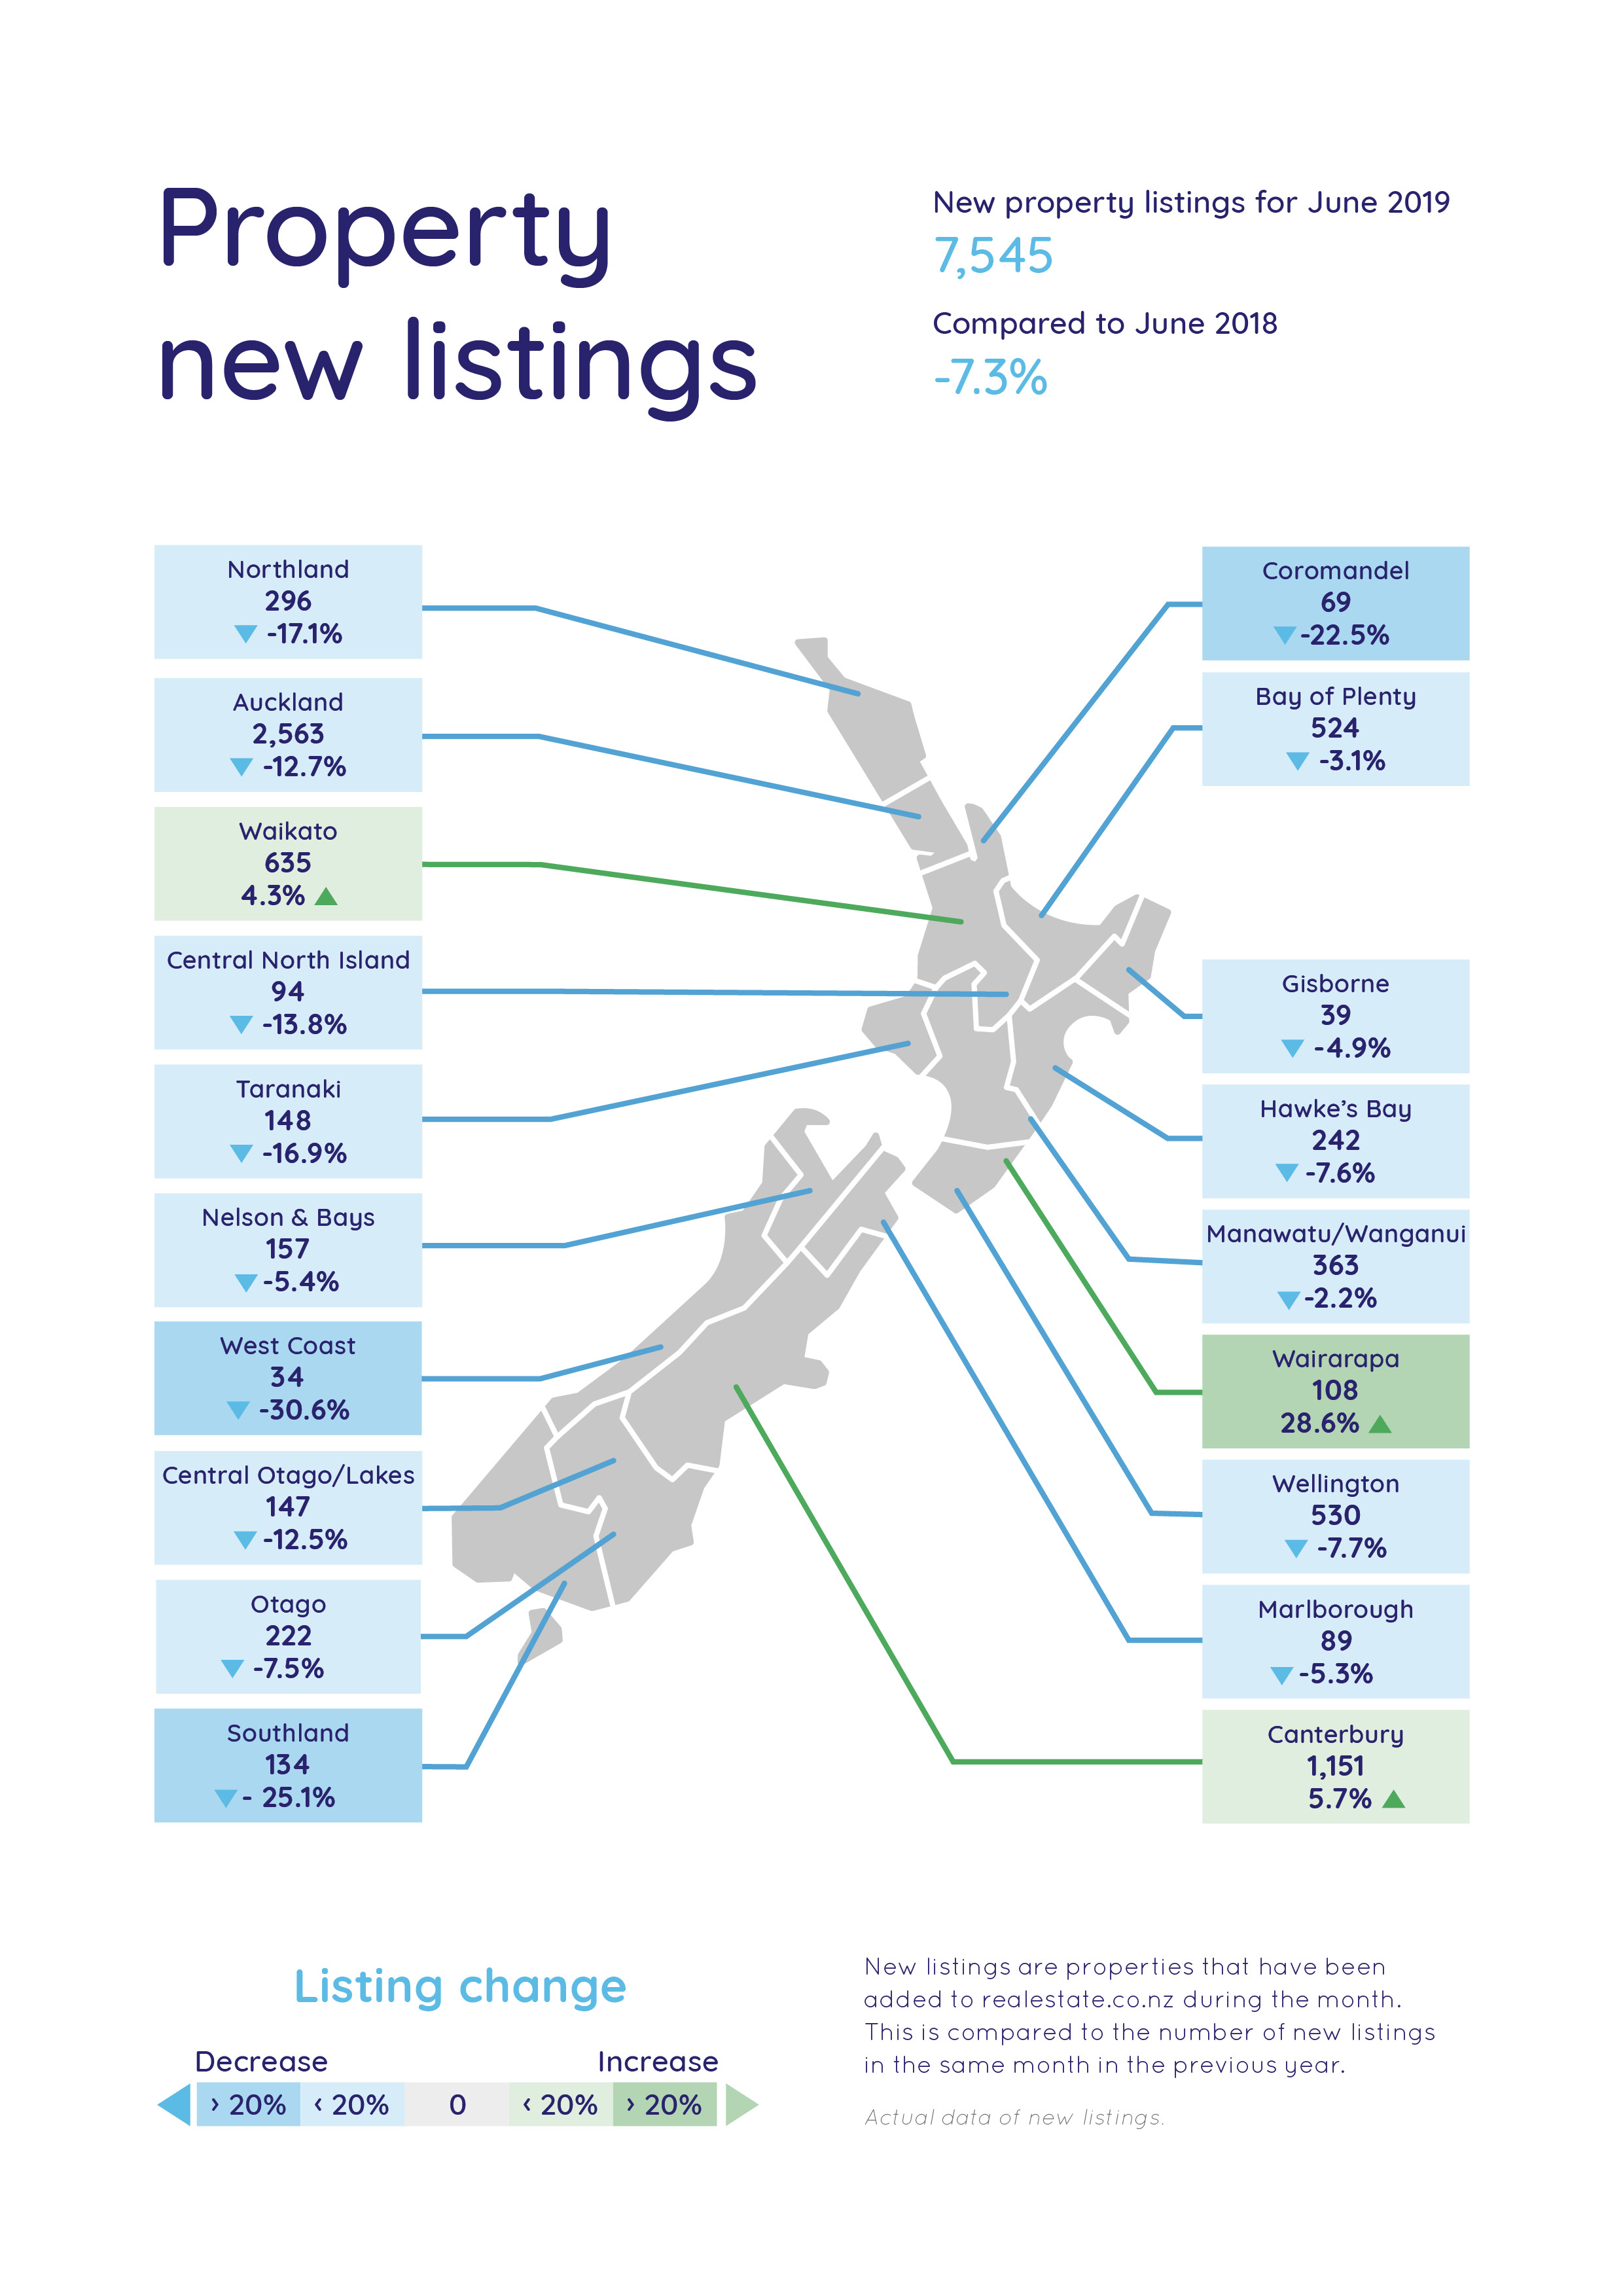
New listings painted the opposite picture, falling from 12,345 in January 2007 to 7,545 in June 2019. This represents a 38.9% drop over this period.
“The property market changes month to month however looking back over an extended period of time it always paints an interesting picture", says realestate.co.nz spokesperson Vanessa Taylor.
Record average asking prices set for Wellington, Manawatu-Wanganui, Canterbury and Southland regions.
June’s average asking prices in Southland increased by 1.6% compared to the previous month to $350,321.
“The Southland region also recorded a modest increase, tipping over the $350,000+ mark for the first time which is significant for our most southern region,” says Vanessa.
Nationally, the average asking price remained relatively flat with a slight increase of 0.4% on May 2019.
The region with the biggest jump this month (although it was not an all-time high) was the Marlborough region hitting $529,617, an increase of 9.2%.
“The last 12 years has shown us that we continue to see the average asking price of property drive upwards at varying speeds,” says Vanessa.
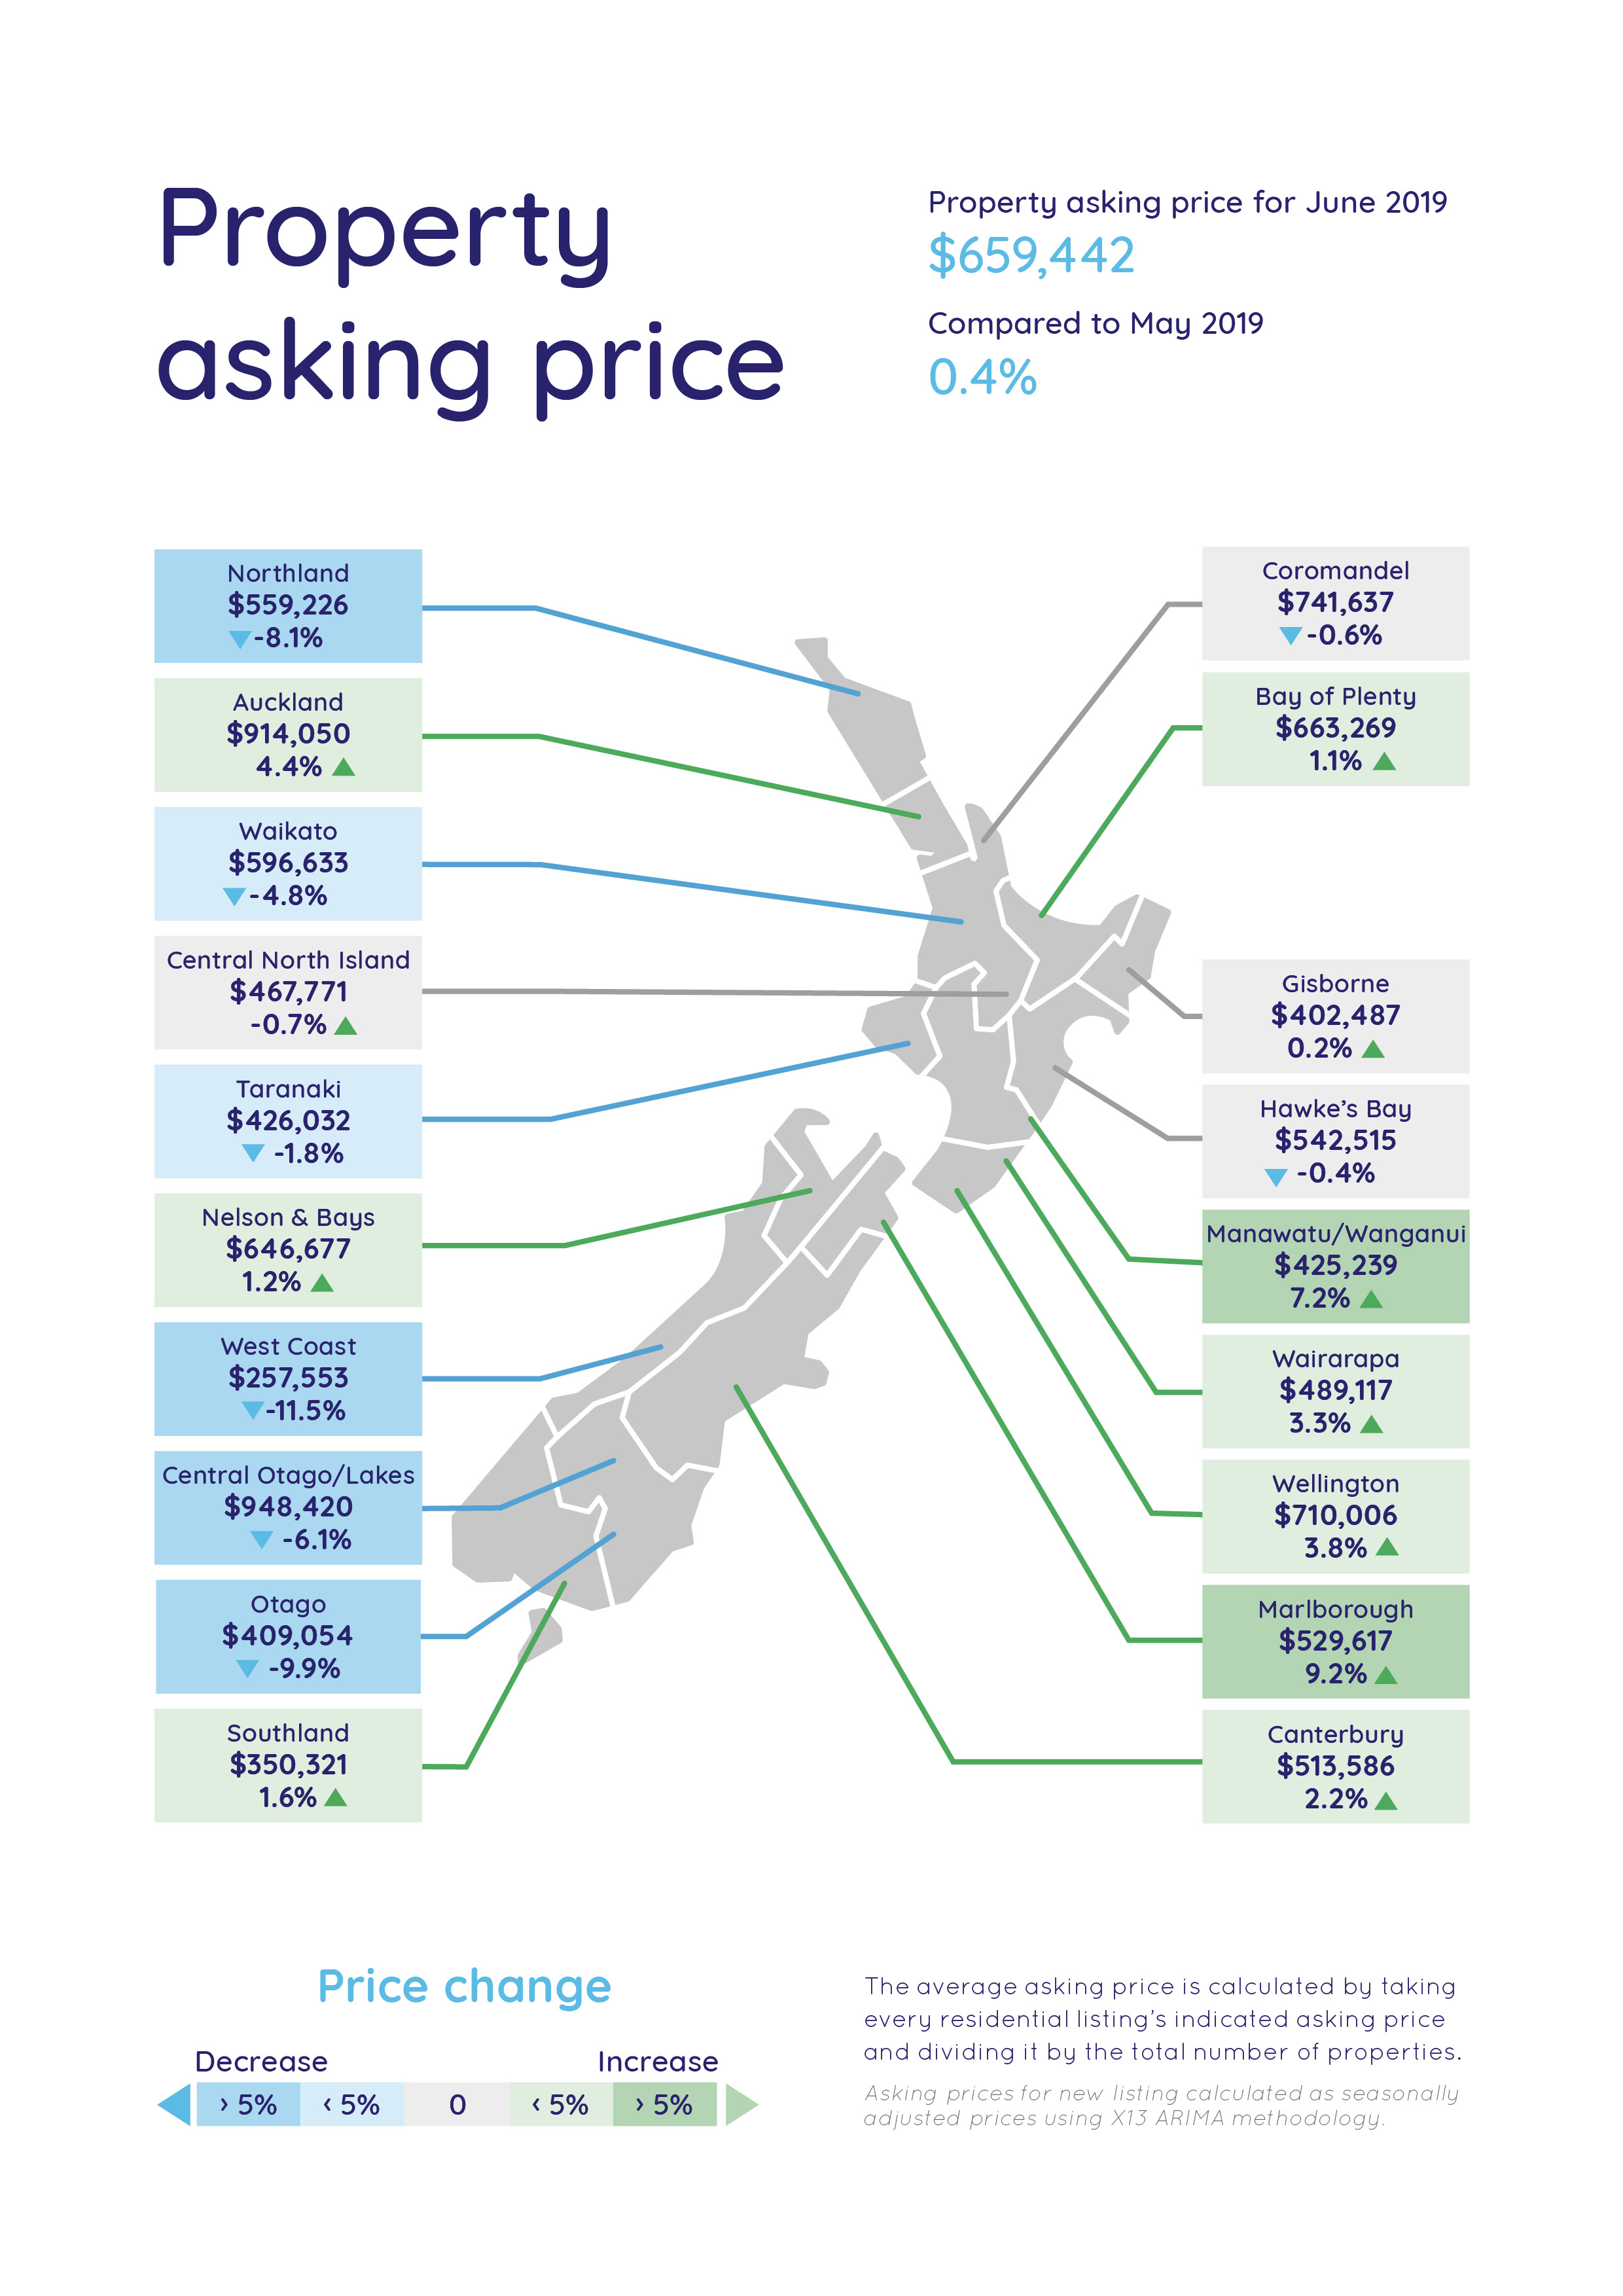
The Manawatu-Wanganui region led the way in June, registering a record average asking price high of $425,239 which represents a 7.2% increase on the previous month.
“All highs are taken from 12 years’ worth of data, going back to when our records began in 2007,” says Vanessa.
Next up, the Wellington region saw a 3.8% increase, jumping up over the $700,000 mark for the first time.
“The region’s average asking price has climbed slowly but steadily, sitting in the $600,000+ bracket for the past 16 months until finally breaking into the $700,000+ asking price bracket this June.”
The Canterbury region’s record average asking price of $513,586 was more modest in percentage terms (up 2.2%) but cements it into the $500,000+ bracket. Over the last 12 months it hovered for much of the time between high $400,000 and low $500,000 asking price range.
Record new listing lows set for Northland, Taranaki, West Coast and the Coromandel.
While June this year registered highs, it also saw its share of lows.
The region of West Coast saw an almighty drop of 30.6% in new listings, with only 34 coming onto the market when compared with June 2018.
Following the West Coast, we saw the sea-side region of the Coromandel drop 22.5% in new listings when compared to same time last year, with only 69 hitting the market during June 2019.
Northland saw a drop of 17.1% with 296 new listings put up for sale.
To round out the all-time lows, we saw the Taranaki region dip 16.9% to 148 new listings.
Nationally, 7,545 new listings came onto the market in June for property seekers to peruse. This was a considerable 7.3% drop from the same time last year.
History paints the opposite picture to asking prices when it comes to new listings, which have trended downward since 2007.
“Property seekers continue to get squeezed for choice,” comments Vanessa.
Auckland region’s average asking prices back up over the $900,000 mark after a three-month slide, but new listings are scarce.
In June this year, the average asking price for a home in the Auckland region lifted back over the $900,000 mark after three consecutive monthly falls over March, April and May 2019.
June 2019’s average asking price stood at $914,050 which is up 4.4% compared to May 2019.
“When we started recording data 12 years ago on realestate.co.nz, it showed that the average asking price for a home in the Auckland region in June 2007 was $536,993,” says Vanessa.
“Ten years later, in June 2017, the average asking price had spiralled exponentially to $916,635 and looked like it was accelerating to the one-million-dollar price tag,” she says.
“This did not happen,” says Vanessa.
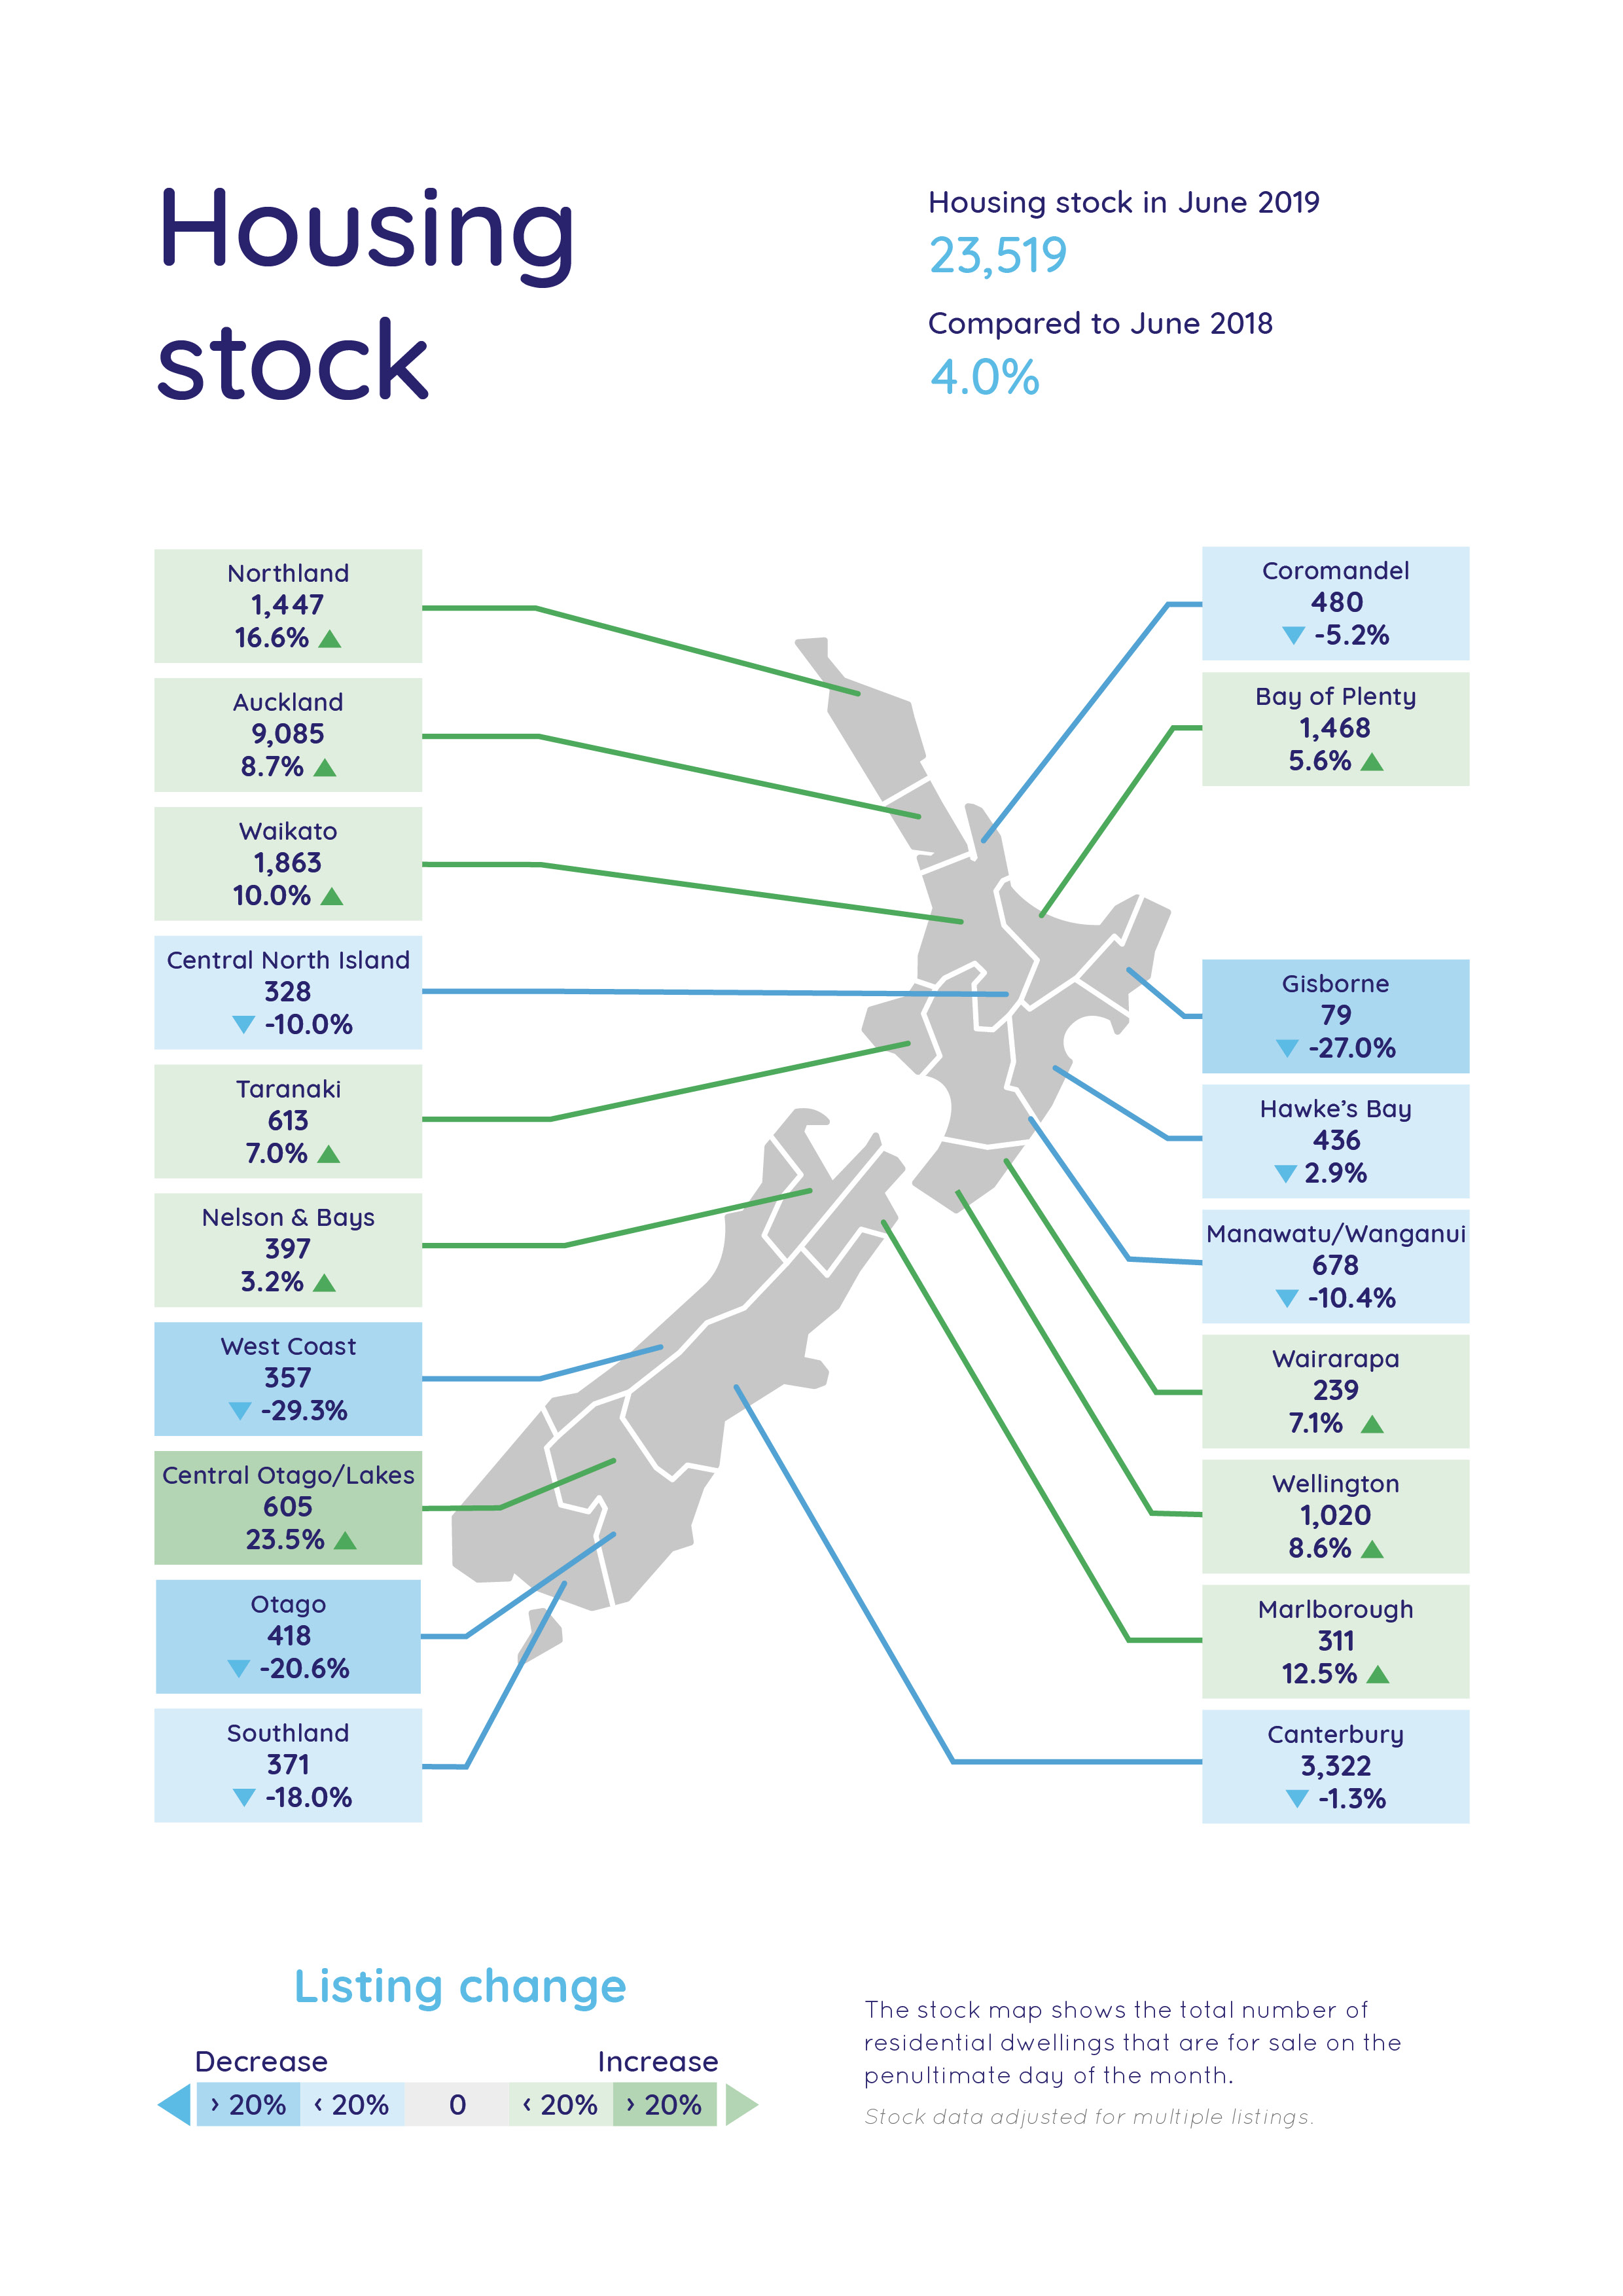
New listings in June (2,563) were down 12.7%, however, the total number of homes for sale was up 8.7% (9,085 listings) both compared to June 2018.
“This tells us that homes are staying on the market for longer.
“If people are serious about selling their home to purchase another in the same market, then perhaps they want to consider the pricing on both sides of the equation when approaching their negotiations.”
Glossary of terms:
As the only provider of real estate data in real time, realestate.co.nz offers valuable property market information not available from other sources.
-
Average asking price is not a valuation. It is an indication of current market sentiment. Statistically, asking prices tend to correlate closely with the sales prices recorded in future months when those properties are sold. As it looks at different data, average asking prices may differ from recorded sales data released at the same time.
-
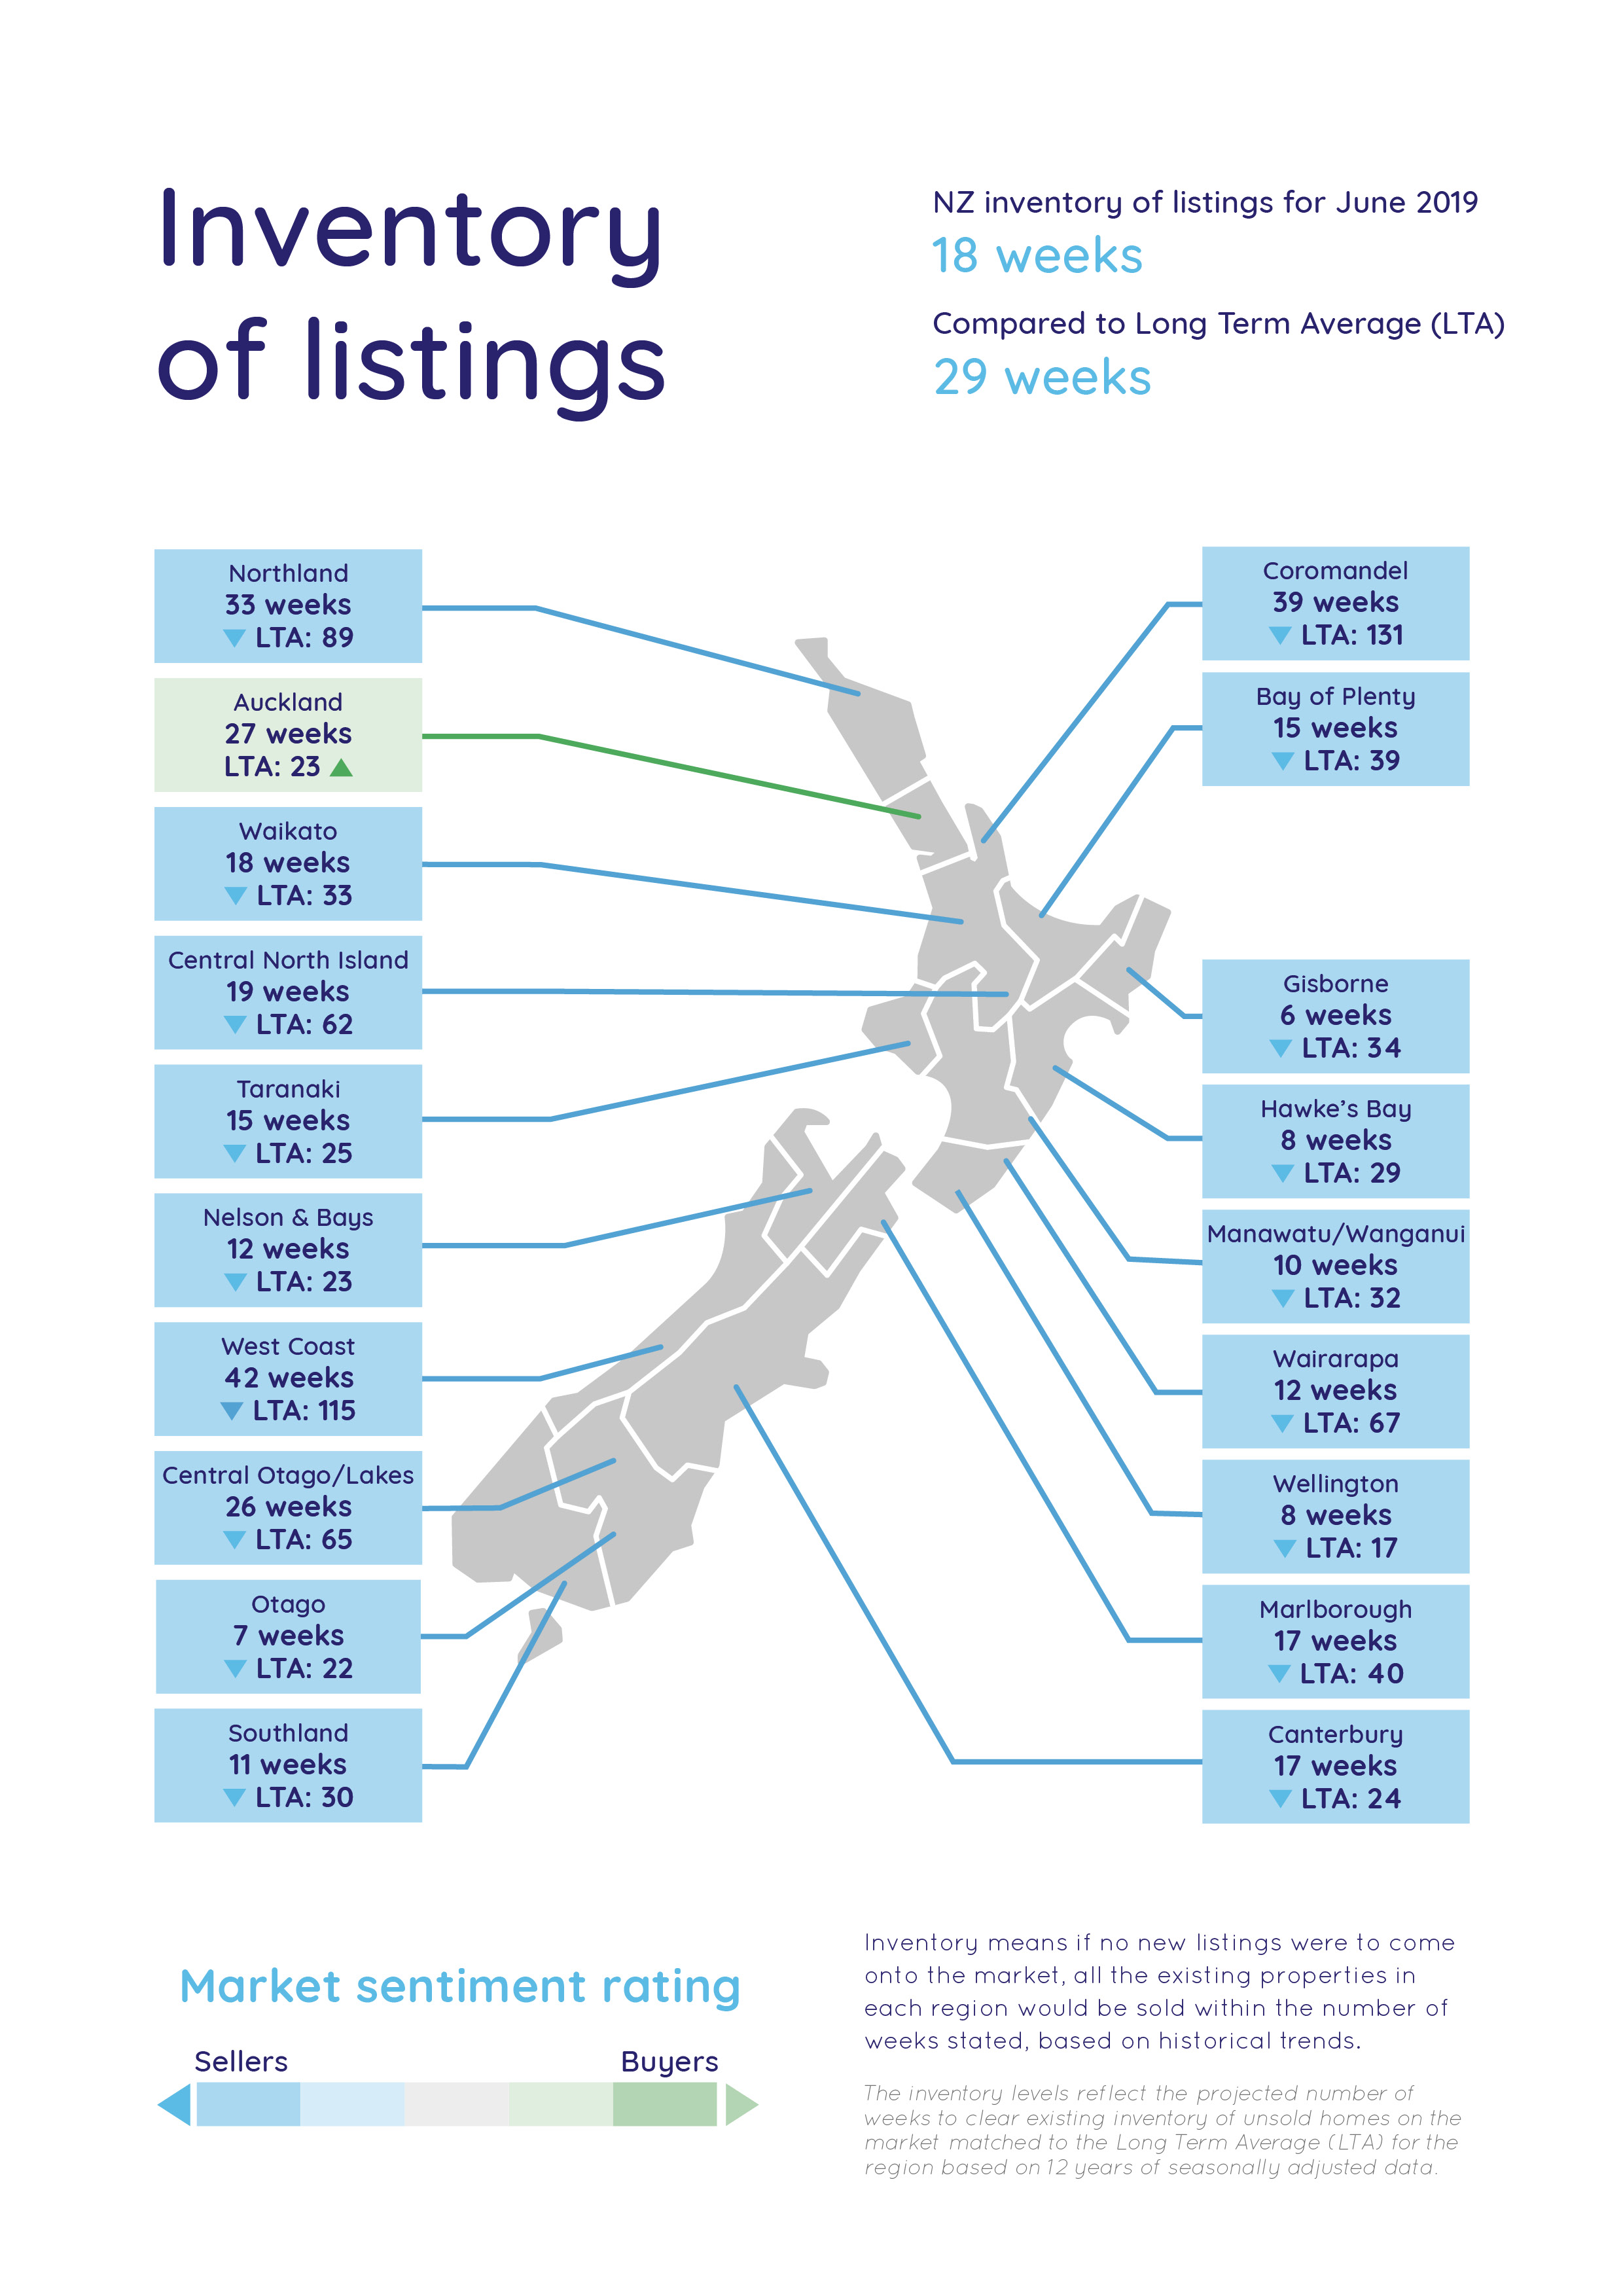
Inventory is a measure of how long it would take, theoretically, to sell the current stock at current average rates of sale if no new properties were to be listed for sale. It provides a measure of the rate of turnover in the market.
-
New listings are a record of all the new listings on realestate.co.nz for the relevant calendar month. As realestate.co.nz reflects 97 per cent of all properties listed through registered estate agents in New Zealand, this gives a representative view of the New Zealand property market.
-
Demand: the increase or decrease in the number of views per listing in that region, taken over a rolling three-month time frame, compared to the same three-month time frame the previous year – including the current month.
-
Seasonal adjustment is a method realestate.co.nz uses to better represent the core underlying trend of the property market in New Zealand. This is done using methodology from the New Zealand Institute of Economic Research.
-
Truncated mean is the method realestate.co.nz uses to provide statistically relevant asking prices. The top and bottom 10 per cent of listings in each area are removed before the average is calculated, to prevent exceptional listings from providing false impressions.
Share
-
.svg)
.svg)
.svg)