
.svg)


Central Otago/Lakes region flies high as winter approaches. We've seen all-time high average asking prices in Otago, Southland, Wellington and Waikato regions, while Auckland falls behind.
Download the full New Zealand Property Report as a PDF.
The New Zealand property market in May could well be called a “tale of two islands,” with a relatively buoyant South Island while the North Island appears largely to be in a holding position, says realestate.co.nz spokesperson Vanessa Taylor.
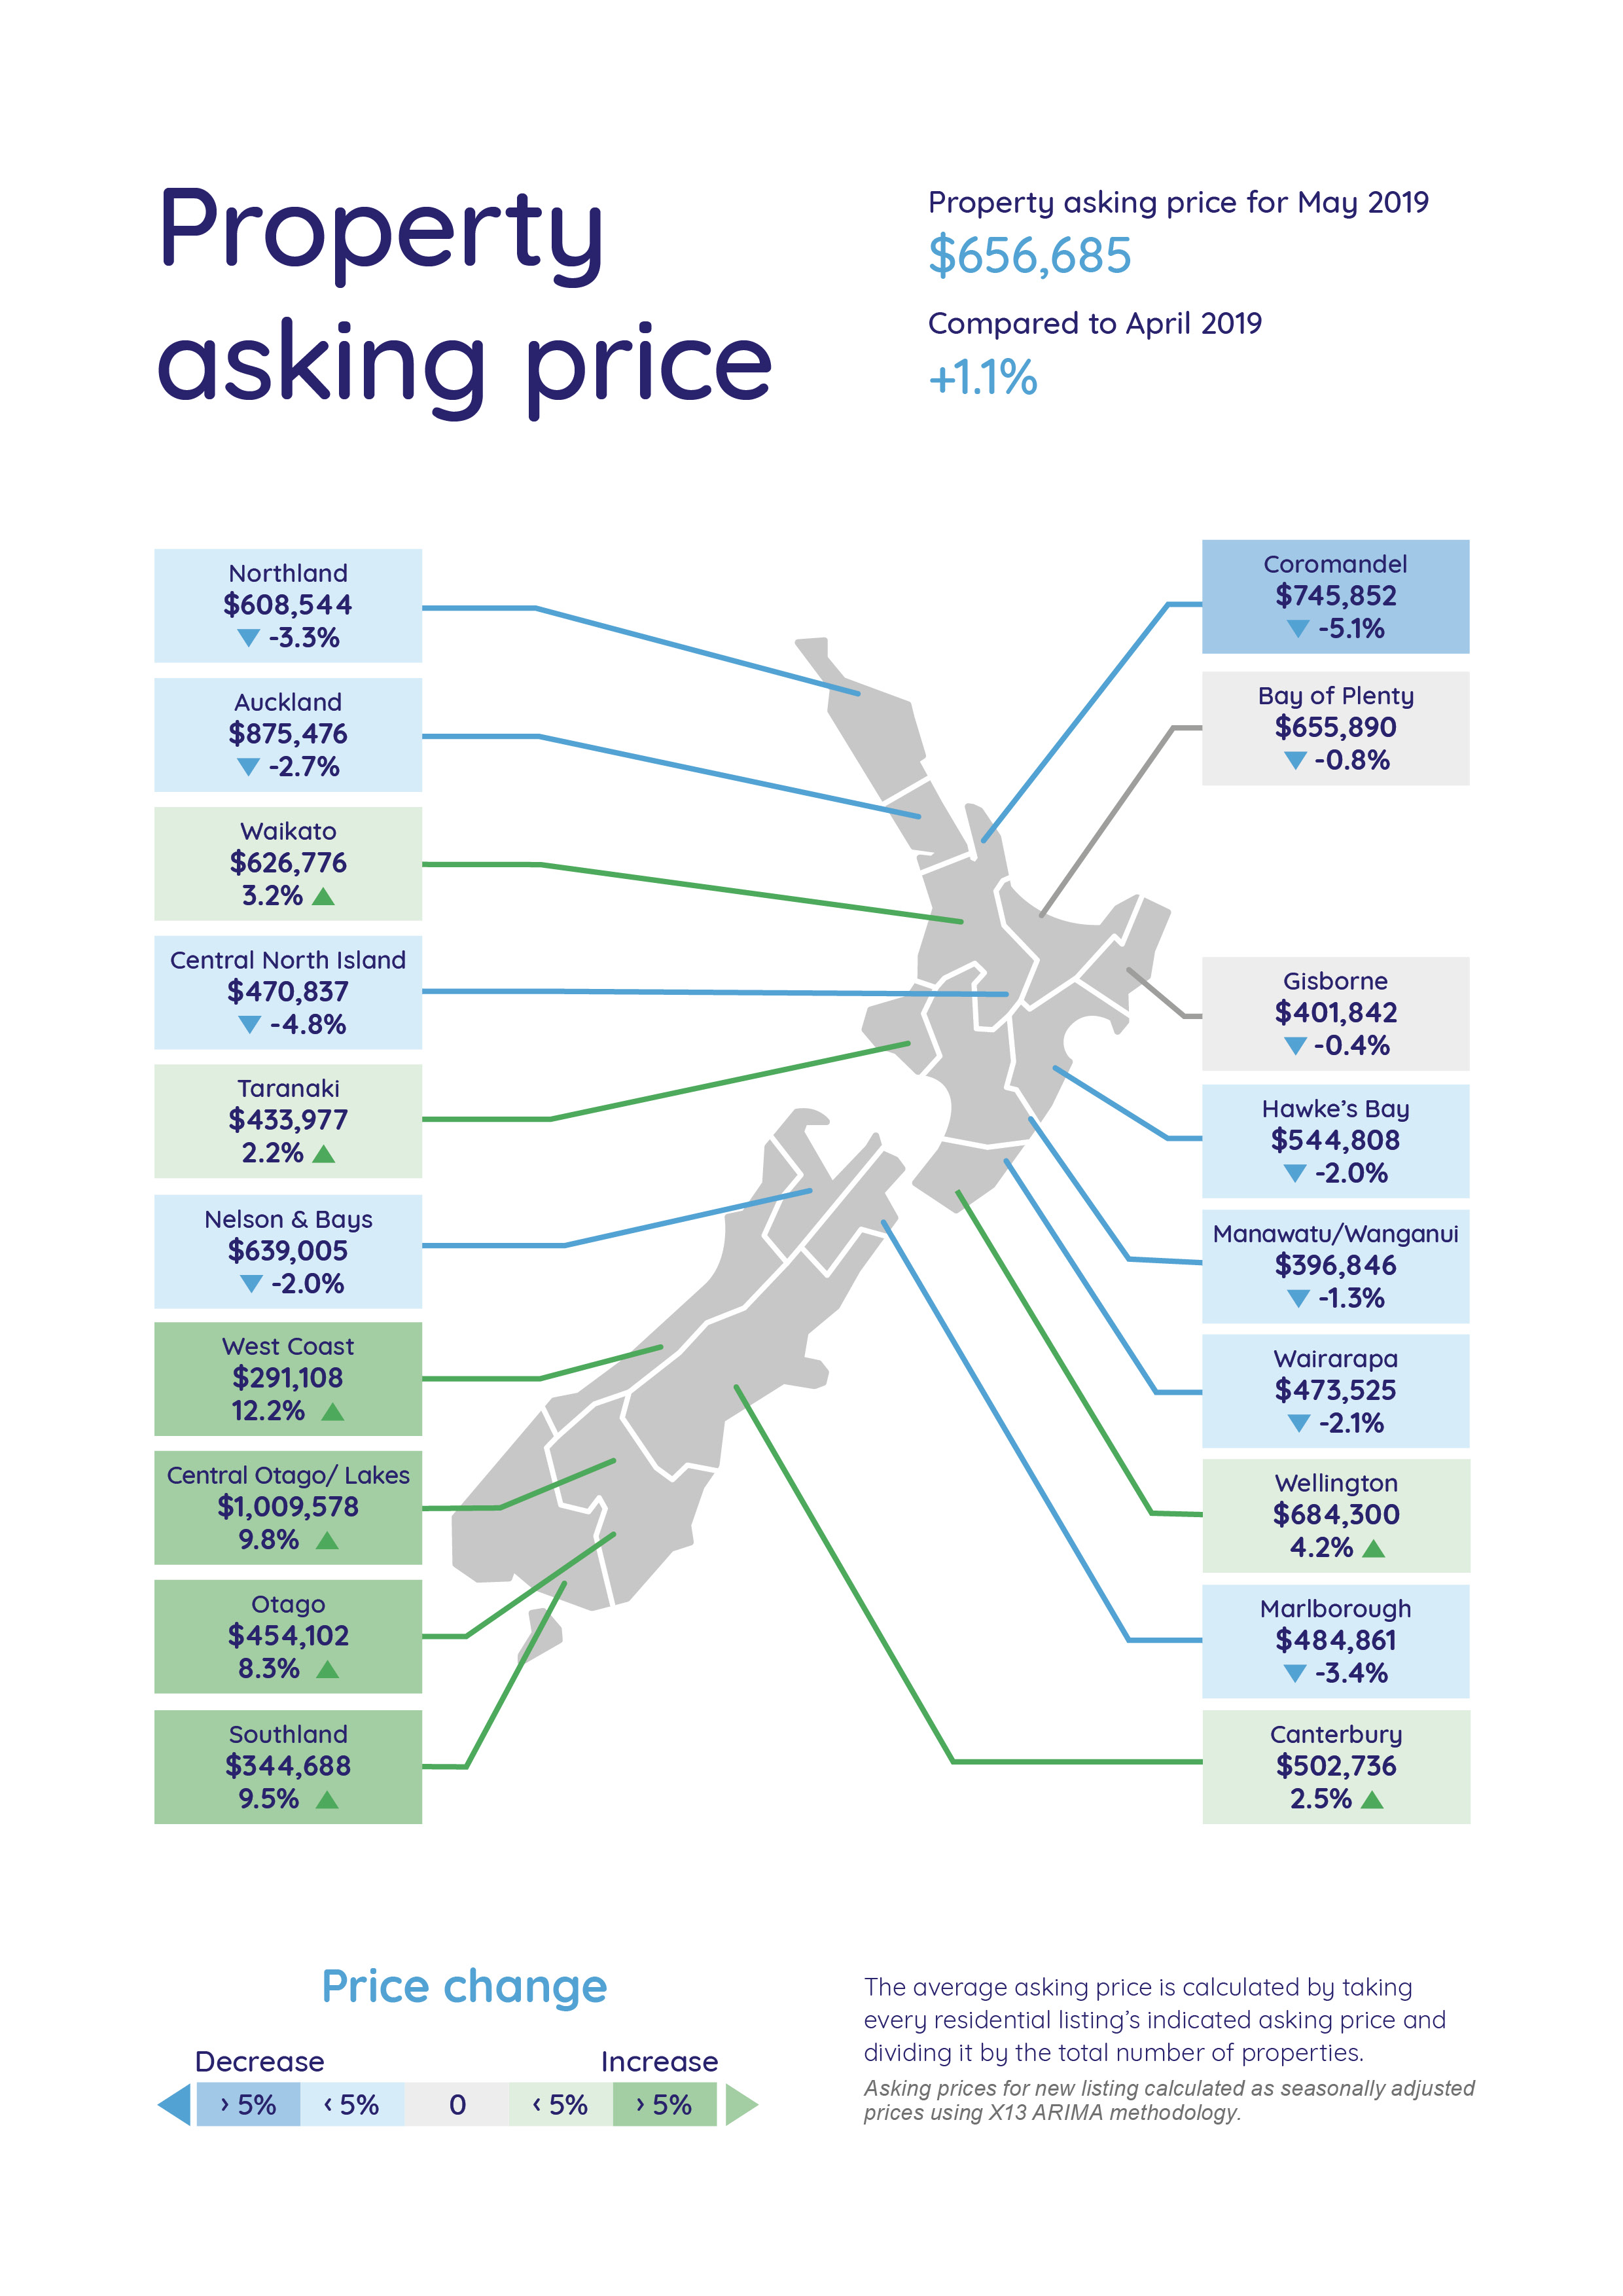
Real-time statistics show that nationally, the average asking price in May lifted 1.1% to $656,685 when compared to the previous month, however more than half of the North Island regions registered asking price falls (seven of twelve). The exceptions were the Waikato and Wellington regions with all-time highs, the Bay of Plenty and Gisborne remaining static, while Taranaki saw an increase of 2.2%.
“This is in stark contrast to the South Island, with five of the seven South Island regions registering lifts in average asking prices. An active Central Otago/Lakes region tipped back over the one-million-dollar price tag and two other regions hit new record asking price highs,” says Vanessa Taylor.
Central Otago/Lakes region flies high as winter approaches
With temperatures dropping, the Central Otago/Lakes region is gearing up for winter visitors and homeowners appear to be looking to capitalise, says Vanessa.
“New listings are up, the average asking price is up and the total number of houses available for sale is up,” she says.
In May the average asking price for a home in the Central Otago/Lakes region tipped back over the one-million-dollar mark, rising 9.8% to $1,009,578 compared to April 2019.
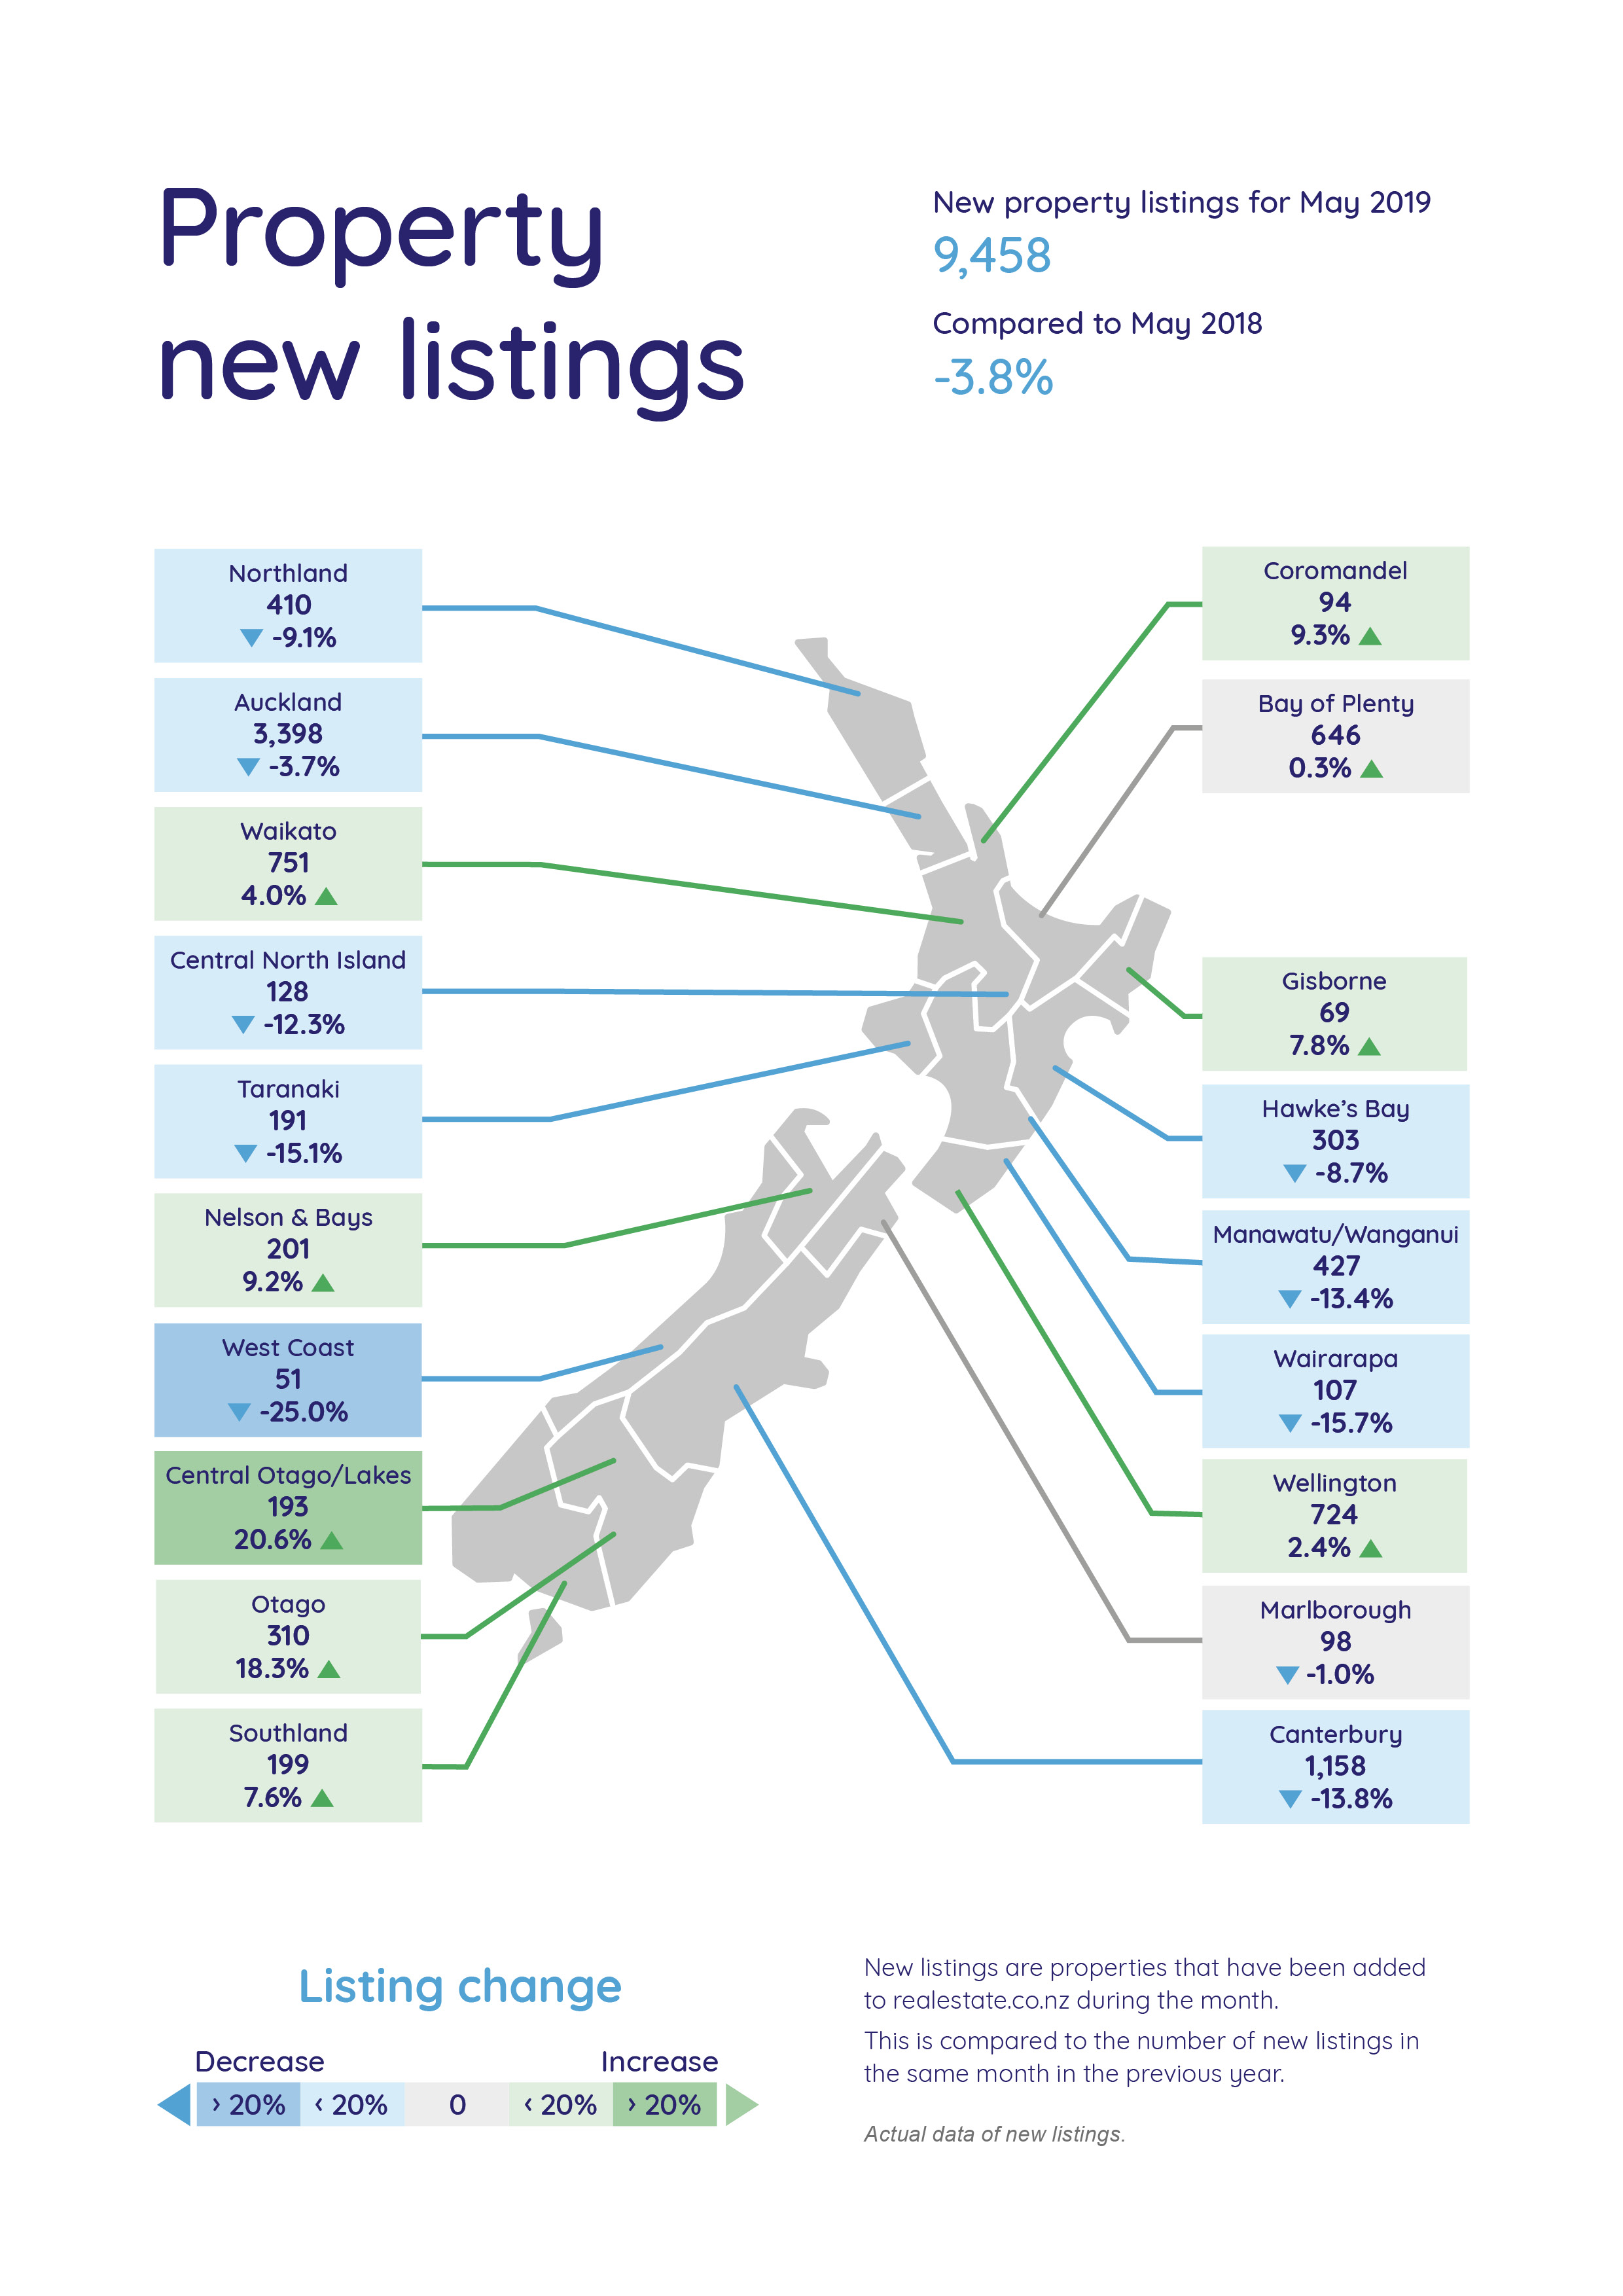
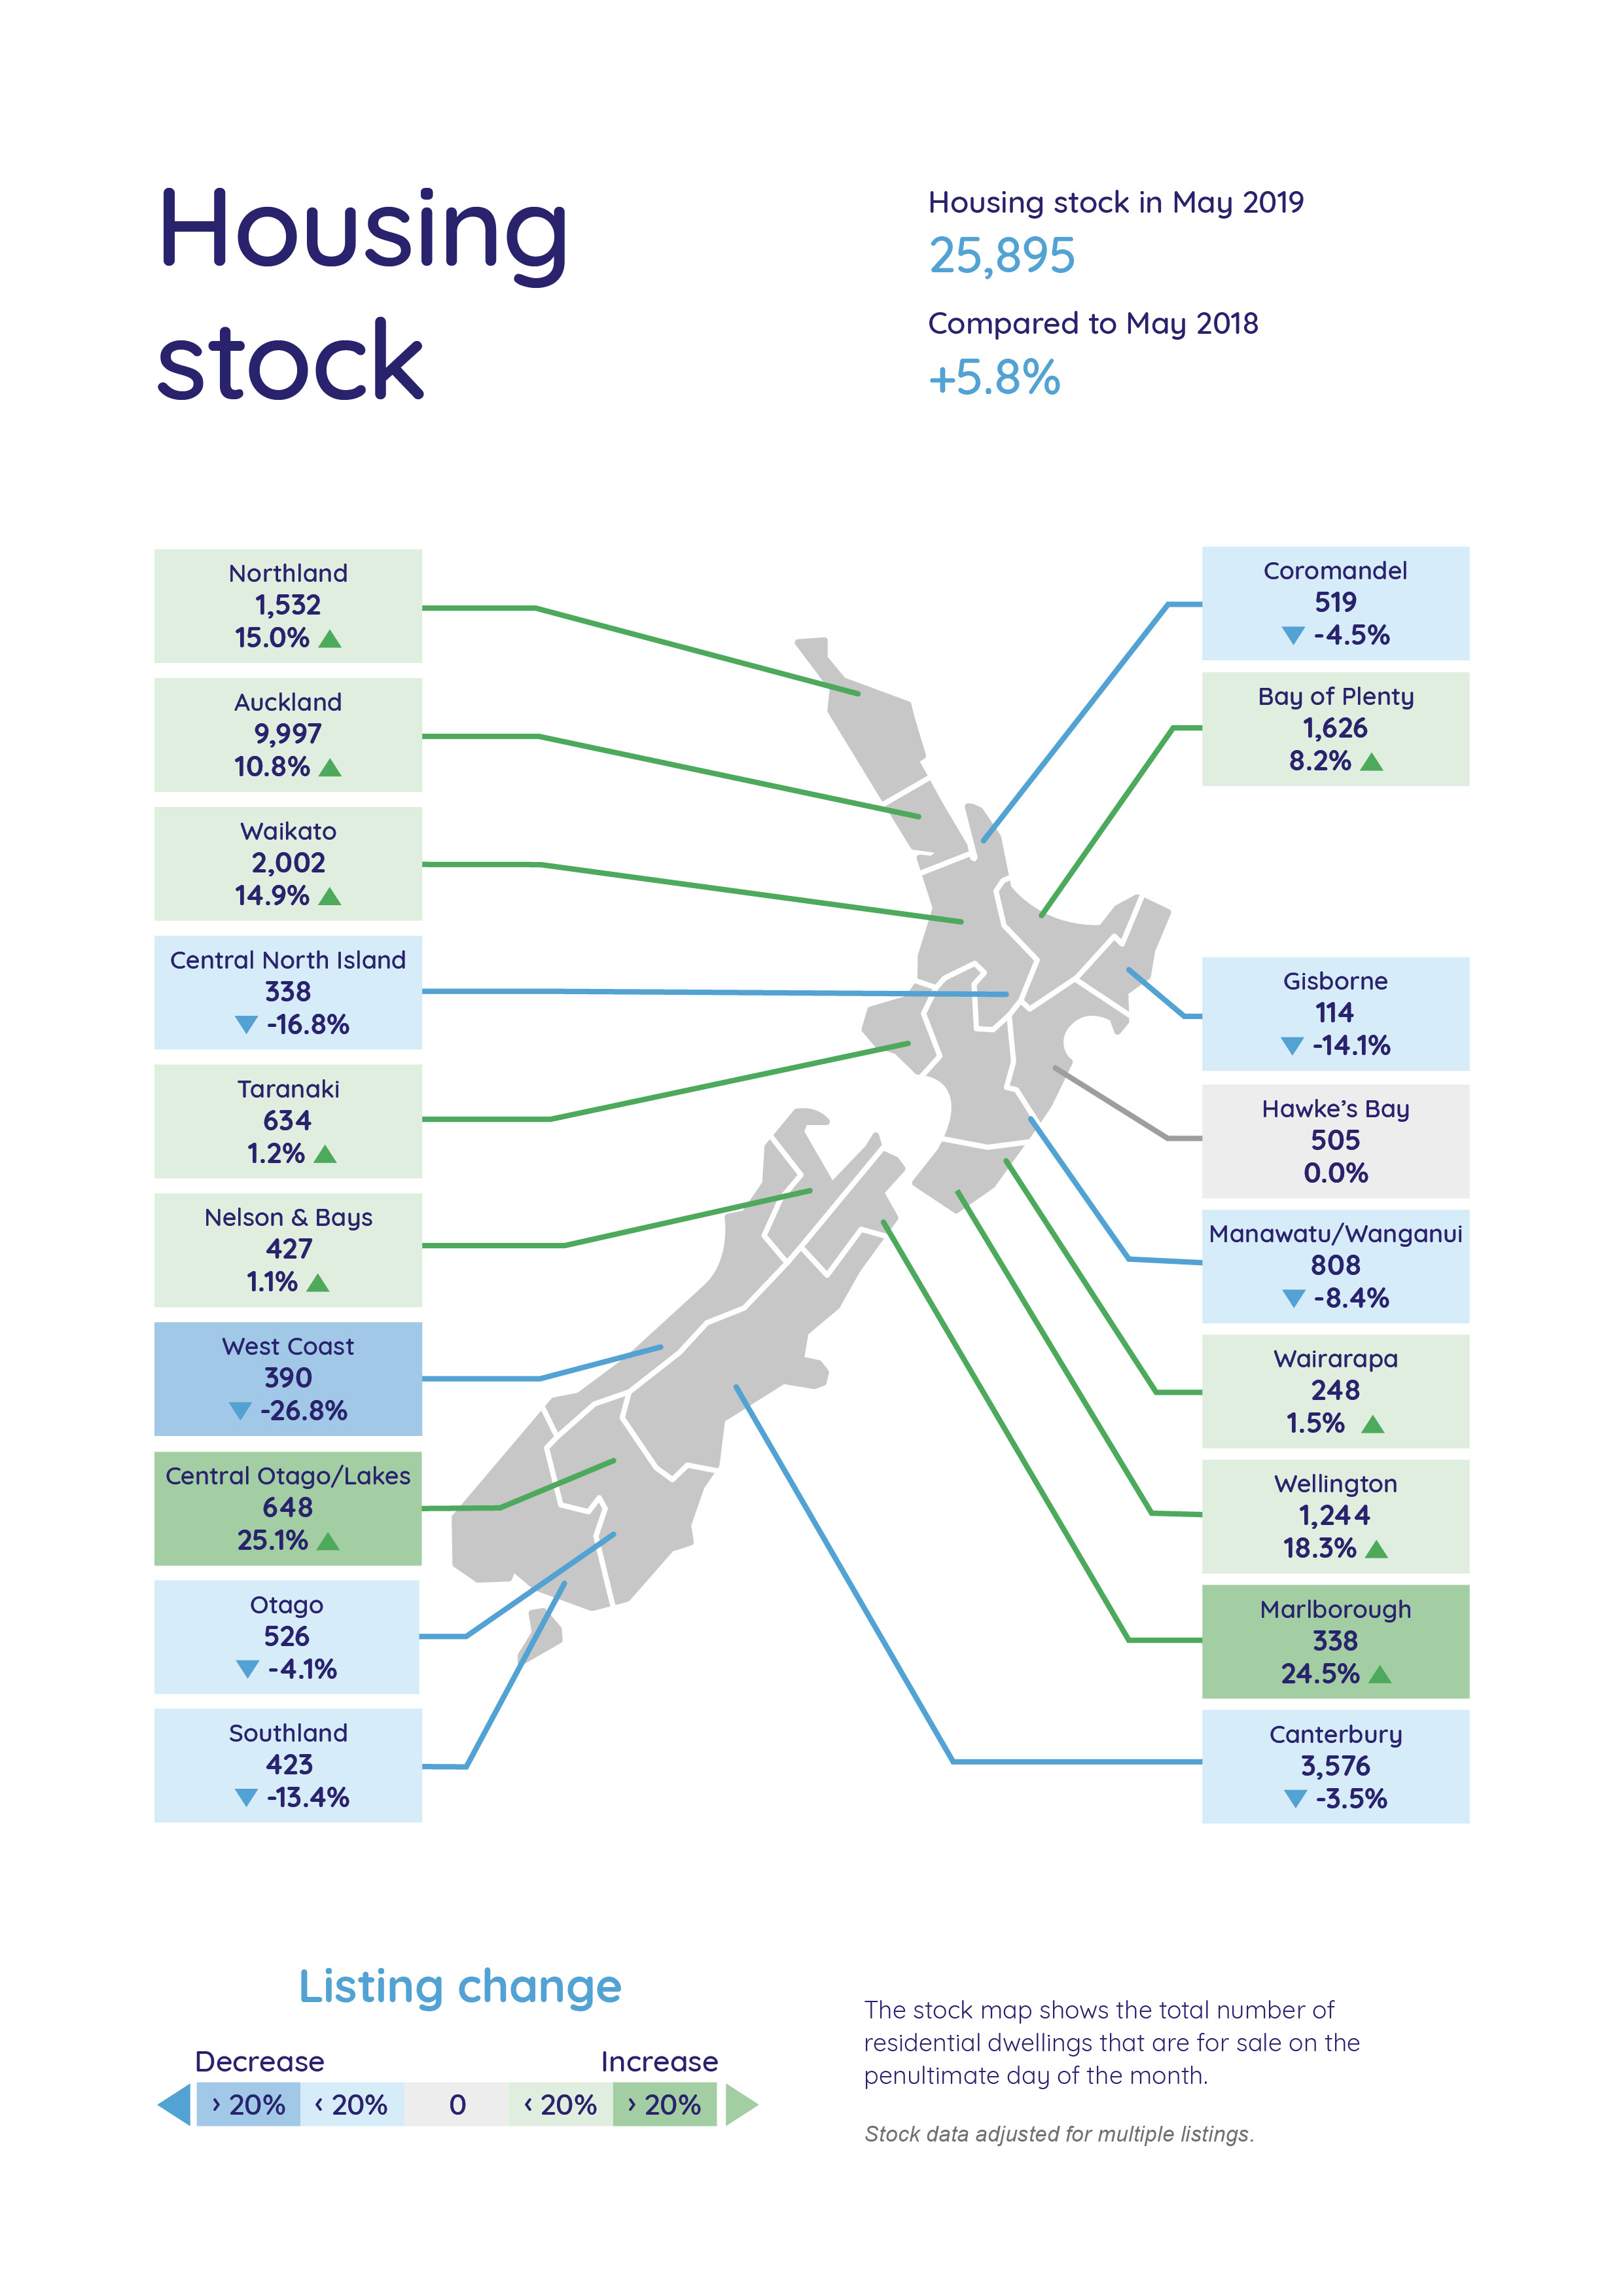
New property listings were up 20.6% compared to the same month last year (193 new listings) and the total number of homes for sale was also up (+25.1%, 648 listings).
“It’s arguably the liveliest region across the country and it’s not only New Zealanders taking a look,” says Vanessa.
In May nearly a quarter (24.1%) of all views to Central Otago/Lakes property on realestate.co.nz originated from Australia.
Vanessa Taylor puts this down to several factors.
“This winter wonderland is accessible, with airlines flying directly into Queenstown daily from Australia,”* says Vanessa.
“The international flight times from Australia are generally around the same, or shorter, than driving to Australia’s top ski fields from the relevant state capital cities. The snow conditions and overall experience of the Central Otago/Lakes region are highly regarded amongst snow goers all over the globe.
“While the restrictions on foreign ownership have had the overall effect of dampening demand in New Zealand, Australians are exempt from these restrictions.
“Unlike Australia, there are no capital gains taxes here and the New Zealand government has ruled out the possibility for the foreseeable future.
“For those looking to sell in the region, it makes sense to list properties ahead of the peak winter season so that property hunters have time to consider options, whether they’re Kiwis, Australians, or from other parts of the world,” says Vanessa.
In 2018, international airline traffic to and from Queenstown Airport peaked in July, with 77,328 passenger movements.**
The range of homes available in the Central Otago/Lakes district varies considerably, from multi-million-dollar homes to a KiwiBuild house in popular Wanaka, now on the open market with an asking price of $575,000.
All-time asking price highs in Otago, Southland, Wellington and Waikato regions, since records began in 2007
While the Central Otago/Lakes region’s average asking price lifted, it was the neighbouring regions of Otago and Southland which hit all-time asking price highs since our records began 12 years ago.
The average asking price in the Otago region rose 8.3% to $454,102, while Southland’s average asking price climbed 9.5% to $344,688.
“It was the lower South Island’s time to shine,” says Vanessa.
The Wellington region’s average asking price has been hovering in the mid-$600,000s during the first four months of this year, but in May leapt to an all-time high of $684,300 (a 4.2% increase on the previous month).
“It’s an interesting picture and somewhat defies supply and demand logic,” says Vanessa.
“Typically, if there’s a scarcity of listings, asking prices tend to lift.”
However in May, the total number of homes for sale in the capital city (1,244) was well up on the same period last year (+18.4%), although there was only a modest increase in new listings (724) representing a 2.4% increase on May 2018.
“The Wellington region has had a shortage of listings in recent times and we will be watching with interest to see how this situation unfolds during 2019,” she says.
Further north it was a similar picture for the Waikato region.
The region hit an all-time high in asking prices (up 3.2% to $626,776) compared to the previous month. New listings were up 4.0% to 751 new listings, as was the total number of homes for sale, up 14.9% to 2,002 when compared to May 2018.
“While the property profiles of the Wellington and Waikato regions were quite similar in May, Wellington is a much smaller market geographically and is tightly held compared with the Waikato,” says Vanessa.
Auckland region languishes
The Auckland region’s average asking price fell 2.7% from the prior month to $875,476 while new property listings fell 3.7% compared to May 2018 (3,398 new listings).
Total stock rose 10.8% when compared to May 2018, giving buyers 9,997 homes to browse.
“With stock sitting around longer, people will be looking to whether they need to be more negotiable on price, particularly as they will be selling and buying in the same market,” she says.
*Air New Zealand, Jetstar, Qantas and Virgin Australia have direct flights between Australia and Queenstown. The destinations (not necessarily all covered by all the listed airlines) are Melbourne, Sydney, Brisbane and Gold Coast
**Airports report passengers and aircraft as ‘movements.’ Passenger movements count both arrivals and departures i.e. 1 passenger is counted as 2 movements – their arrival and their departure.
For media enquiries, please contact:
Liz Holt T: 021 042 6590 E: liz.holt@ppr.co.nz
Glossary of terms:
As the only provider of real estate data in real time, realestate.co.nz offers valuable property market information not available from other sources.
- Average asking price is not a valuation. It is an indication of current market sentiment. Statistically, asking prices tend to correlate closely with the sales prices recorded in future months when those properties are sold. As it looks at different data, average asking prices may differ from recorded sales data released at the same time.
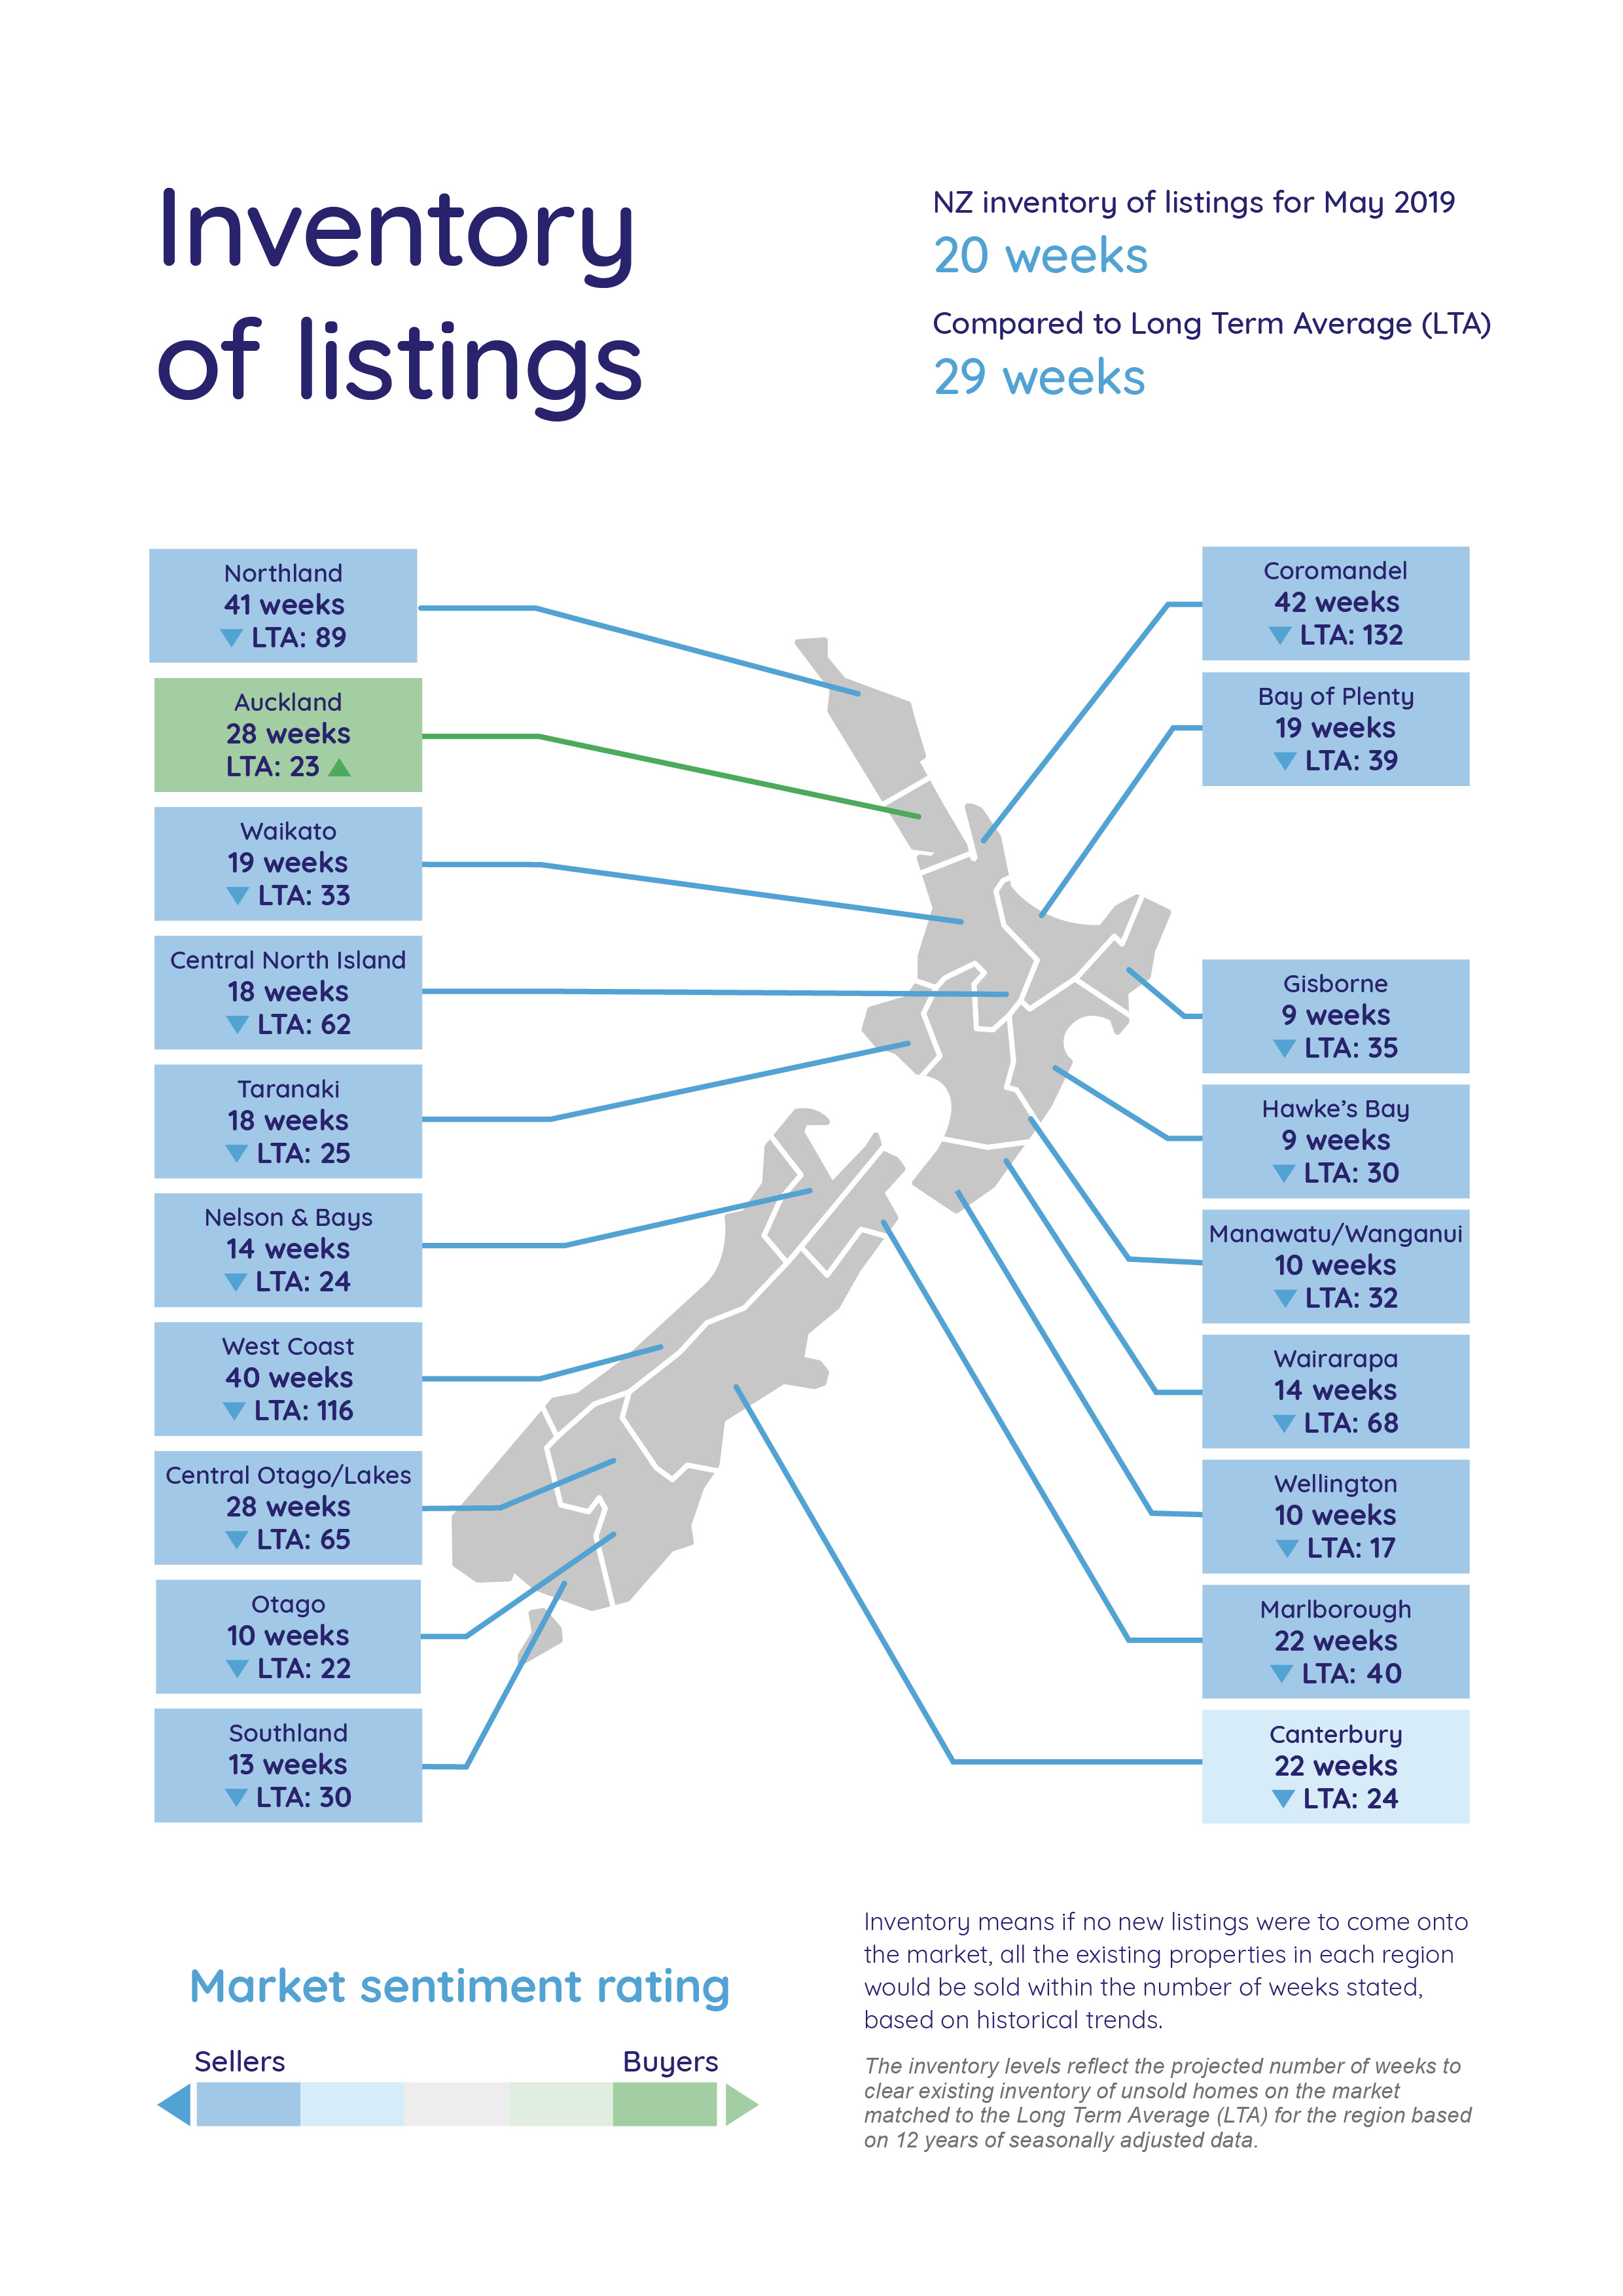
- Inventory is a measure of how long it would take, theoretically, to sell the current stock at current average rates of sale if no new properties were to be listed for sale. It provides a measure of the rate of turnover in the market.
- New listings are a record of all the new listings on realestate.co.nz for the relevant calendar month. As realestate.co.nz reflects 97% of all properties listed through registered estate agents in New Zealand, this gives a representative view of the New Zealand property market.
- Demand: the increase or decrease in the number of views per listing in that region, taken over a rolling three-month time frame, compared to the same three-month time frame the previous year – including the current month.
- Seasonal adjustment is a method realestate.co.nz uses to better represent the core underlying trend of the property market in New Zealand. This is done using methodology from the New Zealand Institute of Economic Research.
- Truncated mean is the method realestate.co.nz uses to provide statistically relevant asking prices. The top and bottom 10% of listings in each area are removed before the average is calculated, to prevent exceptional listings from providing false impressions.
Share
-
.svg)
.svg)
.svg)