
.svg)


Download the full New Zealand Property Report as a PDF.
Auckland is on the cusp of a buyers’ market which has potential upside for both buyers and sellers.
A modest fall in Auckland's asking prices is offset by increases in other regions, while Wellington and four smaller regions hit asking price highs since records began in 2007.
Real-time statistics from realestate.co.nz show that the Auckland region is indicating a shift into a buyers’ market. Data from March 2019 shows a small fall in the average asking price, more choice of properties and homes taking longer to sell.
“While these are the classic indicators of a buyers’ market, it has potential upside for both buyers and sellers,” says realestate.co.nz spokesperson Vanessa Taylor.
“That’s because sellers are also typically buyers looking for their next home. In the same market, buyers will be able to capitalise on lower asking prices for their next move, as the majority are likely to be trading up,” she says.
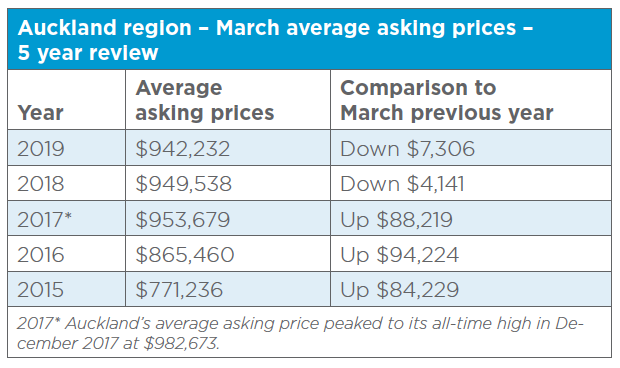
The Auckland region’s average asking price fell 1.9% in March to $942,232, when compared to the previous month.
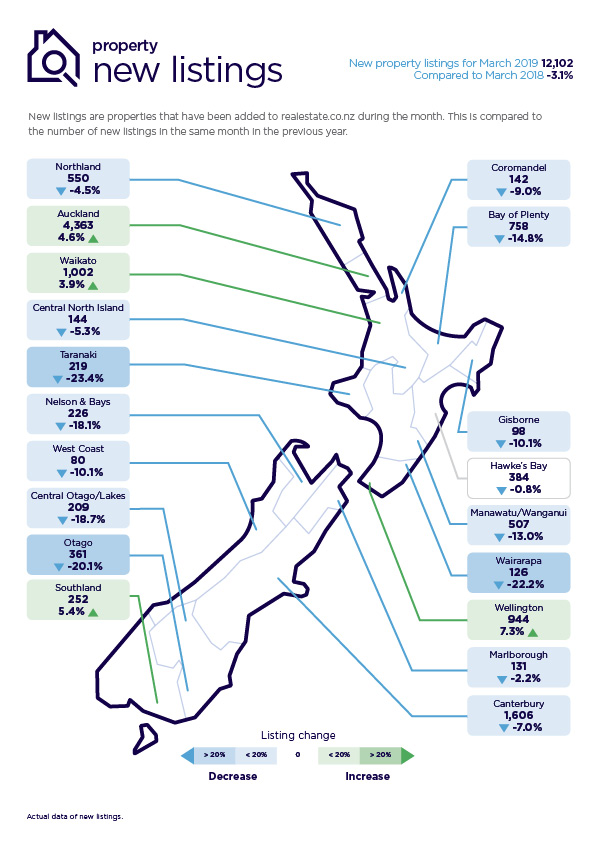
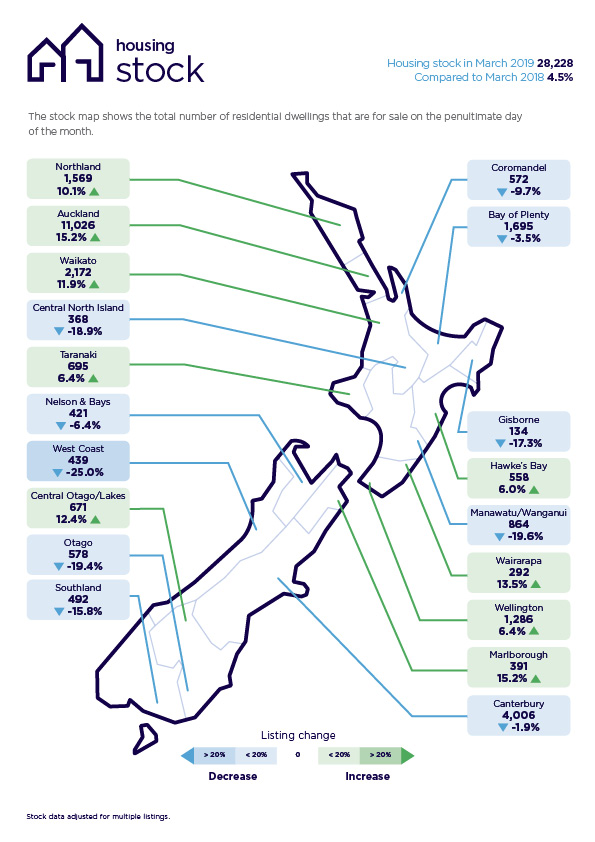
New listings in Auckland (4,363) were up 4.6% compared to March 2018, adding to the stock already listed for sale on realestate.co.nz. The total number of homes for sale (11,026) in this region in March was up 15.2% on the same time last year.
The Auckland region accounted for nearly a third of all new listings across the country. Nationally, the number of new listings fell by 3.1% (to 12,102 homes) compared with March 2018.
“Houses in Auckland are also taking longer to sell,” says Vanessa.
“We’ve very much moved on from the pressure cooker market which peaked in 2017.”
“It was a time when buyers and sellers had to make snap decisions under enormous pressure, with the nightmare possibility of a stumble on the next rung of the property ladder, such as selling a home but not able to purchase the next one because of the rise in prices in the interim.
“In the current market, buyers and sellers can take a more considered approach to purchasing their next home,” she says.
“A lift in new property listings, an increase in total stock and relatively stable prices takes the pressure off.
“We’ve seen that Kiwi’s passion for property is not slowing down, with 1,135,945 unique browsers searching on realestate.co.nz during the month of March. This is up 25.2% on March 2018.
“When looking at the past five years, the relatively stable price environment we have right now is a stark contrast to the heady increases between 2015 and 2017.
“Less stress and more realistic expectations,” says Vanessa.
“Falls in average asking prices could also possibly assist some first home buyers as these falls are across all price bands.
“If people move up from their first to their second home, it will free-up stock at the entry level,” says Vanessa.
National increase in average asking prices counterbalance’s Auckland’s fall. Five regions hit all-time highs, since records began in 2007.
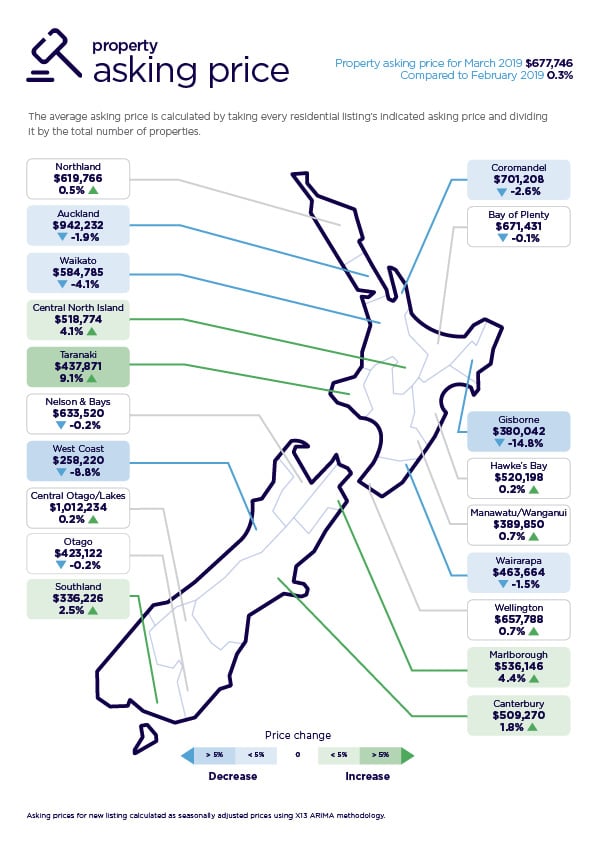
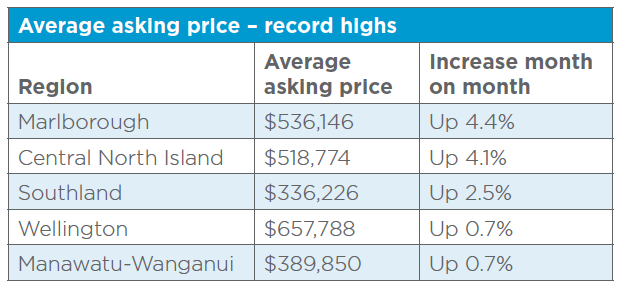
The March fall in Auckland’s average asking price has been counter-balanced by increases in other regions throughout New Zealand. These include record highs in the Wellington, Manawatu-Wanganui, Marlborough, Central North Island and Southland regions.
The national average asking price for March stood at $677,746, representing a 0.3% increase compared to the prior month.
“While this is a relatively small increase, it shows that although the biggest region of Auckland has seen a backwards move in asking prices, there’s been enough happening across the rest of the country to counter-balance the overall impact,” says Vanessa.
While not a record, the stand-out region in terms of a lift in average asking prices compared to the previous month was Taranaki, where asking prices rose 9.1% to $437,871.
Wellington region comes alive
“A healthy injection of new listings which has significantly built the region’s total stock levels, coupled with a stable price environment, is very encouraging for home hunters who have been long-starved for choice,” says Vanessa.
The 944 fresh new listings brings the total number of homes for sale in the region to 1,286, with an average asking price of $657,788.
“It’s been traditionally a tightly held market, so breaking the mould in March was very positive for the capital,” she says.
REINZ: Number of days to sell a property has been slowly increasing in some parts of the country
Bindi Norwell, Chief Executive of the Real Estate Institute of New Zealand says: “We’ve seen this trend for a few months now where the number of days to sell a property has been slowly increasing in some areas across New Zealand. This means some people are taking their time and undertaking their due diligence before purchasing a property.
“It’s also a good time for vendors to review their pricing strategy so they can successfully sell within this type of market,” she says.
For media enquiries, please contact:
Alex Dudley, PPR T: 027 5399 555 E: alex.dudley@ppr.co.nz
Glossary of terms:
As the only provider of real estate data in real time, realestate.co.nz offers valuable property market information not available from other sources.
- Average asking price is not a valuation. It is an indication of current market sentiment. Statistically, asking prices tend to correlate closely with the sales prices recorded in future months when those properties are sold. As it looks at different data, average asking prices may differ from recorded sales data released at the same time.
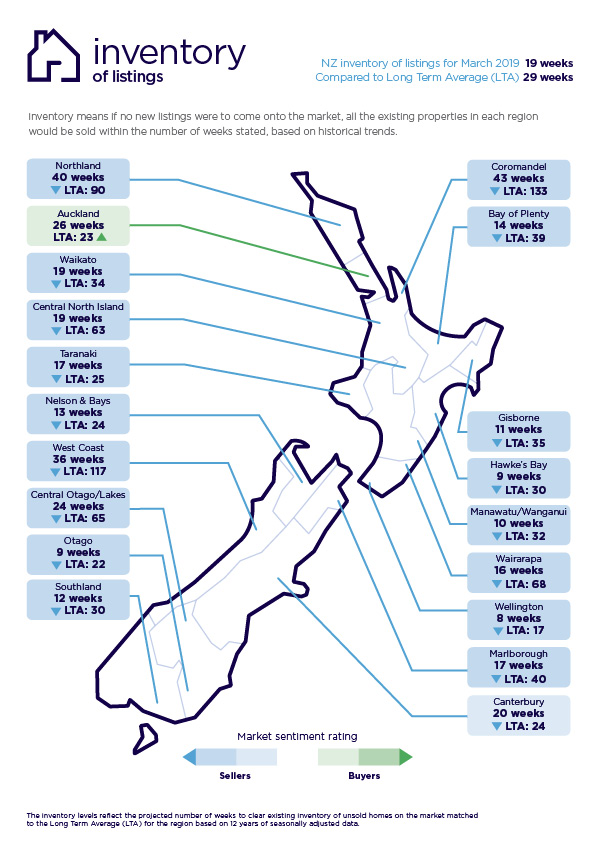
- Inventory is a measure of how long it would take, theoretically, to sell the current stock at current average rates of sale if no new properties were to be listed for sale. It provides a measure of the rate of turnover in the market.
- New listings are a record of all the new listings on realestate.co.nz for the relevant calendar month. As realestate.co.nz reflects 97% of all properties listed through registered estate agents in New Zealand, this gives a representative view of the New Zealand property market.
- Demand: the increase or decrease in the number of views per listing in that region, taken over a rolling three-month time frame, compared to the same three-month time frame the previous year – including the current month.
- Seasonal adjustment is a method realestate.co.nz uses to better represent the core underlying trend of the property market in New Zealand. This is done using methodology from the New Zealand Institute of Economic Research.
- Truncated mean is the method realestate.co.nz uses to provide statistically relevant asking prices.
The top and bottom 10% of listings in each area are removed before the average is calculated, to prevent exceptional listings from providing false impressions.
Share
-
.svg)
.svg)
.svg)