The latest data from realestate.co.nz suggests that November has marked a turning point for what many have called New Zealand’s “runaway” housing market. The property site’s CEO, Sarah Wood, says that the November dataset is an early indicator of more housing availability to come.
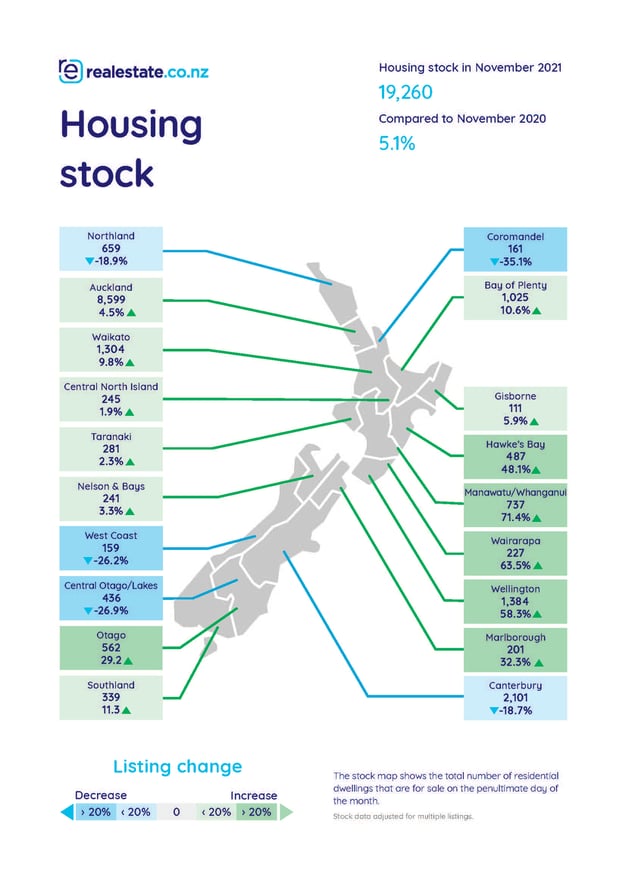
“The New Zealand property market is taking an encouraging turn. The last time we saw our new listings this high was seven years ago in October 2014, " said Sarah. “And total housing stock (all the homes available on realestate.co.nz), has also gone up by 5.1% year on year.”
“It looks like buyers will have more homes to choose from this spring and summer.”
But new listings and total stock figures aren’t the only numbers perking up ears at realestate.co.nz.
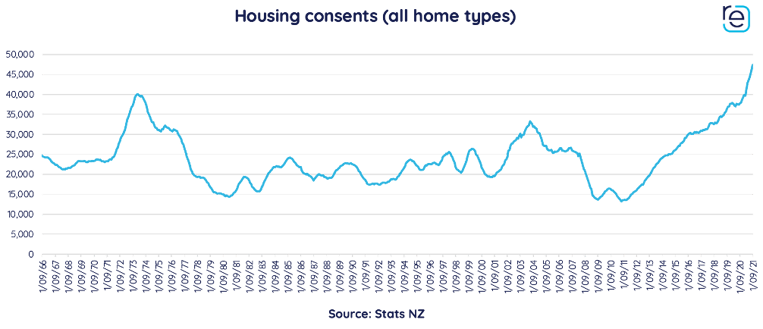
“Housing consents are at record numbers. Data from Stats NZ shows that the country has consents to build homes faster than we were in the 1970s, which indicates an increase in supply for property seekers in the future.”
Wellington joins the Million Dollar Club—seven other regions hit 14-year record high average asking prices
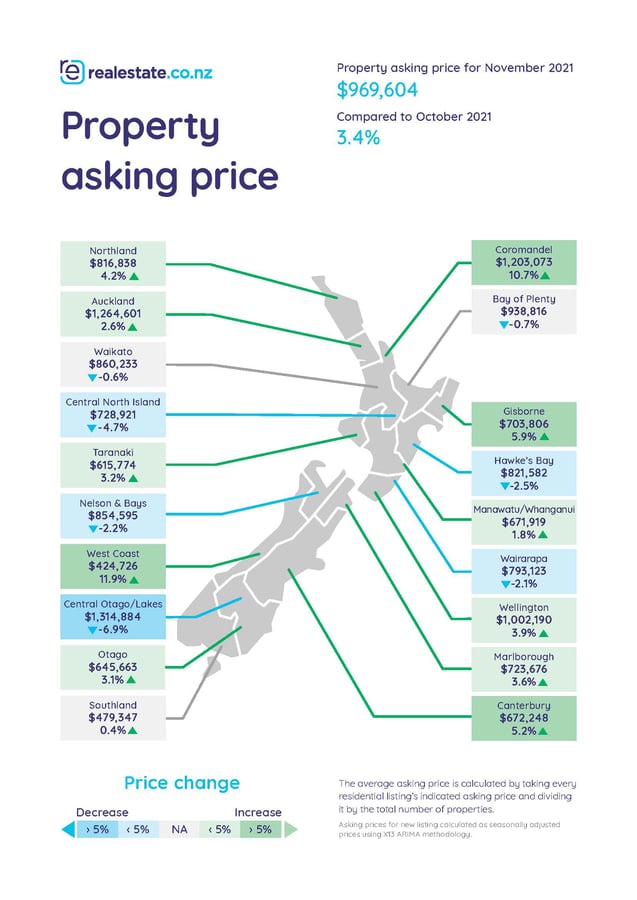
Wellington joined the Million Dollar Club in November—its average asking price hit $1,002,190, up 27.3% when compared to the same time last year, and a 14-year record high. The region has been a compelling story for several months, setting trends that seem to be filtering into nearby regions.
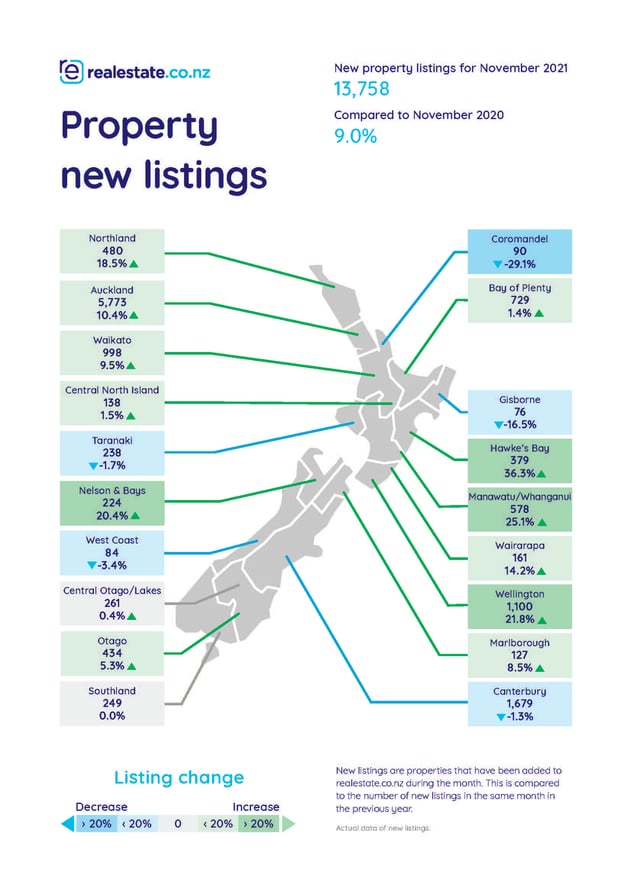
“Wellington’s market looks piping hot—new listings were up 21.8% and total stock was up a whopping 58.3% on November 2020,” said Sarah.
“When we see higher numbers of total stock and new listings, it tells us that buyers are being more considered, and homes are being listed at a faster rate than they are sold.”
“In Wellington, this looks to be the case—and this is the third month in a row that the region is leading the charge. The capital continues to keep us on our toes.”
The national average asking price is now $969,604—also a 14-year record—led by eight regions, Wellington included. The Coromandel (up 32.5% to $1,203,073), Gisborne (up 30.3% to $703,806), Auckland (up 23.3% to $1,264,601), Manawatu / Wanganui (up 26.0% to $671,919), Canterbury (up 24.4% to $672,248), Taranaki (up 22.3% to $615,774) and Otago (up 21.1% to $645,663), all broke average asking price records year-on-year.
Although its average asking price cooled slightly in November month-on-month, Central Otago / Lakes District is still the most expensive region to purchase a property. A home in the region is now priced, on average, at $1,314,884—up 21.9% year-on-year.
“It’ll be interesting to see if we see more stock coming to the market, and how that might affect the asking prices this summer,” said Sarah.
For the first time in years, total housing stock is heading in the right direction
Only five regions saw their total stock go backward in November year-on-year. Central Otago/Lakes District (down
-27.0%), the Coromandel (down -35.1%), Canterbury (down -18.7%), Northland (down -18.9%) and the West Coast (down -26.2%).
But other regions, like Manawatu / Wanganui (up 70.4%) Wairarapa (up 63.5%), Wellington (up 58.3%), Hawke’s Bay (up 48.1%), Marlborough (up 32.3%) and Otago (up 29.2%) all saw notable increases in stock. This is a positive sign, suggests Sarah.
“It’s been a few years since we’ve seen total stock increases like this. These numbers are heartening, and another early indicator that the winds of change are coming to the market.”
“Amongst other things, New Zealand needs to build more homes if we want to get on top of challenges like housing affordability. The government has recently released their housing bill, which estimates that between 48,000 and 105,000 dwellings could be built in the next five to eight years. If this concept comes to life, we’re on the right track.”
For media enquiries, please contact:
Ashley Harder | 021 712 210 | ashley@realestate.co.nz
As the longest-standing provider of real estate data in real-time, realestate.co.nz offers valuable property market information not available from other sources to make it easier for New Zealanders to buy and sell property.
Glossary of terms:
Average asking price (AAP) is neither a valuation nor the sale price. It is an indication of current market sentiment. Statistically, asking prices tend to correlate closely with the sales prices recorded in future months when those properties are sold. As it looks at different data, average asking prices may differ from recorded sales data released at the same time.
New listings are a record of all the new residential dwellings listed for sale on realestate.co.nz for the relevant calendar month. As the site reflects 97% of all properties listed through licensed real estate agents in New Zealand, this gives a representative view of the New Zealand property market.
Seasonal adjustment is a method realestate.co.nz uses to better represent the core underlying trend of the property market in New Zealand. This is done using methodology from the New Zealand Institute of Economic Research.
Truncated mean is the method realestate.co.nz uses to supply statistically relevant asking prices. The top and bottom 10% of listings in each area are removed before the average is calculated, to prevent exceptional listings from providing false impressions.
Stock is the total number of residential dwellings that are for sale on realestate.co.nz on the penultimate day of the month.
01 Dec 2021

