
.svg)


A year on: how has the property market fared since covid-19 first landed on our shores?
Resilient housing market shows 12.7% year-on-year price growth
As we recently marked a year since the first Covid-19 case was reported in New Zealand, latest figures from realestate.co.nz suggest that despite the many challenges of the pandemic, Kiwis’ appetite for property hasn’t diminished.
“The housing market has performed in a way that few people would have expected 12 months ago,” says Vanessa Taylor, spokesperson for realestate.co.nz.
“As we prepared for our first lockdown, economists were predicting a 5 – 10% drop in house prices, but what we’ve actually seen is quite the opposite.”
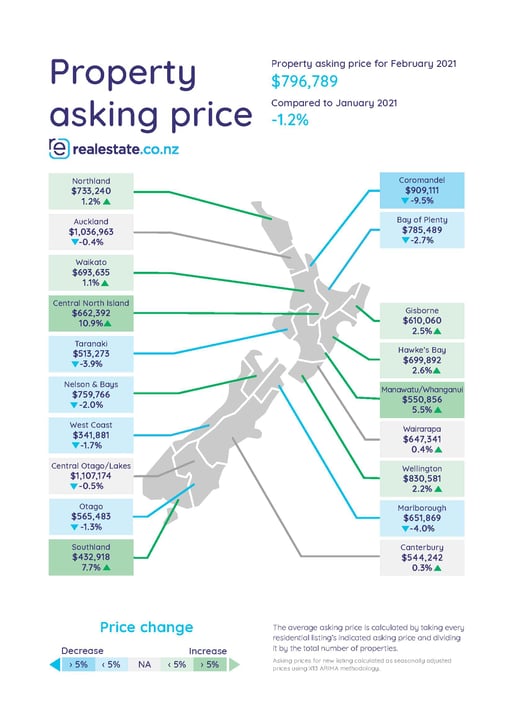
Real-time data from realestate.co.nz shows that average asking prices were up 12.7% year-on-year in February.
“Despite the social and economic impacts of Covid-19, the property market has stayed remarkably resilient. We’ve seen steady price increases in every region over the last 12 months,” says Vanessa.
Nationally, the average asking price for Kiwi properties last month was $796,789 – costing on average $89,575 more than the same time last year.
Vanessa says a number of factors have been at play over the last 12 months including low mortgage rates, a lack of international travel, removal of LVR restrictions and the number of Kiwis returning home from overseas.
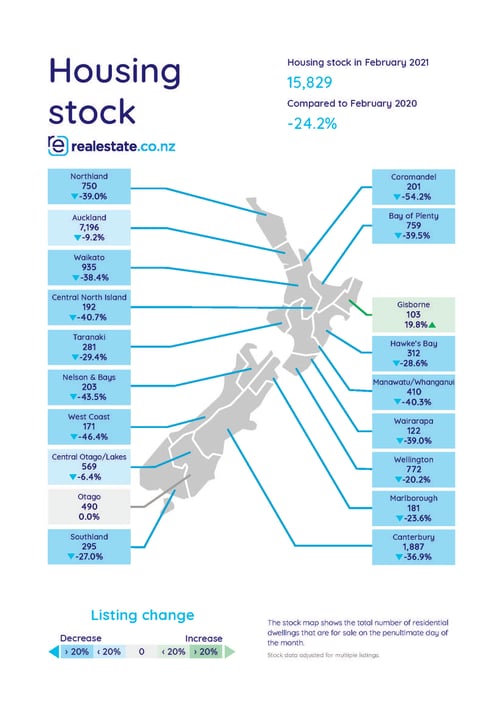
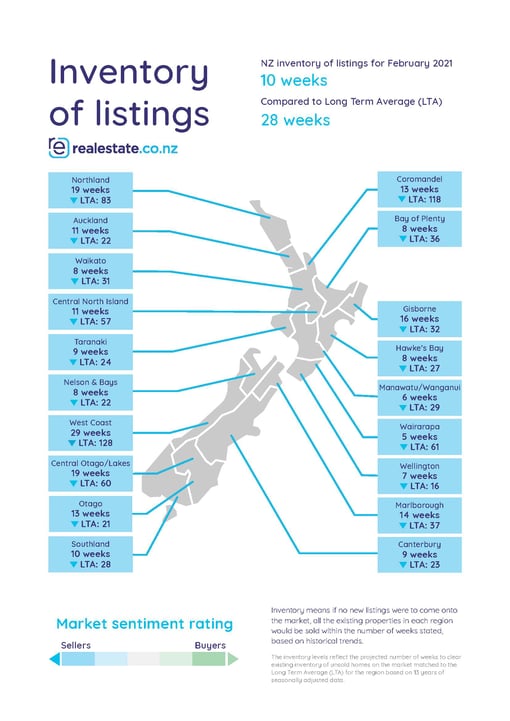
Low stock levels continue to add to price pressures, with national inventory down 24.2% year-on-year in February.
“Buyers who have been missing out on homes are all too aware of the lack of supply, and we’ll all be watching to see if the next few months bring any relief for those looking to purchase,” says Vanessa.
“For the time being, demand appears to remain strong with close to 1.3 million users recorded on realestate.co.nz in February, an 11.5% increase on the same month last year.”
Price pressures mount, with 14-year record highs in seven regions
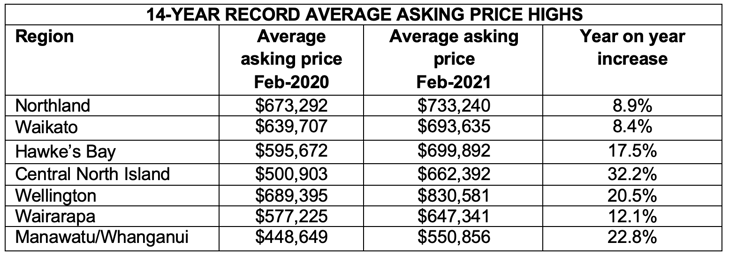
Seven North Island regions hit all-time average asking price highs in February, according to real-time data from realestate.co.nz.
Northland, Waikato, Hawke’s Bay, Central North Island, Wellington, Wairarapa and Manawatu/Whanganui all reached peak asking prices since records began 14 years ago.
“Asking prices were up year-on-year in every region across the country last month,” says Vanessa.
Northland and Hawke’s Bay achieved record highs for the second consecutive month, with the average asking price $733,240 and $699,892 respectively.
Although the Gisborne region didn’t record an all-time average asking price high in February, it showed the strongest year-on-year price growth at 39.4%. This was followed by Central North Island, where prices were up 32.2%.
Meanwhile, inventory remains low in almost every region with total stock down 24.2% nationally year-on-year.
“The housing market remains very tight, with low inventory continuing to be a challenge. Only Gisborne and Otago avoided recording year-on-year stock decreases in February,” says Vanessa.
Coromandel reached an all-time stock low, with just 201 homes available for purchase – down 54.2% on February 2020.
Stock also fell to a record low in West Coast, where inventory was 46.4% lower than the same time last year.
Prices soar, auctions rule in hot Gisborne market
Home buyers in the Gisborne region can expect to pay on average $170,000 more for a home than they did at the same time last year, according to latest realestate.co.nz figures.
The average asking price for homes in the region is now $610,060 – up 39.4% from $437,579 in February 2020.
That puts the Gisborne market ahead of every other region in the country for year-on-year asking price increases at the end of February.
“This continues the trend we’ve seen in the Gisborne market over the last 12 months,” says Vanessa.
“Gisborne showed the strongest price increase of any region in 2020, and the market has showed no signs of slowing in the first two months of this year.”
Buyers in the Gisborne market are also far more likely to purchase a property at auction than anywhere else in the country. Data from realestate.co.nz shows that of the 628 new listings in Gisborne last year, a staggering 59% came onto the market as auctions.
That’s significantly more than national auction figures: in 2020, 17% of new listings in New Zealand were listed as auctions.
It also puts Gisborne well ahead of any other region in sales by auction: next highest was Auckland, where 27% of new listings were listed as auctions, followed by Bay of Plenty with 22%.
“Clearly sellers and real estate agents in Gisborne love auctions, although I think what this also affirms is how strong demand is in the region,” says Vanessa.
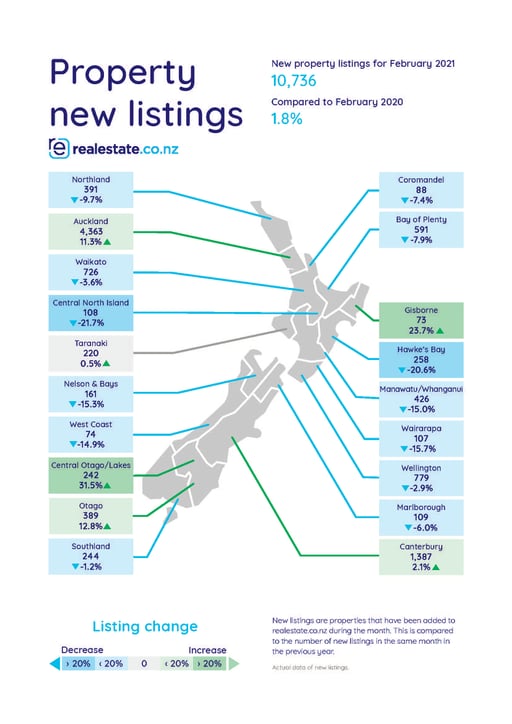
If there’s a silver lining for buyers, it’s that 73 new listings came onto the market last month – up 52.1% on January 2021 and 23.7% on the same month last year.
With 103 properties available for purchase in February, total stock in the region was up 19.8% year-on-year.
During the month more than 9,100 users searched for property in the Gisborne region on realestate.co.nz – with Tolaga Bay, Wainui and Hicks Bay the most sought-after locations.
ENDS
For media enquiries, please contact:
Trish Fitzsimons | 021 022 96927 | trish@realestate.co.nz
About realestate.co.nz
Established before Google, in 1996, realestate.co.nz is New Zealand’s longest-standing property site. With residential, lifestyle, rural and commercial property listings available, realestate.co.nz is the place where serious buyers look for property. Dedicated to property, realestate.co.nz has no private sales and has search functionality that’s second to none to get you to your perfect property faster.
Glossary of terms:
As the only provider of real estate data in real-time, realestate.co.nz offers valuable property market information not available from other sources.
- Average asking price is not a valuation. It is an indication of current market sentiment. Statistically, asking prices tend to correlate closely with the sales prices recorded in future months when those properties are sold. As it looks at different data, average asking prices may differ from recorded sales data released at the same time.
- Inventory is a measure of how long it would take, theoretically, to sell the current stock at current average rates of sale if no new properties were to be listed for sale. It provides a measure of the rate of turnover in the market.
- New listings are a record of all the new listings on realestate.co.nz for the relevant calendar month. As realestate.co.nz reflects 97% of all properties listed through registered estate agents in New Zealand, this gives a representative view of the New Zealand property market.
- Demand: the increase or decrease in the number of views per listing in that region, taken over a rolling three-month time frame, compared to the same three-month time frame the previous year – including the current month.
- Seasonal adjustment is a method realestate.co.nz uses to better represent the core underlying trend of the property market in New Zealand. This is done using methodology from the New Zealand Institute of Economic Research.
- Truncated mean is the method realestate.co.nz uses to provide statistically relevant asking prices. The top and bottom 10% of listings in each area are removed before the average is calculated, to prevent exceptional listings from providing false impressions.
Share
-
.svg)
.svg)
.svg)