
.svg)


Download the New Zealand Property Report as a print-ready PDF.
A rise in new property listings nationally is strongly underpinned by Canterbury and Wellington regions.
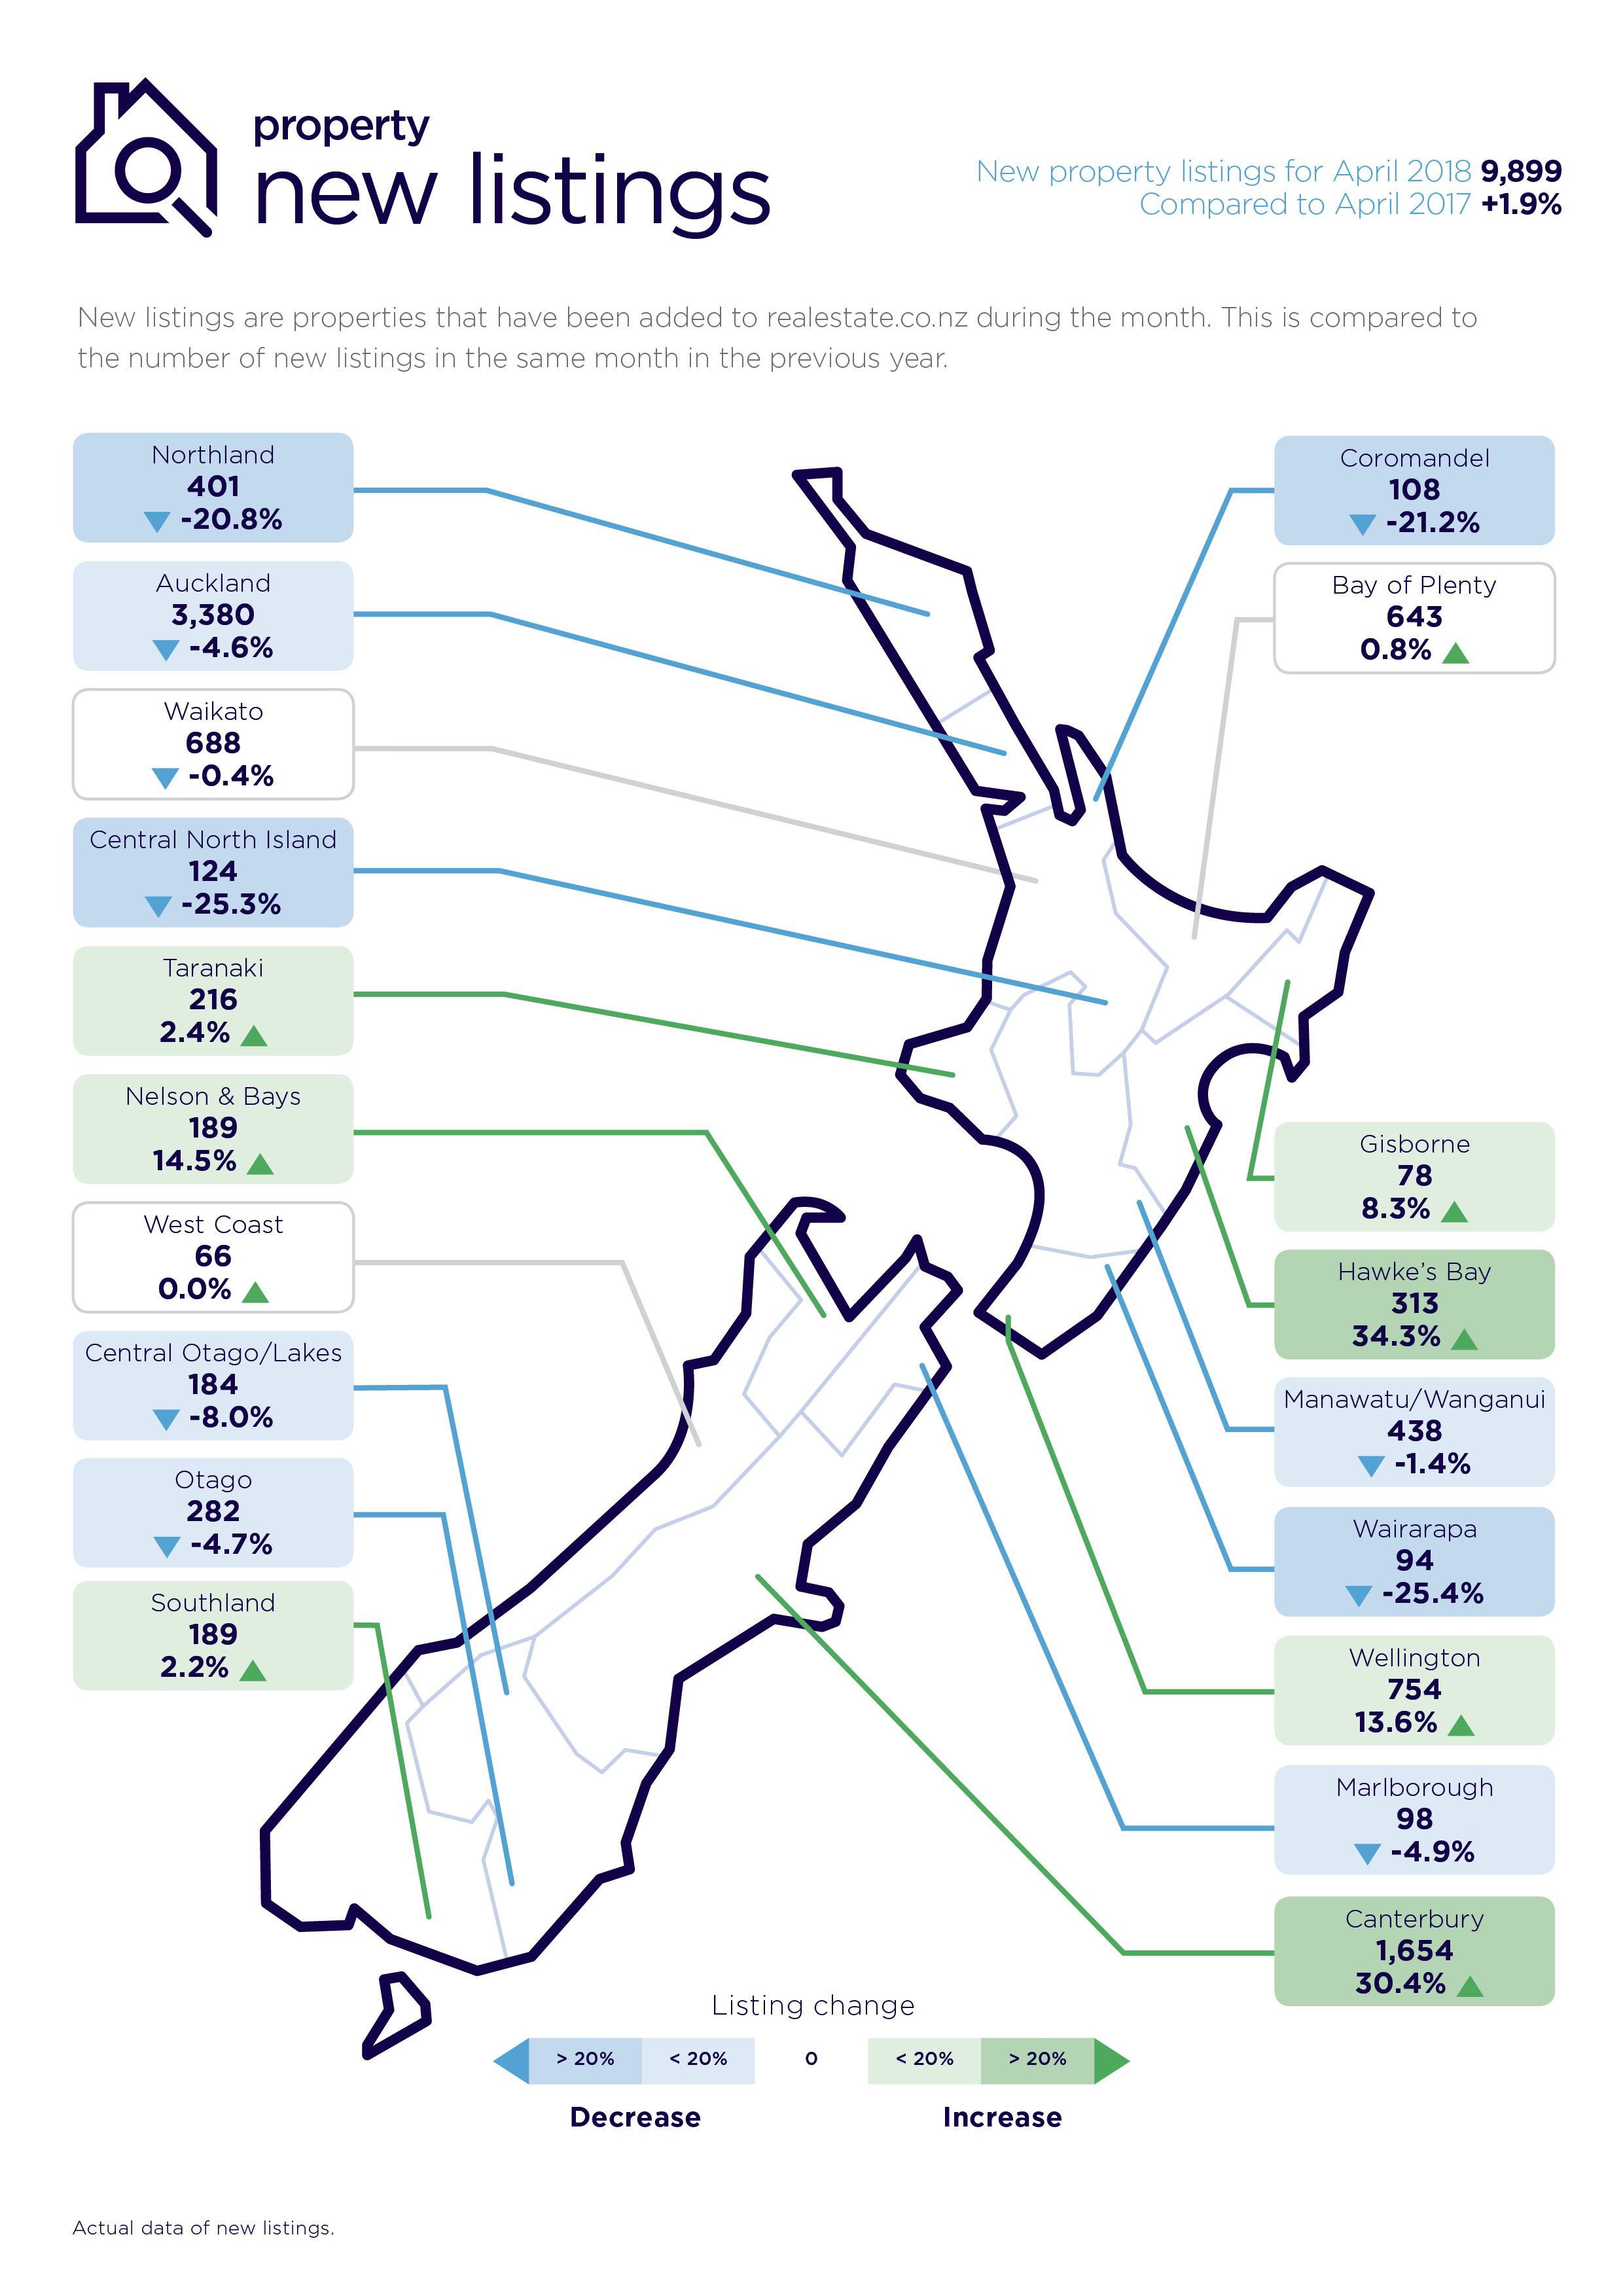
Real-time data from realestate.co.nz shows new property listings rose year on year for the first time since November 2017, when looking across New Zealand. New properties to market hit 9,899 in April, representing a 1.9% increase compared to the same period last year.
“On the face of it this increase looks relatively modest, but it’s a case of several smaller regions offsetting a volume drop in Auckland,” says Vanessa Taylor, spokesperson for the country’s largest property listing site.
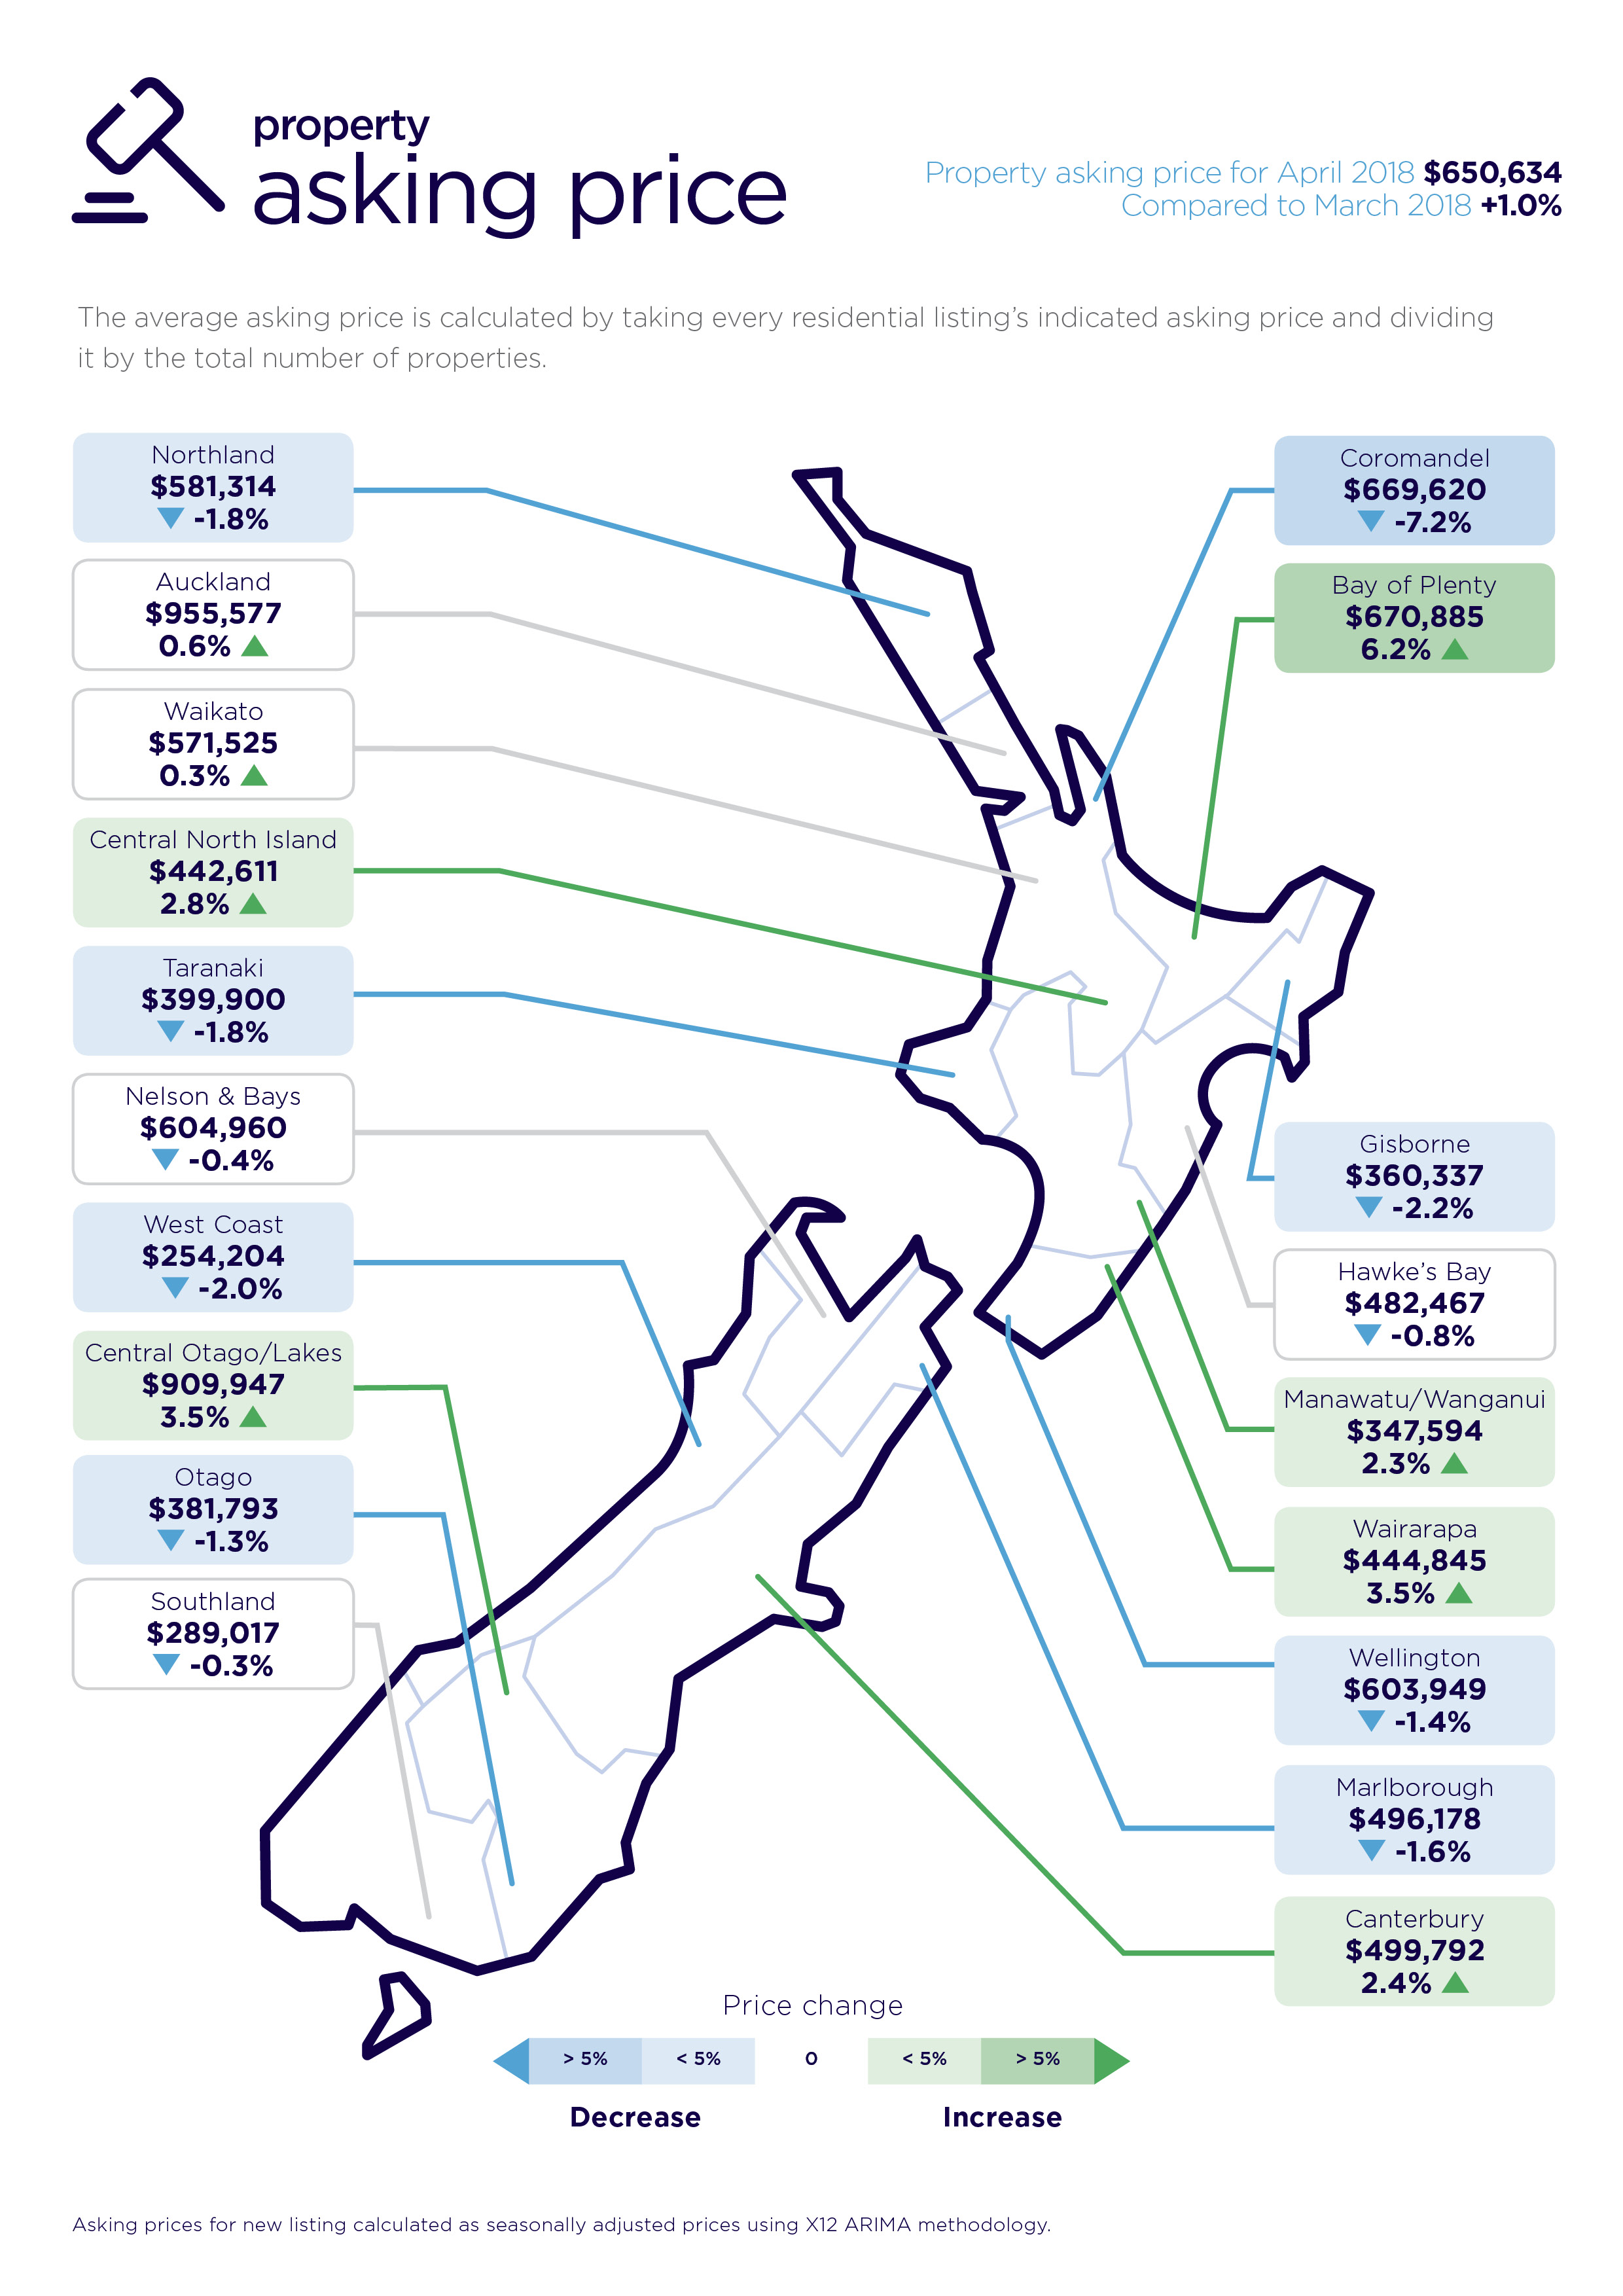
Auckland registered a 4.6% fall in new listings (3,380) compared to April 2017. Auckland asking prices remained static, with a 0.6% increase to $955,577 compared to March 2018.
“Typically, when Auckland gets cold, the rest of the country also suffers, but this time when it came to new property listings the rest of the country made up the numbers, led by Canterbury and Wellington,” says Vanessa.
While metrics are slow in our biggest city, Aucklanders are continuing to hunt in other regions of New Zealand. Property searchers from Auckland dwellers dominated the Northland, Coromandel, Bay of Plenty, Central North Island, Taranaki, Gisborne, Nelson and Bays and Marlborough regions.
Canterbury region new listings and asking prices up
The largest new listing contribution came from the Canterbury region with 1,654 homes placed on the market in April, representing a 30.% increase compared to the same month last year.
Asking prices in April also bounced back in Canterbury, increasing 2.4% on the previous month to $499,792.
“It’s been Canterbury’s time to go to market and it’s staying local,” says Vanessa, with the majority of the searches conducted in the Canterbury region performed by Cantabrians.
Christchurch Central was the top searched suburb, followed by St Alban’s, Rangiora and Merivale.
Wellington region – lift in new listings good for market
“Geographically, the Wellington region is relatively small compared to the likes of Canterbury and Auckland and it’s tightly held,” says Vanessa Taylor.
However, in April, the Wellington region recorded 754 new listings, which was the second highest increase of new listings of any region in the country. It represented a 13.6% increase on April 2017.
“This is good news for the region which has been relatively starved of new listings,” she says.
In April the Wellington region experienced a 1.4% fall in average asking price compared with the prior month. The April average asking price was $603,949, compared to $612,697 in March (which was a record high).
“With an increase in new listings and fine tuning in asking prices, Wellington is looking healthy right now,” says Vanessa.
Given that the region has been tightly held, it’s no surprise that Wellingtonians lead the online search for property in their region, followed by Aucklanders and Cantabrians.
The region is also attracting attention from offshore, with the next largest group searching for Wellington property originating from New South Wales.
The most popular search was for Te Aro, followed by Wellington Central, Khandallah, and Waikanae.
Hawke’s Bay region has wide appeal and new listings
“The Hawke’s Bay had a significant lift in new listings in April, up 34% on April 2017 to 313, and seemed to have broad-based appeal”, says Vanessa Taylor.
“Not only are the locals fans of the region, but it seems many people in the rest of the country are as well,” she says.
The largest number of people searching for property in the Hawke’s Bay region come from the Hawke’s Bay, which is a move from the region being dominated by Auckland buyers.
“They appear to be realistic and know their region well, including what they would expect to pay for a property,” she says.
The average Hawke’s Bay asking price in April was $482,467 which was relatively static compared to the prior month (-0.8%). When Hawke’s Bay people looked for property on realestate.co.nz their top search price bracket was $0 - $500k.
Top places searched in the region are Havelock North, Taradale, Napier Hill and Waipukurau.
Other regions of interest – April in brief
Otago, New Zealand’s fourth major region, recorded a fall in new property listings to 282, down 4.7% on April 2017 and a fall in the average asking price to $381,792, down 1.3% on March 2018.
Central Otago/Lakes continues to chase Auckland’s average asking price as the second most expensive region in the country. The region recorded a 3.5% increase in asking price to $909,947. New property listings were down 8.0% to 184.
The Waikato and Bay of Plenty regions have a history of attracting Aucklanders. In March, (like Auckland), the regions were generally static, although asking prices in both were at an all-time high. The Waikato region’s average asking price was $571,525 (+0.3% compared to the previous month). New listings were slightly down 0.4% to 688 when compared to April 2017.
In the Bay of Plenty, new listings were relatively static (643 listings representing a 0.8% increase on April 2017), while the average asking price was up 6.2% to a record high of $670,885.
Manawatu-Wanganui was the third region this month to see an all-time high asking price. The region hit $347,594, while new listings fell 1.4 % to 438.
Gisborne continues to be popular with Aucklanders, as measured by property searches on realestate.co.nz. In April, the number of new listings grew by 8.3% to 78 compared to April 2017, while asking prices fell 2.2% to $360,337 when compared to March 2018.
The favourite summer-time destinations of Northland, Coromandel and Marlborough cooled in April. The number of new listings (compared to April 2017) and property asking prices (compared to March 2018) fell in all three regions.
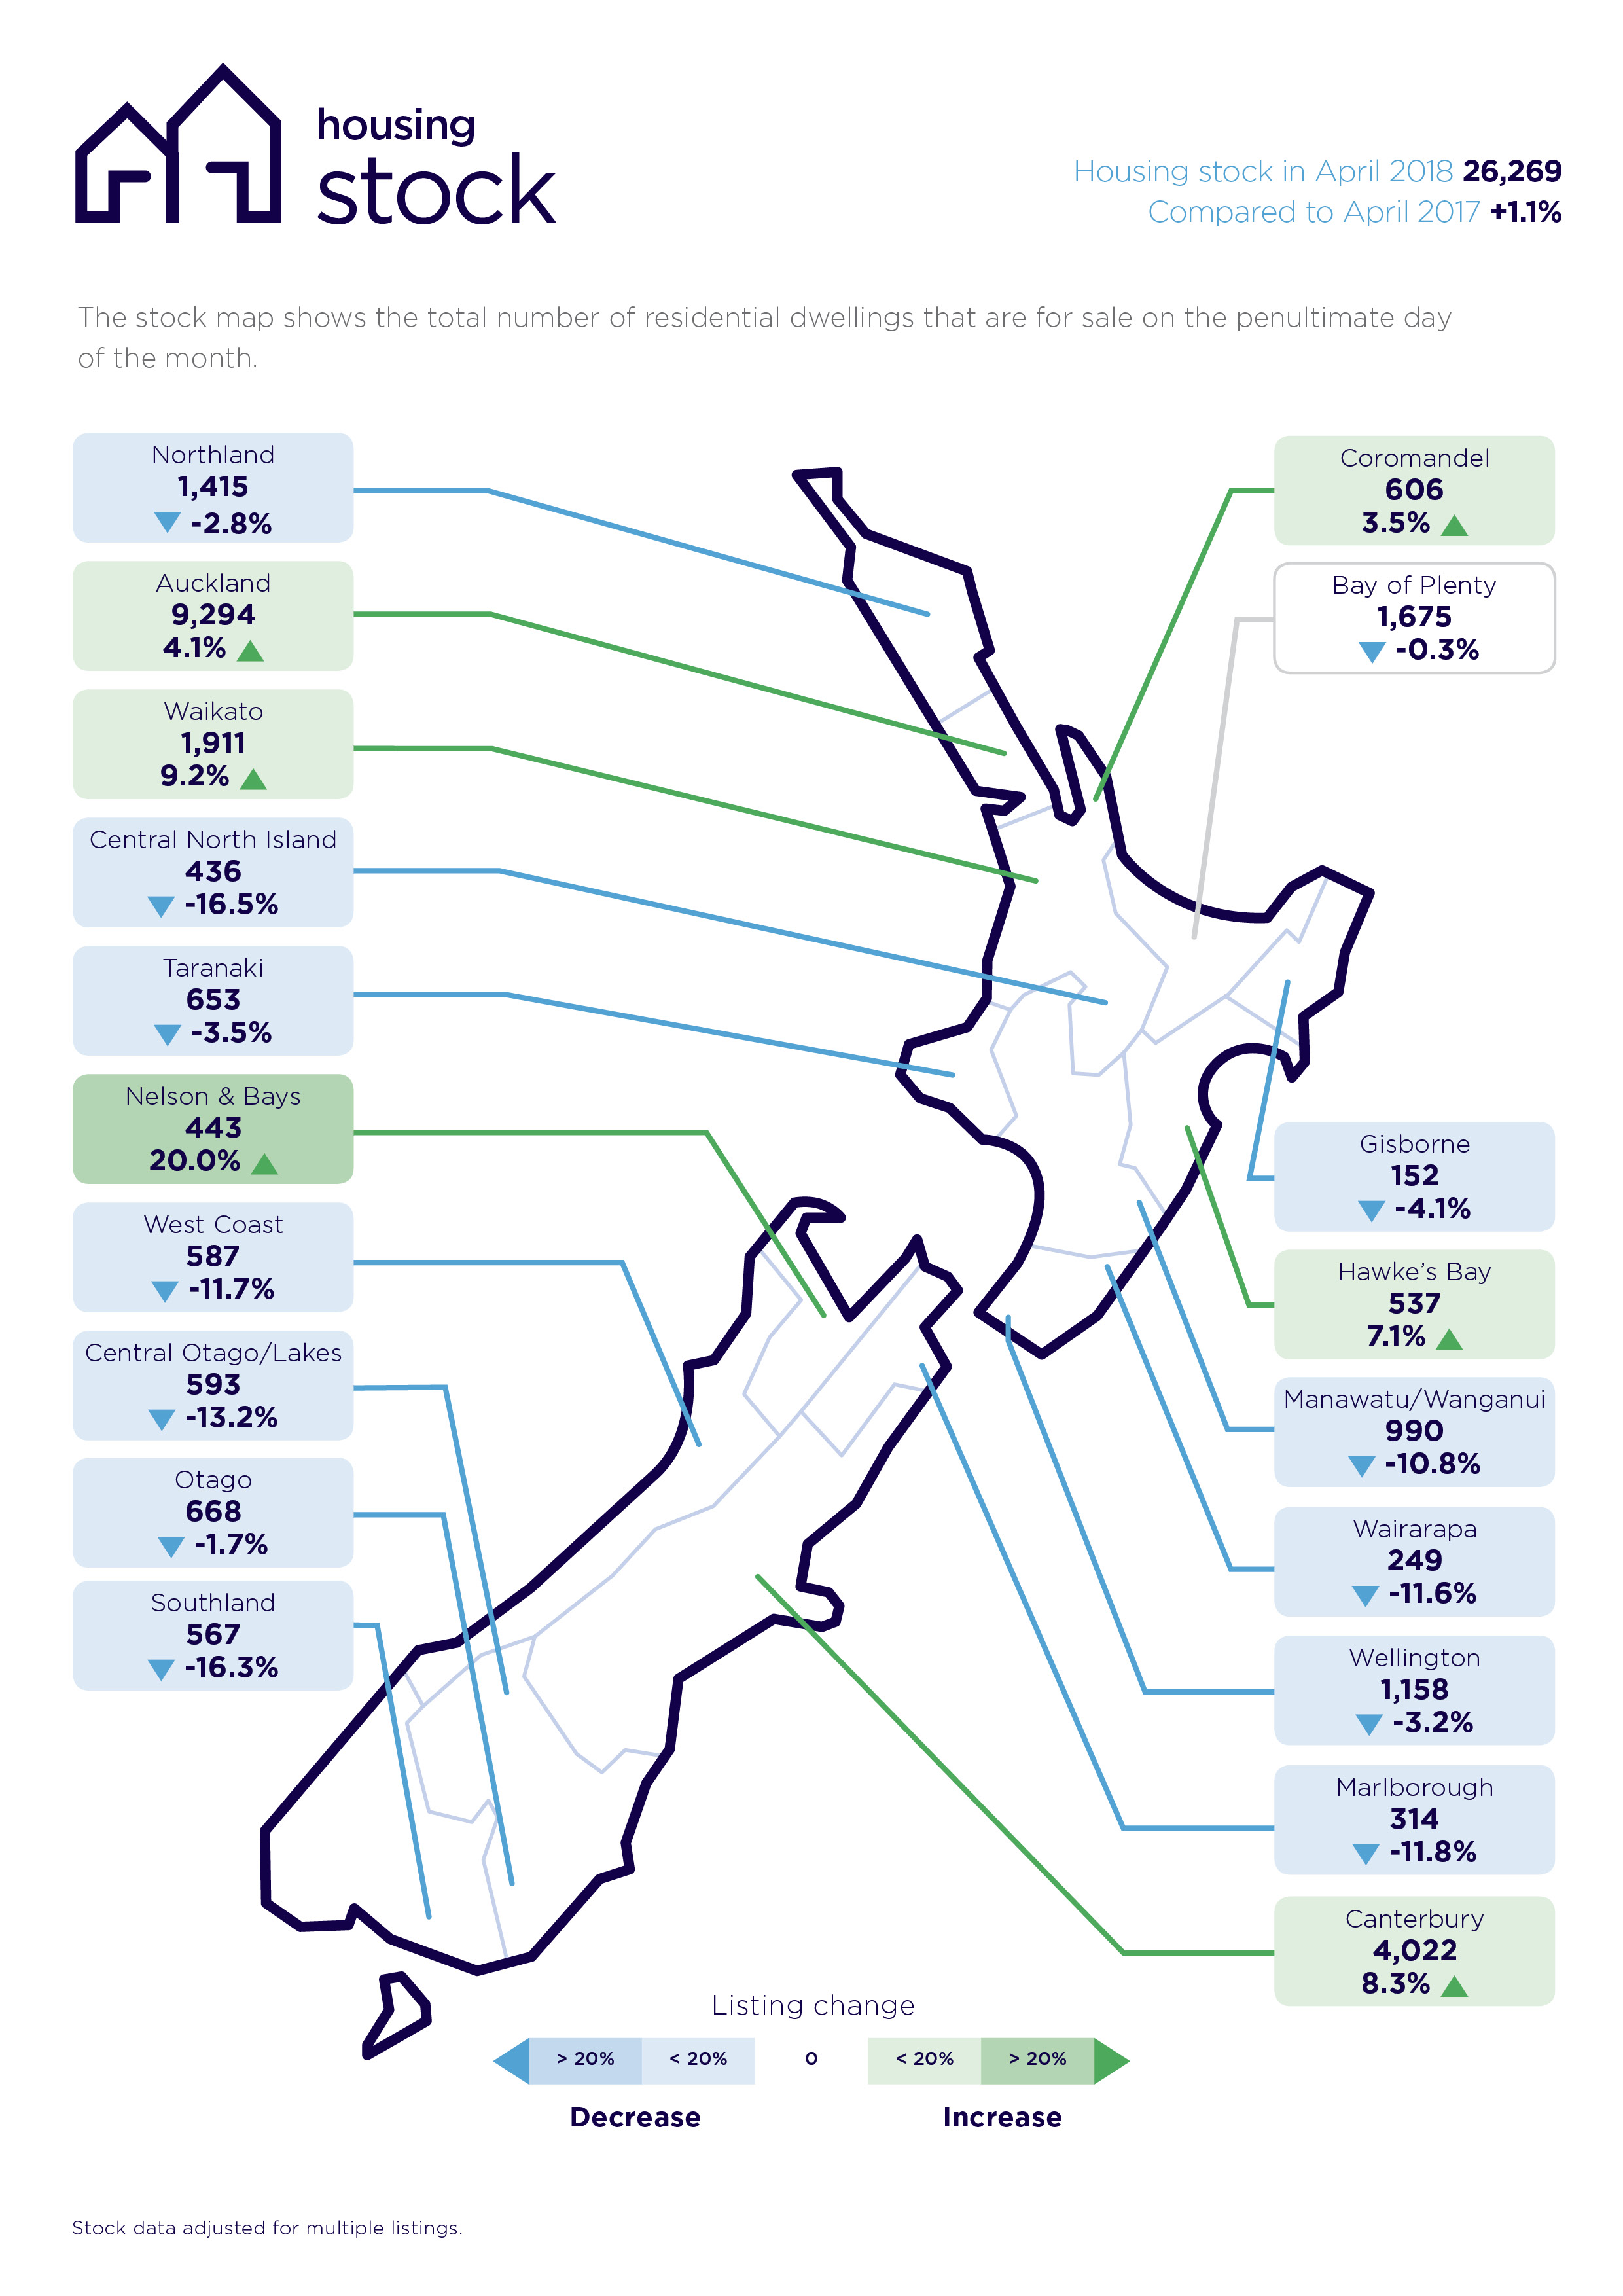
NB: The data was collated on the penultimate day of the month.
Glossary of terms
Being the only provider of real estate data in real time, realestate.co.nz offers valuable property market information not available from other sources.
• Average asking price gives an indication of current market sentiment. Statistically, asking prices tend to correlate closely with the sales prices recorded in future months when those properties are sold. As it looks at different data, average asking prices may differ from recorded sales data released at the same time.
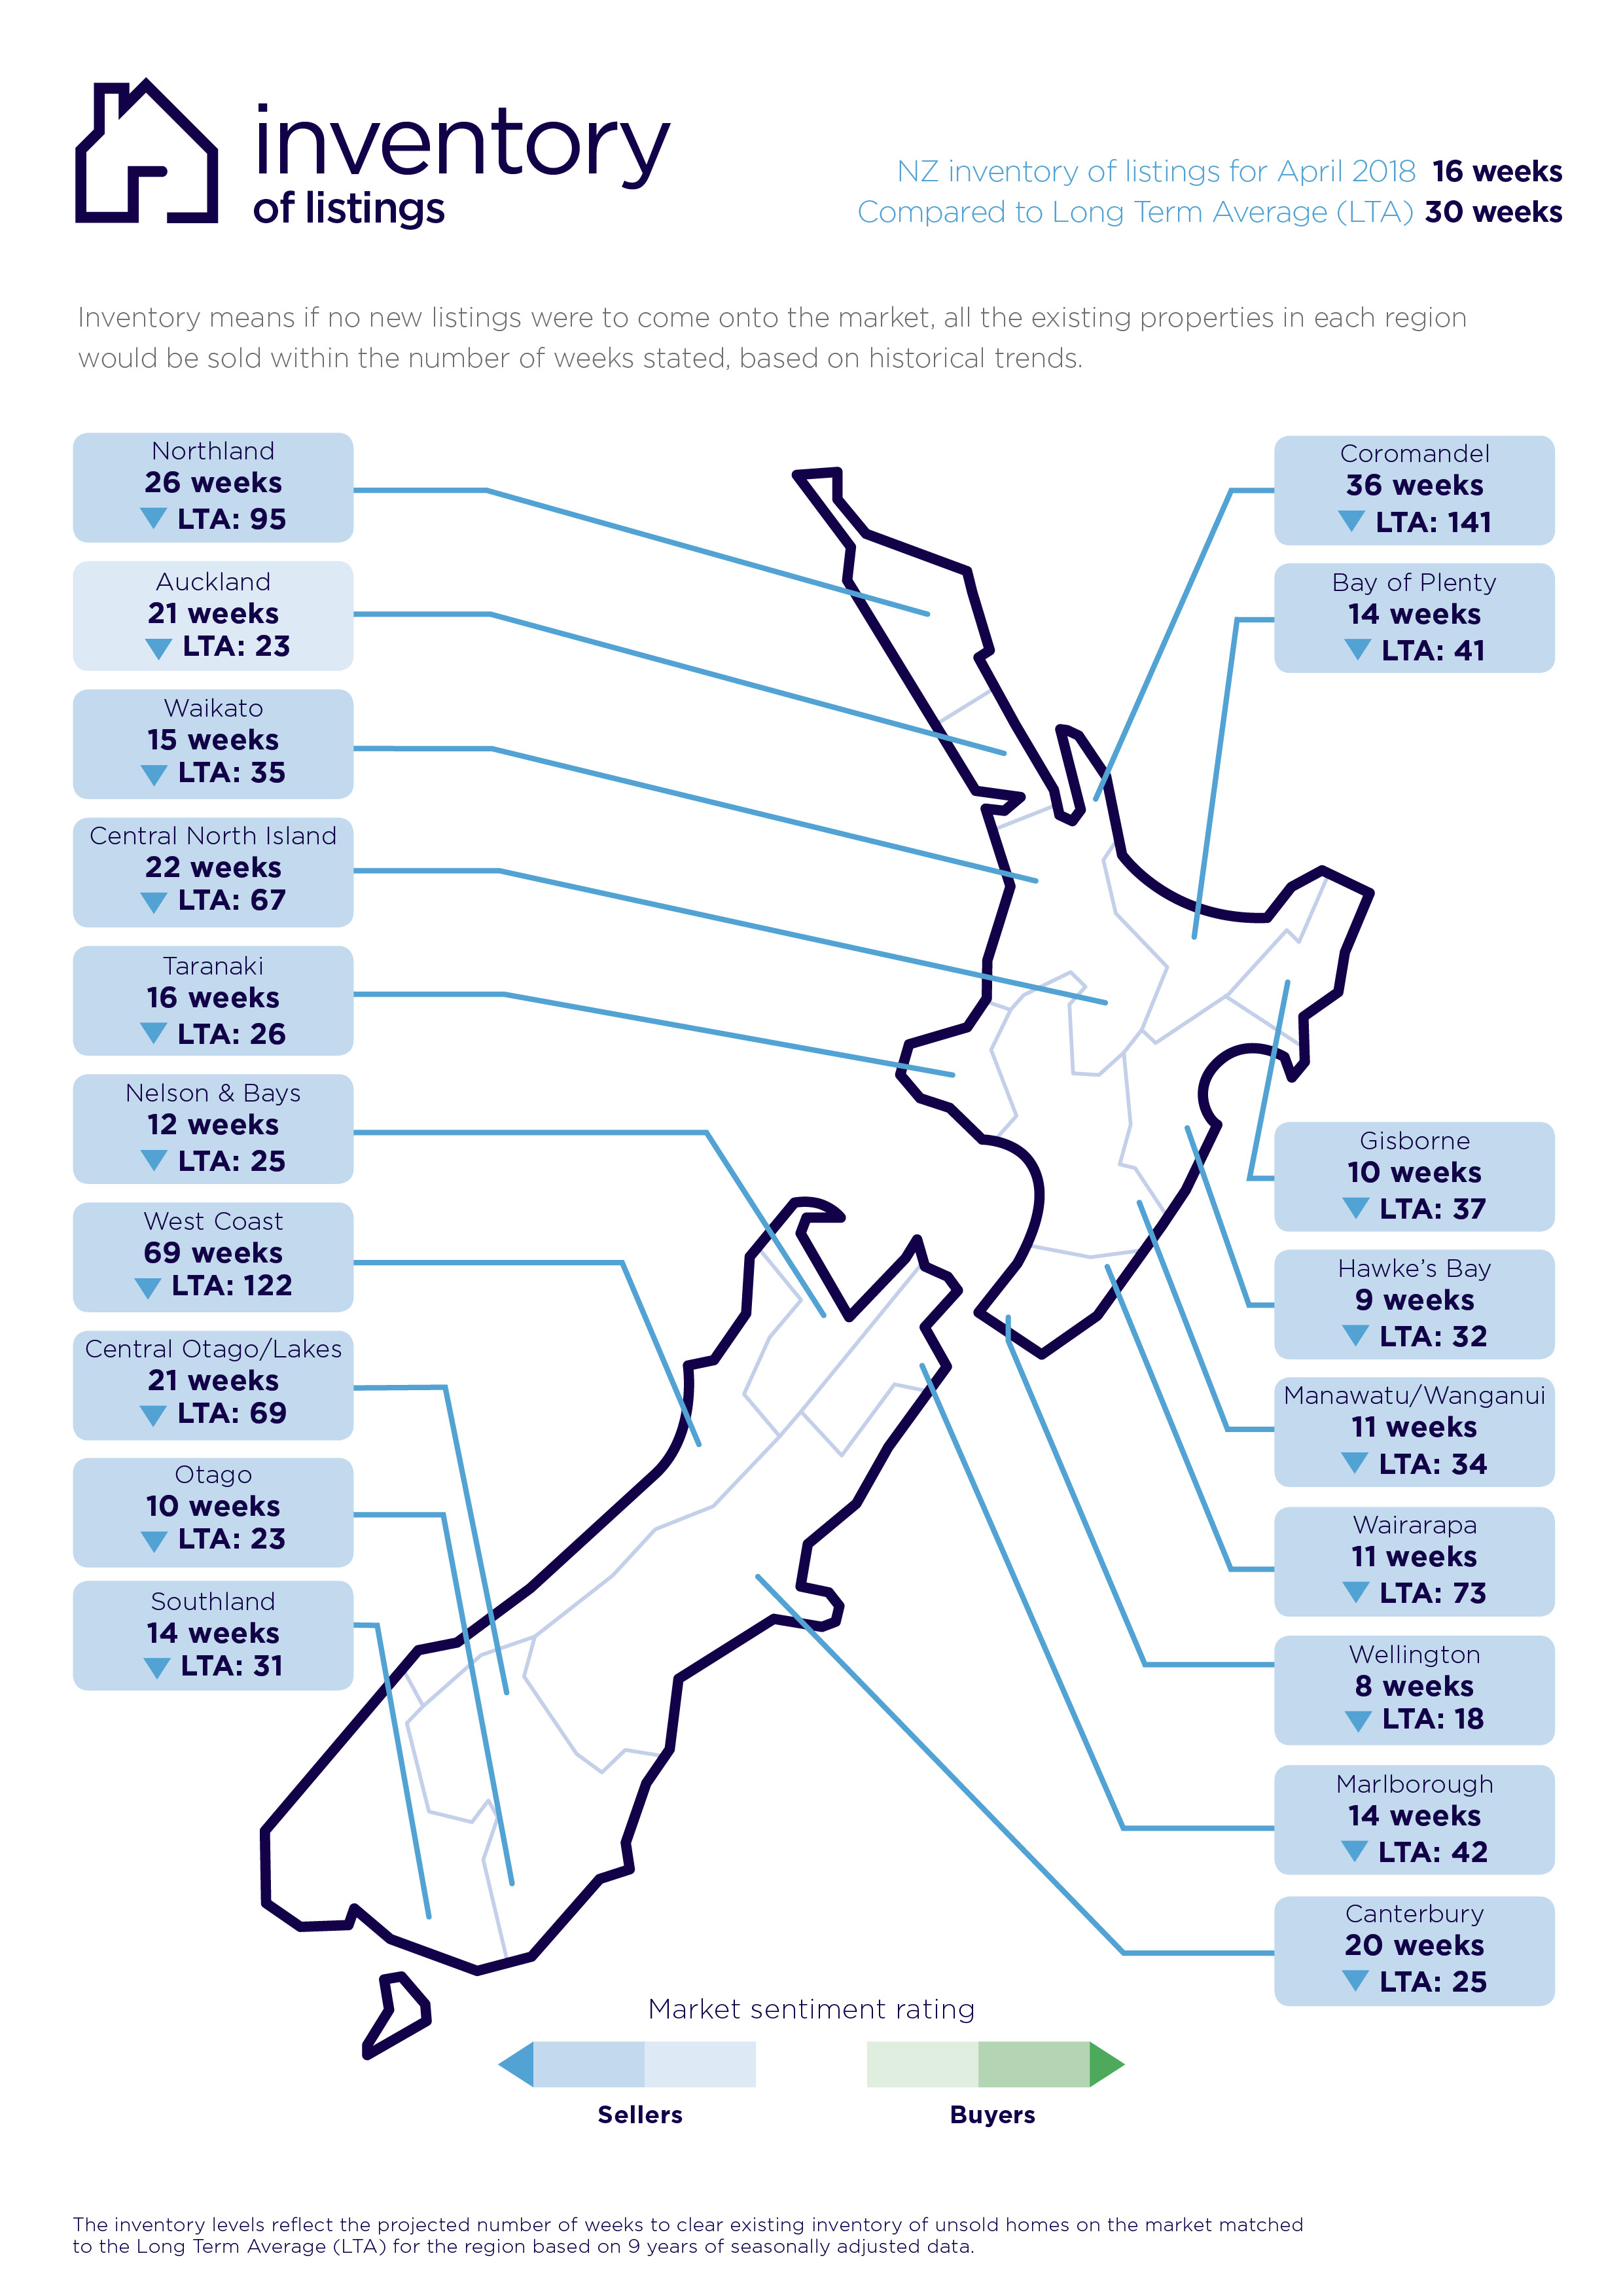
• Inventory is a measure of how long it would take, theoretically, to sell the current stock at current average rates of sale if no new properties were to be listed for sale. It provides a measure of the rate of turnover in the market.
• New listings are a record of all the new listings on realestate.co.nz for the relevant calendar month. As realestate.co.nz reflects 97% of all properties listed through registered estate agents in New Zealand, this gives a representative view of the New Zealand property market.
• *Demand the increase or decrease in the number of views per listing in that region, taken over a rolling three-month time frame, compared to the same three-month time frame the previous year – including the current month.
• Seasonal adjustment is a method realestate.co.nz uses to better represent the core underlying trend of the property market in New Zealand. This is done using methodology from the New Zealand Institute of Economic Research.
• Truncated mean is the method realestate.co.nz uses to provide statistically relevant asking prices. The top and bottom 10% of listings in each area are removed before the average is calculated, to prevent exceptional listings from providing false impressions.
For media enquiries, please contact:
Kate Carter, PPR T: +64 21 514 004 E: kate.carter@ppr.co.nz
Share
-
.svg)
.svg)
.svg)