Kiwis now have more choice when it comes to buying a home. An increase in new listings, coupled with static prices indicates the property market is back on track, says realestate.co.nz spokesperson Vanessa Taylor.
“The heat that lit the 2015-2016 market is no longer evident.
“The slow start to the 2017 year was equally challenging for buyers and sellers. What we are now seeing is a normalising of the market which will benefit both groups,” she says.
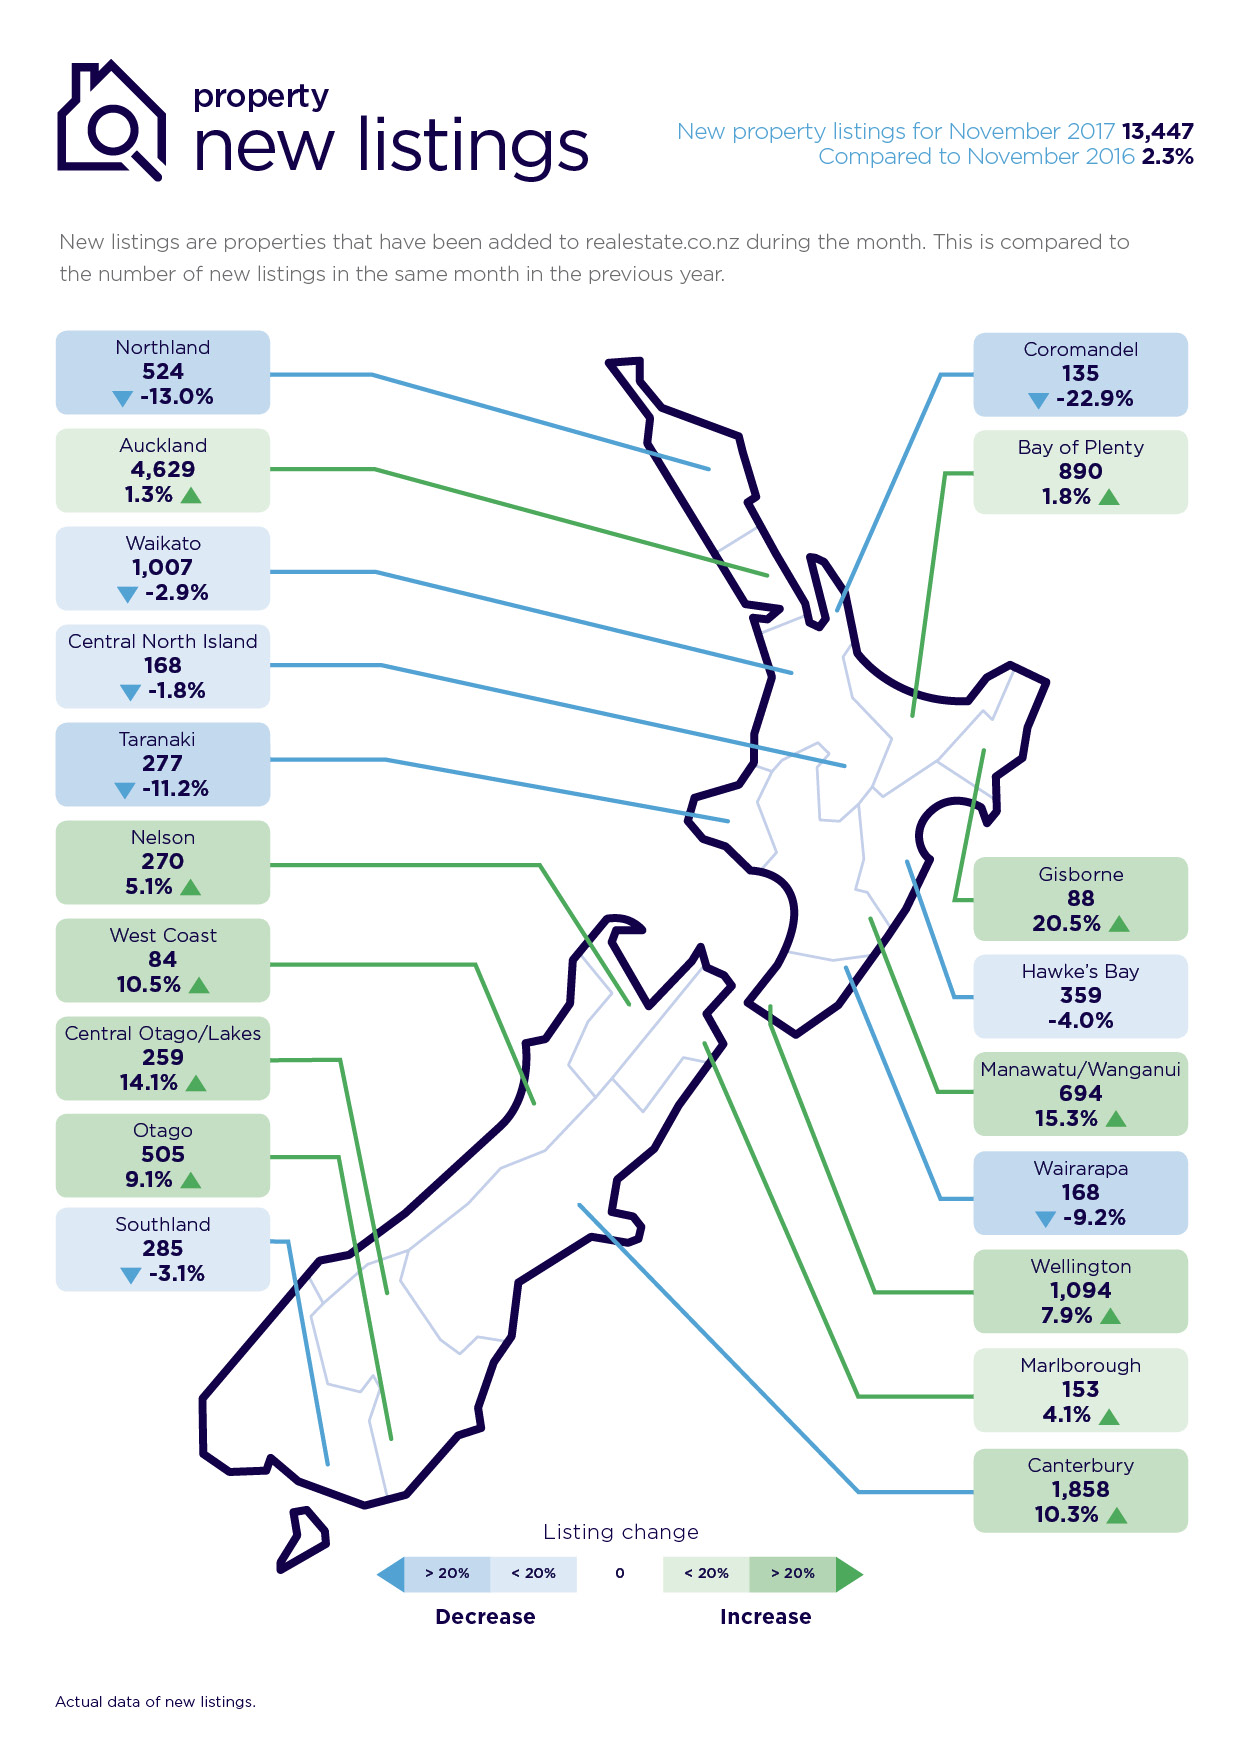
Real-time statistics from realestate.co.nz show that in November, there were 13,477 new listings across the country, the highest number since November 2014.
“With this increase, the market is now sitting where it should be in terms of total stock,” says Vanessa.
Total housing stock for sale across New Zealand stood at 27,488 in November, the highest level since March 2016.
Auckland made an impact on this number with a total of 9,935 homes on the market in November, which is a 23 per cent increase in stock compared to November 2016.
While there is more choice of homes on the market, asking prices have remained relatively static nationally.
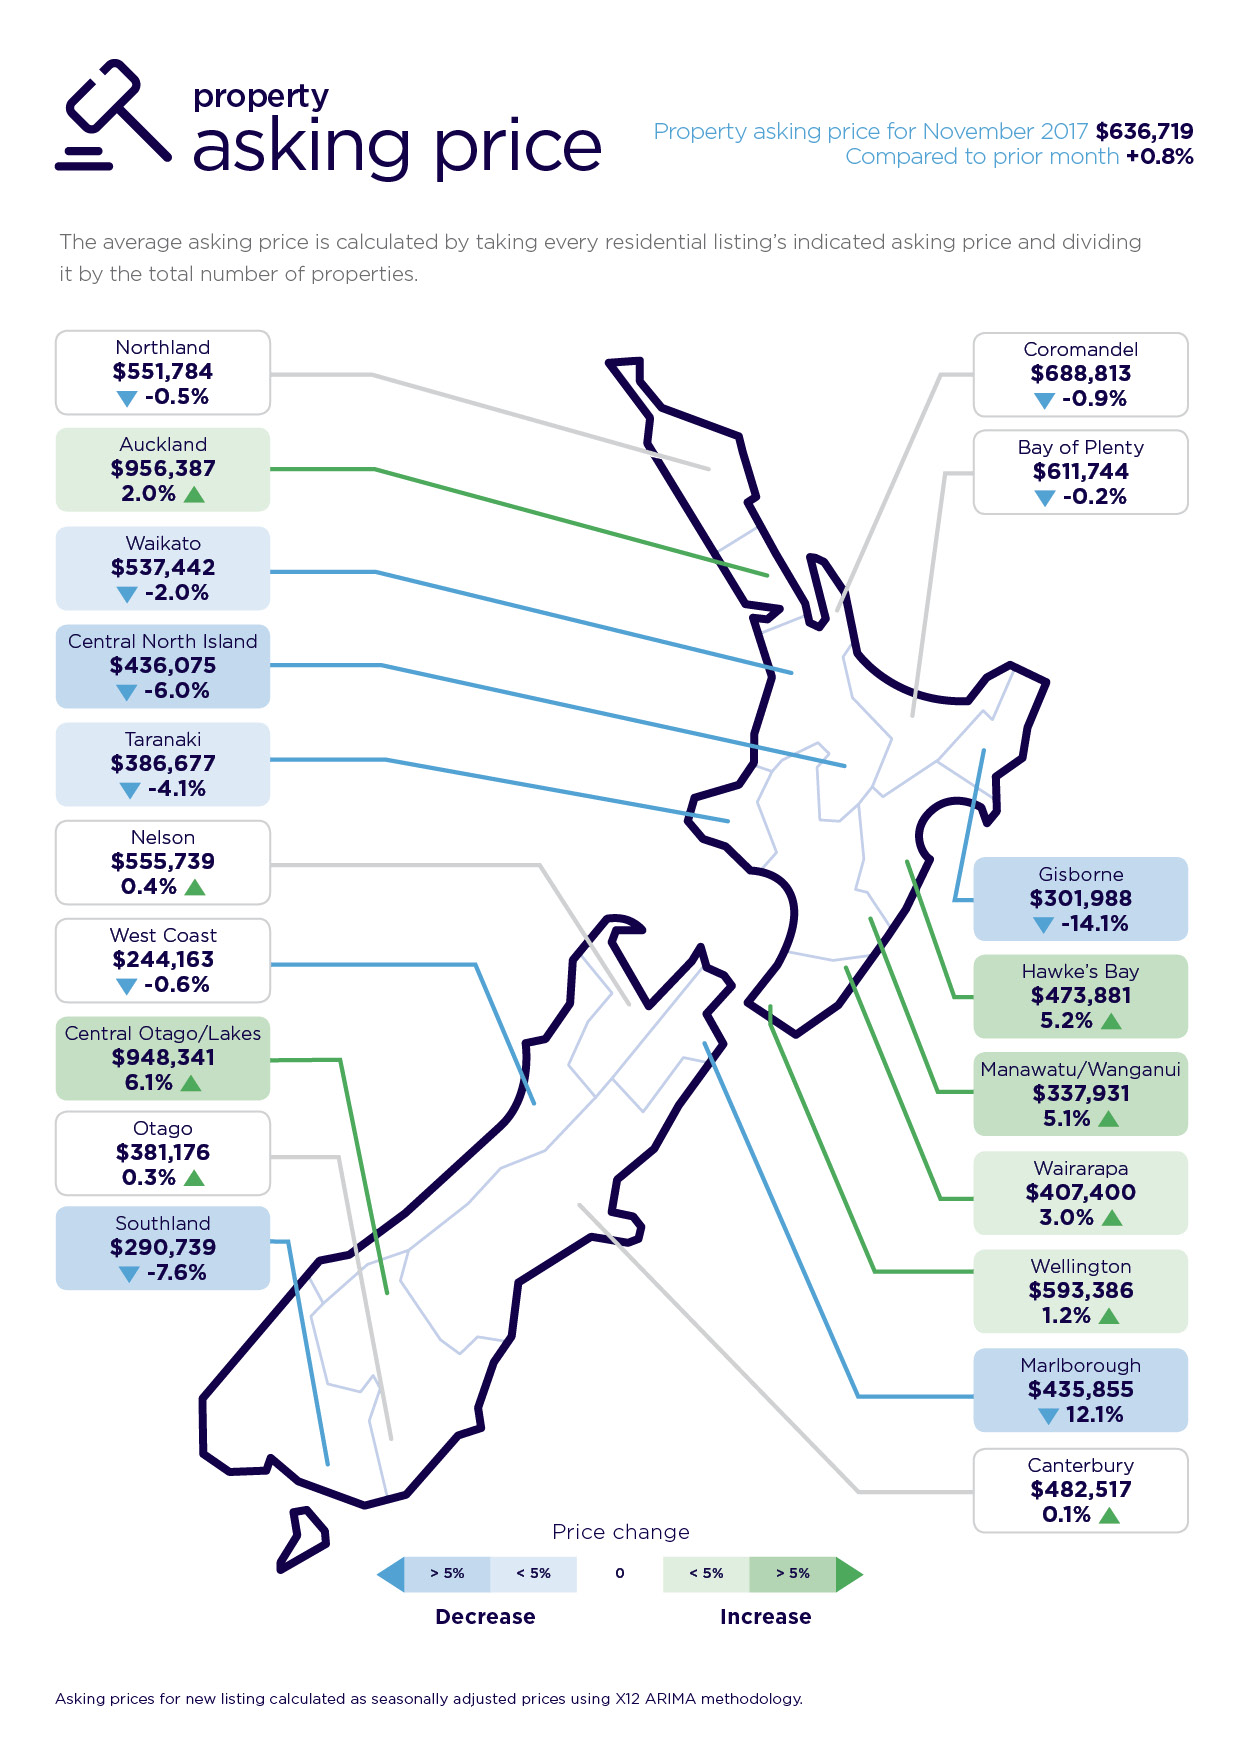
The average November asking price across the country sat at $636,719 which is only an 0.8 per cent increase on the previous month.
“This is even after Auckland recorded a two per cent jump in average asking price in November to $956,387 following a comparatively quiet year for the region,” says Vanessa.

A more stable market is a good market
“A more stable market is good for both sellers and buyers”, says Vanessa Taylor.
“Those looking to trade up or down can do so with more certainty about price expectations.
“There is more choice and less heat,” she says.
For new home buyers, realestate.co.nz welcomes the Reserve Bank’s announcement this week that from 1 January 2018, mortgage lenders will have the ability to approve loans to more customers who have less than a 20 per cent deposit.
“There is no doubt that buying a first home has been incredibly tough, across the country but particularly in Auckland” says Vanessa.
Property investors will also have the potential to benefit from new LVR measures announced by the Reserve Bank.
Auckland first home buyers have choice
While the average Auckland Council house valuation is now more than one million, first home buyers need to remember this is an average, not a starting point, says Vanessa Taylor.
A search on realestate.co.nz - the largest property listing site in the country, shows that there are thousands of homes where a lower LVR could make owning a new home more accessible, should they qualify for a lower LVR ratio.
realestate.co.nz statistics – search by asking price for all of Auckland
Number of residential listings for sale in the Auckland region as at 30 November
$0 - $600k - 1,796
$600k - $800k - 2,813
Total of 4,609 houses for sale in the Auckland region for under $800,000.

New listings lift in 11 regions
While Auckland dominated the lift in new listings by volume (4,629 new listings) in November, other regions recorded higher percentage level increases compared to November 2016.
The Gisborne region had the largest percentage lift (20.5 per cent) in November compared to the same month in the previous year.
Manawatu-Wanganui recorded a 15.3 per cent increase in the same period of comparison, followed by Central Otago/Lakes (14.1 per cent); West Coast (10.5 per cent); Canterbury (10.3 per cent); Otago (9.1 per cent); Wellington (7.9 per cent); Nelson/Bays (5.1 per cent); Marlborough (4.1 per cent); Bay of Plenty (1.8 per cent); and Auckland (1.3 per cent).
Central Otago/Lakes average asking prices closing in on Auckland
Compared to the previous month, the Central Otago/Lakes region recorded a 6.1 per cent increase in asking price in November – the highest percentage increase in asking price across the country.
The region’s average asking price rose to $948,341, which is hard on the heels of Auckland which recorded an average asking price of $956,387 in November, (an increase of two per cent) compared to the previous month.
Four other regions which recorded a lift in asking prices of significance (i.e. more than one per cent) were Hawkes Bay (5.2 per cent to $473,881); Manawatu/Wanganui (5.1 per cent to $337,931); Wairarapa (3 per cent to $407,400); and Wellington (1.2 per cent to $593,386).
Regions which showed static prices (i.e. between minus one and one per cent) were Bay of Plenty, Northland, West Coast, Nelson and Bays, Otago, Canterbury and Coromandel.
The largest falls in asking price were registered by Marlborough (-12.1 per cent to $435,855), and Gisborne (-14.1 per cent to $301,988) when compared to the previous month.

Glossary of terms
Being the only provider of real estate data in real time, realestate.co.nz offers valuable property market information not available from other sources.
• Average asking price gives an indication of current market sentiment. Statistically, asking prices tend to correlate closely with the sales prices recorded in future months when those properties are sold. As it looks at different data, average asking prices may differ from recorded sales data released at the same time.
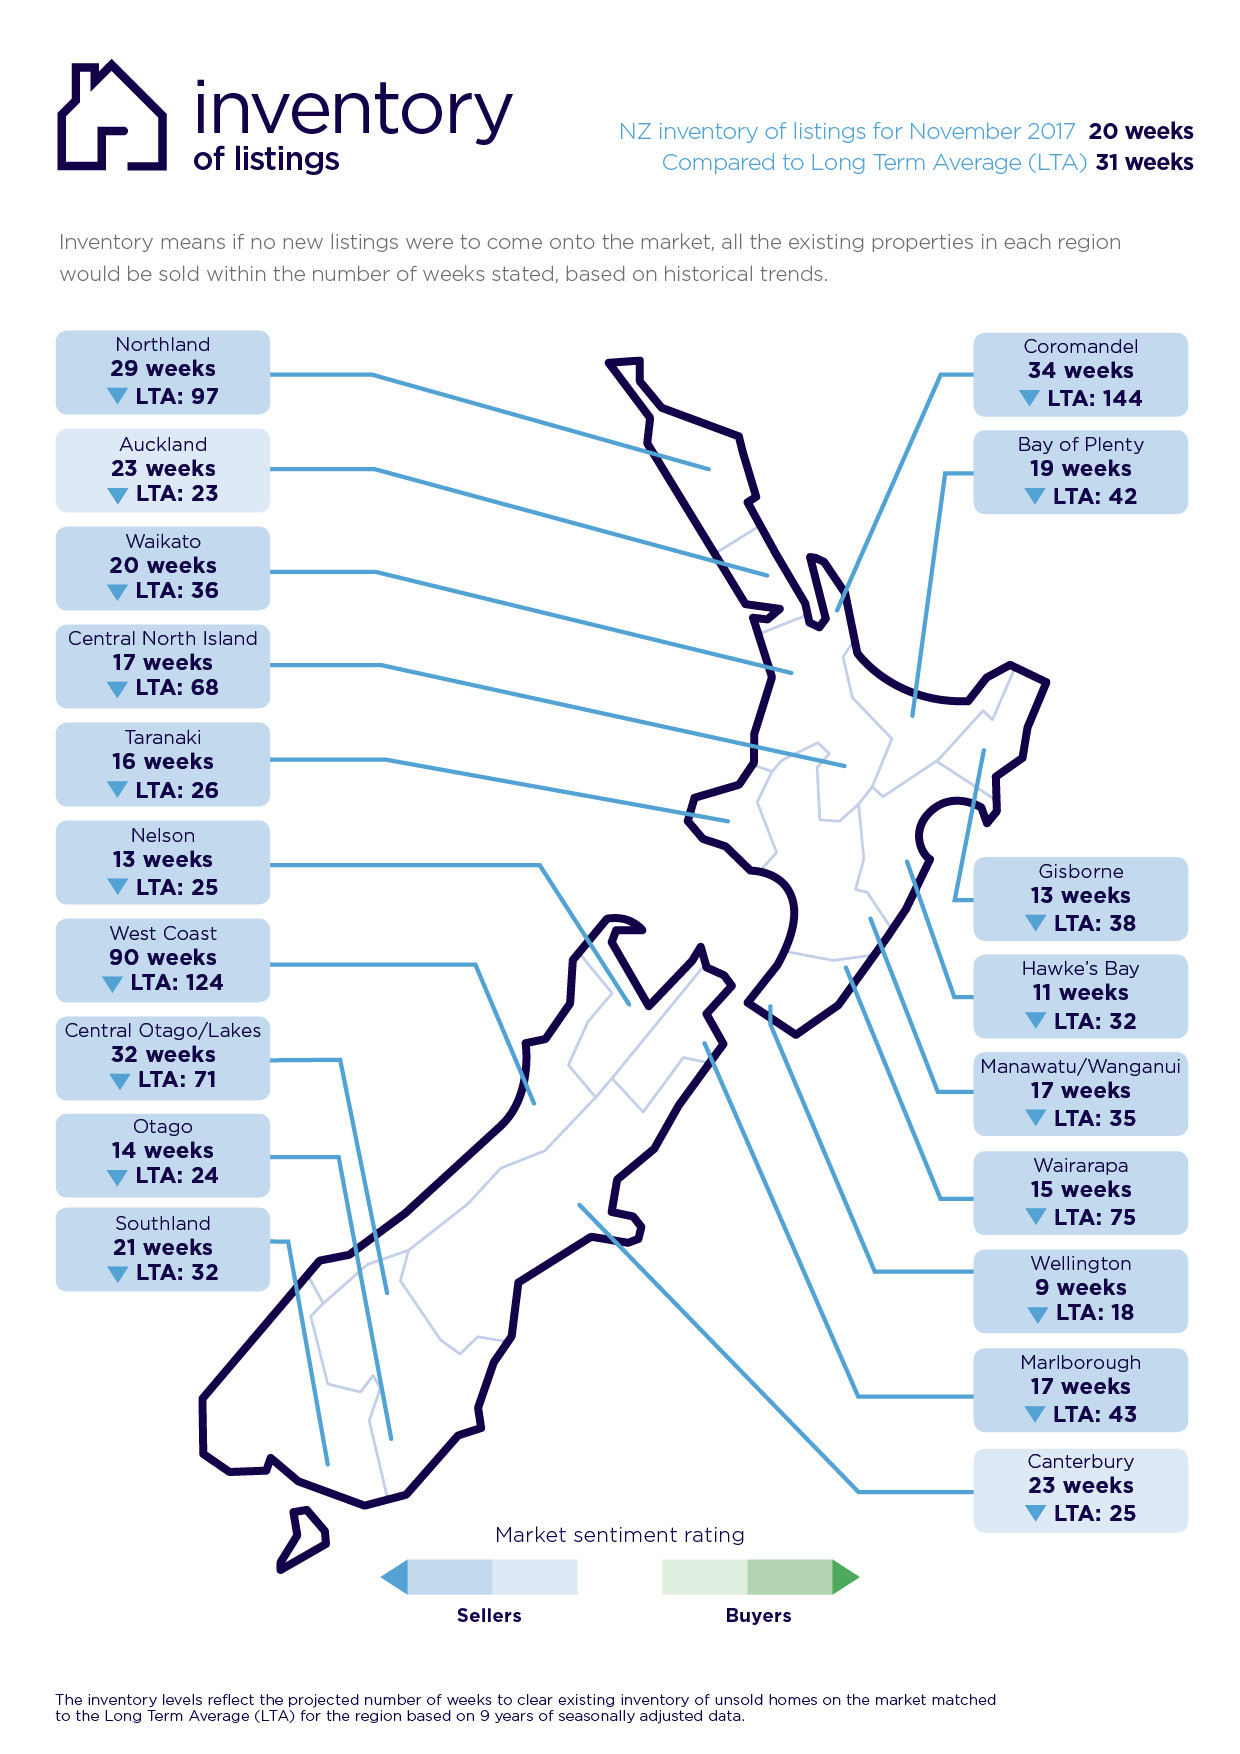
• Inventory is a measure of how long it would take, theoretically, to sell the current stock at current average rates of sale if no new properties were to be listed for sale. It provides a measure of the rate of turnover in the market.
• New listings are a record of all the new listings on realestate.co.nz for the relevant calendar month. As realestate.co.nz reflects 97 per cent of all properties listed through registered estate agents in New Zealand, this gives a representative view of the New Zealand property market.
• Demand: the increase or decrease in the number of views per listing in that region, taken over a rolling three-month time frame, compared to the same three-month time frame the previous year – including the current month.
• Seasonal adjustment is a method realestate.co.nz uses to better represent the core underlying trend of the property market in New Zealand. This is done using methodology from the New Zealand Institute of Economic Research.
• Truncated mean is the method realestate.co.nz uses to provide statistically relevant asking prices. The top and bottom 10 per cent of listings in each area are removed before the average is calculated, to prevent exceptional listings from providing false impressions.
30 Nov 2017

