
.svg)


Aucklanders are significantly more interested in properties outside their region compared to the same time last year, according to the latest data from realestate.co.nz.
“The number of people from Auckland looking at properties in other parts of the country has increased significantly over the year from last May. This is a dramatic change in online searching behaviour, which could well be driven by record high property prices in Auckland,” says Brendon Skipper, CEO of realestate.co.nz.
Properties for sale in Hawke’s Bay have attracted the greatest increase in levels of interest, with 152.2% more Aucklanders looking at properties in that region compared to the same month last year. Other regions which have seen a jump in interest from Aucklanders include Manawatu/Wanganui (+123.4%), Waikato (+113.8%), Northland (+85.5%) and the Bay of Plenty(+83.5%).
While Aucklanders are spreading the net wider when they look for property, offshore Asian investors appear to be showing less interest than before in the country’s property market, with 20% fewer viewers from Asian countries looking at New Zealand properties online this May, compared to the same month last year. However, this decrease is largely offset by a 19.9% increase in interest from investors elsewhere in the world, particularly from Australia, the USA and the UK.
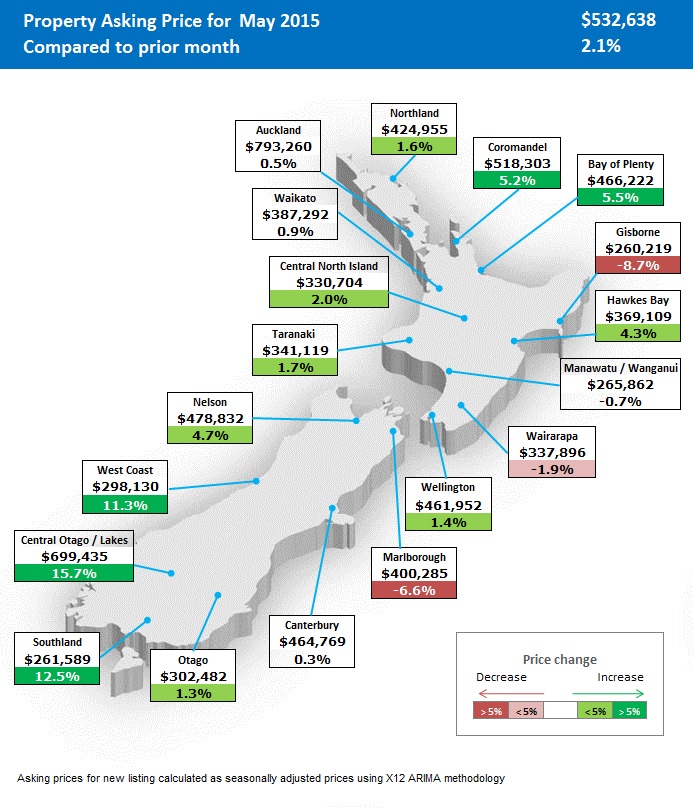
Average asking price in Auckland stabilises
Meanwhile, asking prices for houses in Auckland stabilised in May, according to realestate.co.nz. The average asking price in the city was $793,260, which is a marginal increase of 0.5% from the record high in April.
However, significant increases in asking price in a number of other regions across the country in May pushed the national average asking price to a new all-time high of $532,638, an increase of 2.1% on the previous record set in April. The biggest jump was recorded in Central Otago, where the average asking price in May was $699,435, up 15.7% from April. Other regions with big increases include Southland (up 12.5%, to $261,598), West Coast (up 11.3%, to $298,130), Bay of Plenty (up 5.5%, to $466,222), and the Coromandel (up 5.2%, to $518,303). Bucking this trend were Gisborne and Marlborough, where the average asking price decreased notably, by 8.7% and 6.6% respectively.
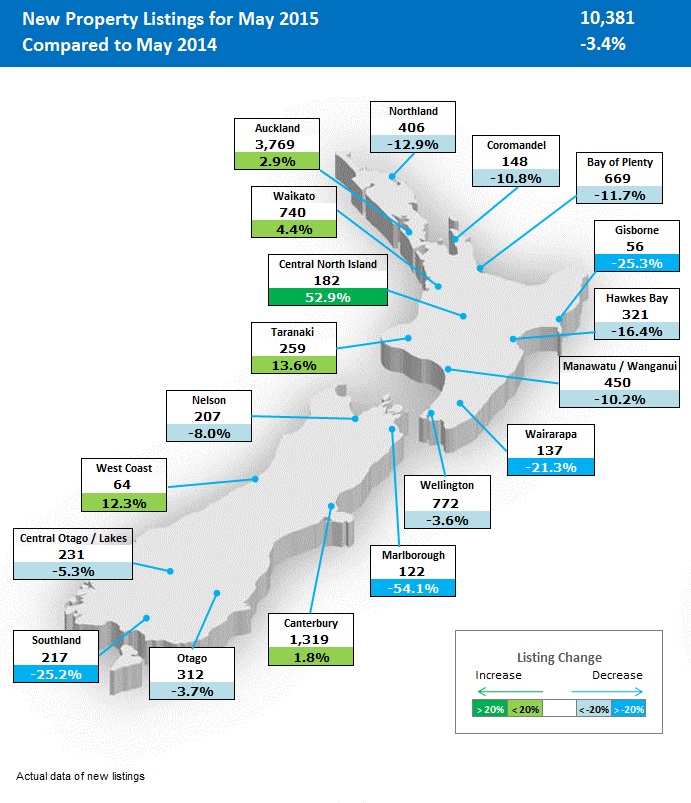
Fewer homes listed for sale
There were 10,381 new listings nationwide in May, which was 3.4% less than the same time last year. Despite the national decrease, listings in some regions did increase, such as Auckland (3,769 new listings, up 2.9% compared to May 2014), Canterbury (1,319, up 1.8%), Waikato (740, up 4.4%), Taranaki (259, up 13.6%), Central North Island (182, up 52.9%) and West Coast (64, up 12.3%).
The national average in overall inventory of available housing stock for sale fell to an all-time low of only 20 weeks in May, breaking the record of 21.3 weeks set just the month before. Inventory is a measure of supply and demand that indicates how long it would take, in theory, for all the current properties on the market to be sold at the current average rate of sales. The long-term national average, since January 2007, is 35 weeks.
Share
-
.svg)
.svg)
.svg)