New listings are back to normal March levels, stock levels return to where they were in 2015, and prices remain stable.
Despite Kiwis feeling the pinch of rising interest rates, high levels of inflation, and recessionary pressures, the New Zealand property market has remained resilient.
- Average asking prices stay static
- Stock up 13.5% year-on-year, rising to 2015 levels
- Could buyers turn the key on new opportunities?
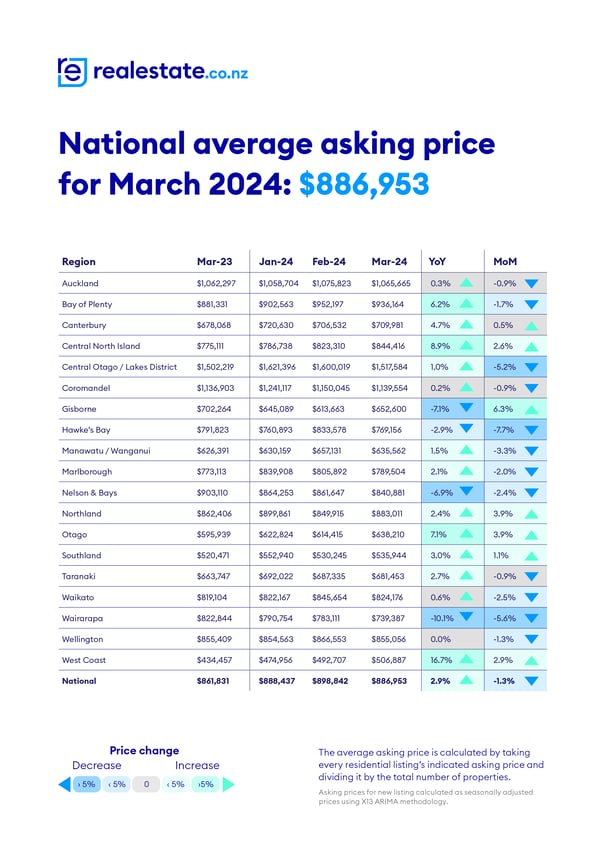
The latest data from realestate.co.nz shows that the national average asking price has remained static overall, with modest growth of 2.9% over the last 12 months.
During March, new listings were up nationally by 23.9% year-on-year and in all regions except Nelson & Bays and the West Coast, while stock lifted back to levels not seen since 2015.
Sarah Wood, CEO of realestate.co.nz, suggests the increase in supply is a return to normal after last year's unusually low new listings. She explains that in March 2023, Kiwis were facing a lot of uncertainty, which led many to delay transacting property:
“We might have been beyond COVID-19 lockdowns and border closures, but inflation was at a level not seen since the 1990s, and everyone was watching the Official Cash Rate for clues on interest rates.”
“Although these financial challenges haven’t gone away, relative price stability and return to ‘normal’ listing volumes indicate good property market resilience.”
Average asking prices stay static
Prices sat relatively stable during March, with no average asking price highs in any of our 19 regions. Our national average asking price also saw minimal change - up 2.9% year-on-year and down 1.3% month-on-month.
“Our national average asking price has grown modestly in the past year, fluctuating between $860,000 and $890,000. This seems to be a correction on the early 2022 peak when it neared $1 million,” explains Wood.
Regional New Zealand took charge this month as five of our 19 regions witnessed increases in average asking prices both year-on-year and month-on-month during March:
- Northland (2.4% year-on-year and 3.9% month-on-month)
- Central North Island (8.9% year-on-year and 2.6% month-on-month)
- West Coast (16.7% year-on-year and 2.9% month-on-month)
- Otago (7.1% year-on-year and 3.9% month-on-month)
- Southland (3.0% year-on-year and 1.1% month-on-month).
After exceeding $1.6 million for two months, the average asking price in Central Otago/Lakes District has dipped back into the $1.5 million range. Despite this fluctuation, it retains its position as the region with the highest average asking price in the country. Given the amount of luxury stock in the area, Wood notes that such variations aren’t unexpected.
Meanwhile, at the opposite end of the spectrum, the West Coast, known for having the nation’s lowest average asking price, surpassed the $500,000 mark last month for only the second time in the 17 years since records began.
Wood says that the variation across our regions signals that each local market responds differently to economic factors, and that is why she always recommends speaking to your local agent when buying or selling, for the most up-to-date insights on what is happening in your area.

Stock up 13.5% year-on-year, rising to 2015 levels
Mirroring February's peak, which was the highest in nine years, total stock levels in March also remained at a level not seen since 2015. With 33,245 properties available nationwide, buyers had more to choose from.
Once again, the regions led the revival in stock, particularly in Coromandel, with an impressive year-on-year increase of 41.1%, Northland up 33.6%, and Central North Island saw a 20.7% rise.
Looking at stock levels in the major centres, Auckland saw a healthy rise of 17.7% year-on-year, Wellington rose by 3.5%, and Canterbury was up 2.9%.
“This increase in stock around the country means buyers have more to choose from than they have in almost nine years,” says Wood.
Gisborne, however, diverged from this upward trend, experiencing a 26.1% decrease and recording an all-time low in stock for any March on record. The region also saw stock levels decrease during February. Wood remarks that this could be an interesting time for sellers in the Gisborne region:
“With less competition in this regional market, bucking the national trend, it could be a good time for Gisborne vendors who are considering putting their property on the market as there is less competition in the region.”


Could buyers turn the key on new opportunities?
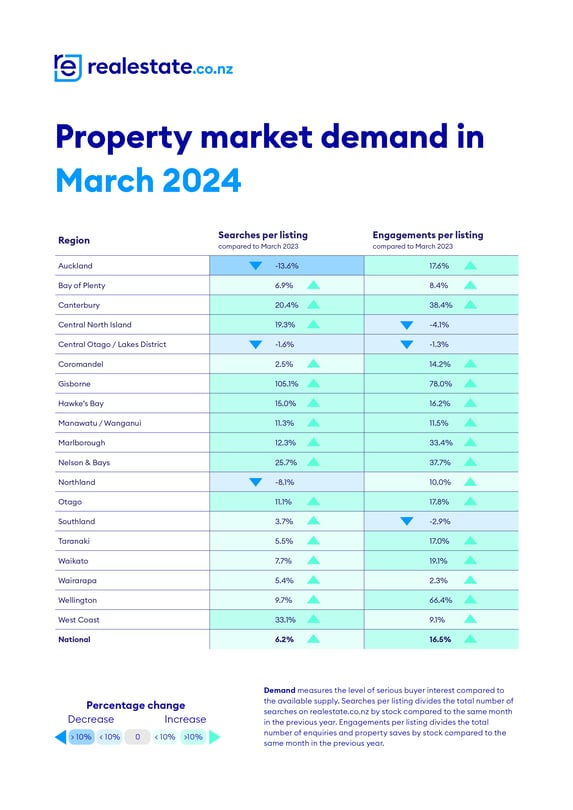
While personal circumstances will always trump market conditions, the current market may offer windows of opportunity for property seekers. Display price narrowly overtook auctions as the most popular price type last month, potentially signalling more favourable conditions brewing for buyers.
“Auctions are a sign of strong seller confidence, so the reduction of auction listings combined with increased stock levels are early signals that buyers could have more leverage in negotiations,” says Wood.
“There also remains ample opportunity for sellers. My advice for those looking to transact property is to surround yourself with experts who will be able to market your property well.”

For media enquiries, please contact:
Liz Studholme | liz@realestate.co.nz
Want more property insights?
- Market Insights: Search by suburb to see median sale prices, popular property types and trends over time.
- Sold properties: Switch your search to sold to see the last 12 months of sales and prices.
- Valuations: Get a gauge on property prices by browsing sold residential properties, with latest sale prices and an estimated value in the current market.
Find a glossary of terms here.
03 Apr 2024

