
.svg)


The latest data from realestate.co.nz shows post-election confidence has hit the New Zealand property market. During October, new listings were up, auctions regained popularity with sellers, and the national average asking price lifted back to January 2023 levels.
- Auctions are in; display prices are out
- Average asking prices back up to January 2023 levels
- New listings up 22.0% on September – more than the average October lift of 16.0%
The number of people searching on realestate.co.nz also increased by 7.0% compared to September and was up by 3.1% compared to the same time last year^ - signalling growing interest from buyers during October.
Vanessa Williams, spokesperson for realestate.co.nz, says these indicators suggest the market is starting to move:
“It is difficult to say for sure what is causing the shift. It could be the coming change of government, the OCR holding for the third consecutive month or the cyclical nature of the property market.”
“However, this will be welcome news for anyone wanting to sell.”
She adds that real estate agents are reporting increased numbers through open homes, another sign of market stimulation.
Auctions are in; display prices are out
Auctions overtook display price as the most popular method of sale last month. 28.3% of all listings on realestate.co.nz during October were listed for sale by auction, while those with display prices comprised 26.5% of all listings.
Vanessa says this change indicates the market is becoming more competitive:
“Auctions are generally more popular in a hot market. Seeing the number of auctions increase tells us that buyers and sellers are both more confident to transact under the hammer.”
The number of listings for sale by auction at realestate.co.nz has steadily increased since May this year.


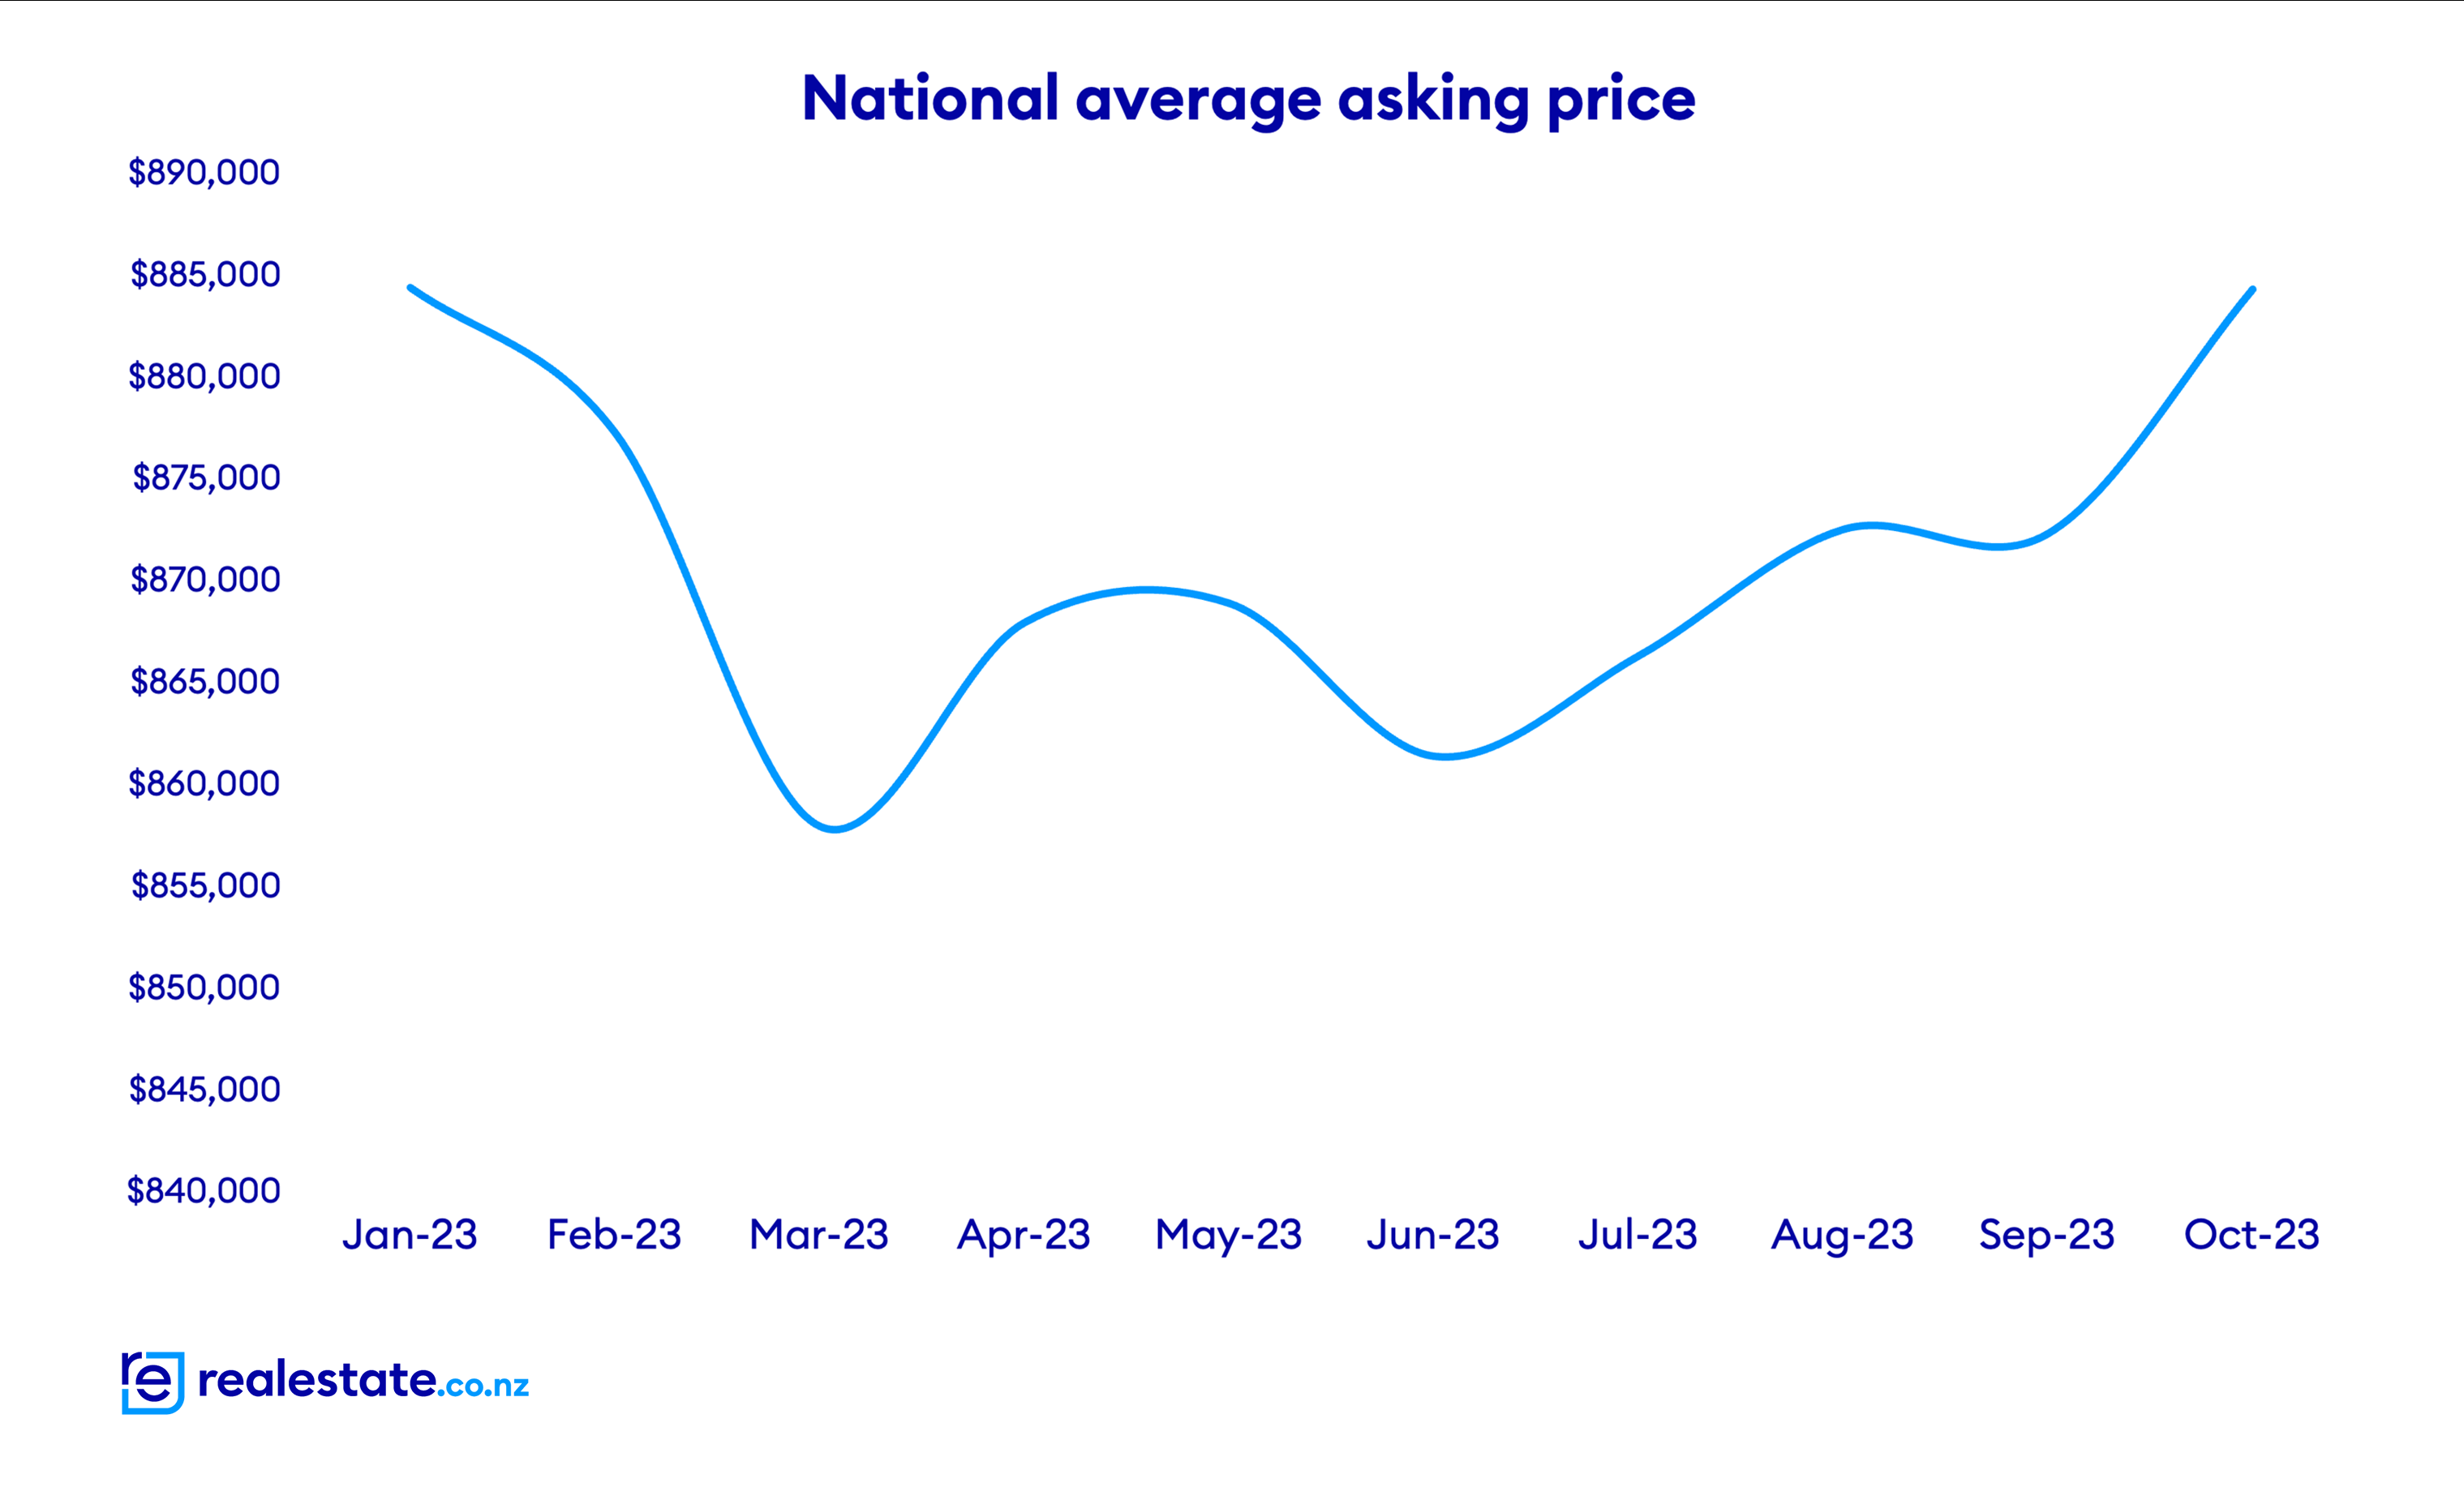
Average asking prices back up to January 2023 levels
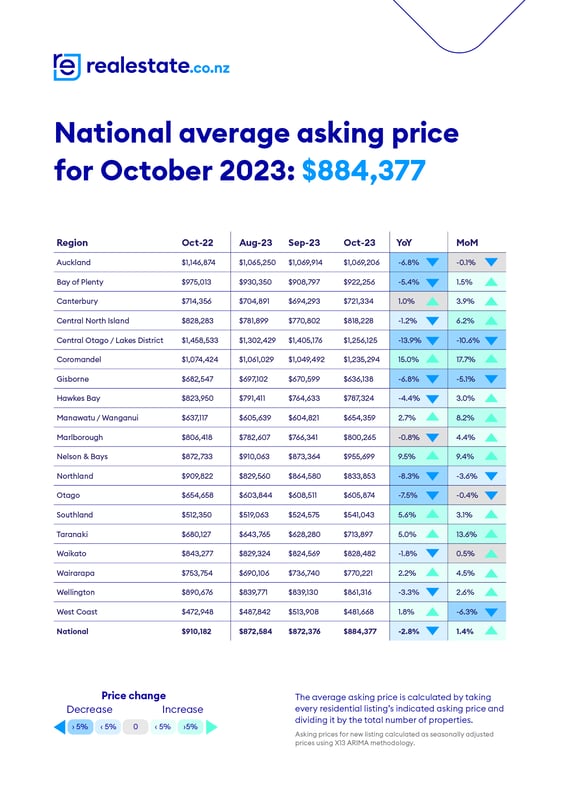
After nine months of softening prices, the national average asking price increased to $884,377, about where it was at the beginning of the year.
“This is the first time the national average asking price has been above $880,000 since January. In 2023, we’ve had a shallow dip followed by what looks like a recovery.”
“We will have to wait a couple more months to see whether this uptick becomes a trend. It’s not unusual to see the market pause during an election,” explains Vanessa.
Our regions have driven the increase to the national average asking price this month.
Seven regions saw positive year-on-year growth to average asking prices - Coromandel (up 15.0%), Nelson & Bays (up 9.5%), Southland (up 5.6%), Taranaki (up 5.0%), Manawatū-Whanganui (up 2.7%), Wairarapa (up 2.2%), and West Coast (up 1.8%). Canterbury remained flat with an increase of 1.0%.
Despite year-on-year growth, West Coast dipped under $500,000 last month. The region hit a 16-year average asking price high in September while still retaining the title of New Zealand’s most affordable region.
New listings up 22.0% on September – more than the average October lift of 16.0%
After a slow start to spring, new listings in October quickly made up ground. New listing numbers typically grow by 16.0% between September and October*.
This year, however, they jumped by 22.0%, bucking the usual spring market trend.
“The influx of new listings is a good indicator of market confidence. Vendors are ready to list – potentially after holding off during a slow market period,” says Vanessa.
Across the country, 12 of 19 regions saw growth in new listings compared to last year. The biggest increases were in Central Otago/Lakes District (up 16.8%), Wairarapa (up 14.4%), Bay of Plenty (up 11.1%), and Hawke’s Bay (up 10.4%).
“With more options becoming available to Kiwi property seekers, the perfect home could be just a search away,” adds Vanessa.
realestate.co.nz is giving away $100,000 for one lucky Kiwi to put towards buying a property. The promotion is open until midnight on 30 November 2023. For full T&Cs and to enter, visit: realestate.co.nz/100k
For media enquiries, please contact:
Hannah Franklin | hannah@realestate.co.nz
Want more property insights?
- Market Insights: Search by suburb to see median sale prices, popular property types and trends over time.
- Sold properties: Switch your search to sold to see the last 12 months of sales and prices.
- Valuations: Get a gauge on property prices by browsing sold residential properties, with latest sale prices and an estimated value in the current market.
Find a glossary of terms here.
^Source: Internal metrics (1 - 30 October 2023 v September 2023 and 1 – 30 October 2022).
*Based on 16 years of data. Excludes 2021, when the uplift was 57.7%. This was an anomaly because many people could not list their homes for sale during parts of the year due to COVID-19 restrictions.
Share
-
.svg)
.svg)
.svg)