November brought brighter weather and a confidence-boosting trifecta of government, economic and OCR certainty.
- New listings lift before Santa touches down
- National average asking prices generally stable
- Demand lifting to meet supply
- National stock flat, year-on-year
The latest data from realestate.co.nz shows that certainty breeds confidence in the property market. During November, vendors returned to the market, demand for property rose to meet supply, and average asking prices remained generally stable.
All of this was in the face of increasing certainty around governmental leadership and the economy. Last month, the Reserve Bank also agreed to maintain the OCR at 5.5% for the fourth consecutive time.
Vanessa Williams, spokesperson for realestate.co.nz, says the trifecta of government, economic and OCR certainty has boosted market sentiment:
“Kiwis love certainty, which is why, with its reputation as a safe investment, we love property. Unsurprisingly, more stability in and out of the market gives people the confidence to buy and sell.”
Selling by auction also remained the most popular sale method last month, making up almost a third (28.2%) of all listings. Vanessa explains that this is a by-product of market certainty:
“People sell under the hammer when they feel confident in the market. And we’ve heard that many sellers had success in auction rooms during November.”
New listings lift before Santa touches down
For the first time since November 2022, more than 10,000 new listings came onto the market last month. An increase of 5.2% year-on-year, this national lift is a combination of seasonal factors and market confidence, says Vanessa.
Year-on-year, more than half of our 19 regions saw new listings increase. The biggest lifts were in Central North Island (up 21.9%), Taranaki (up 13.6%), Nelson and Bays (up 12.1%), and Auckland (up 10.5%).
Month-on-month, new listings were up in all regions except Coromandel (down 16.3%), Marlborough (down 1.5%), and Central Otago/Lakes District (flat with a marginal decrease of 0.9%). Nationally, new listings were up 12.4% compared to October 2023.
“We are in the peak selling season, confidence is up, and vendors are beginning to come back to the market,” says Vanessa.


National average asking prices generally stable
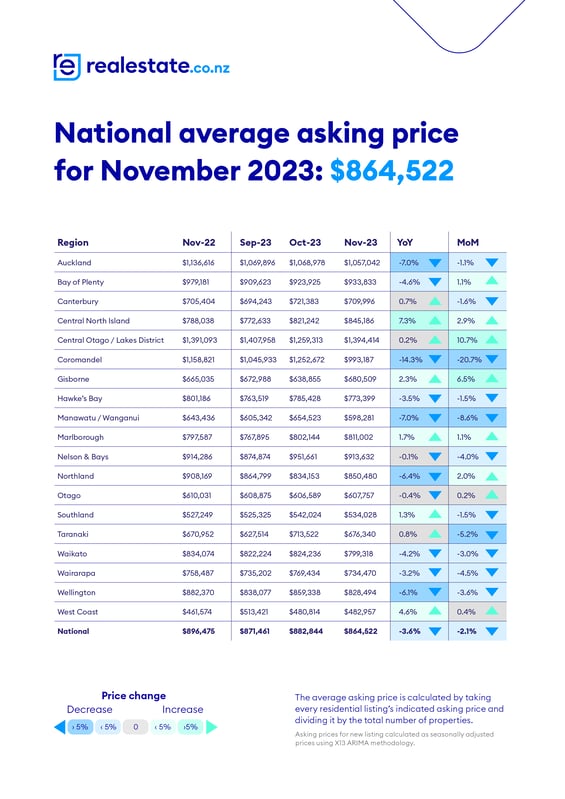
Average asking prices nationally and around the country were generally stable last month.
“We have moved away from the market’s COVID-19 era, distinguished by peaks and troughs. I think it comes down to more confidence and certainty in the market, which we didn’t have during the pandemic.”
Five of our 19 regions saw average asking prices remain flat compared to November 2022. Nationally, all other regions, except Coromandel, saw average asking prices increase or decrease by less than 10.0%.
Summer hotspot Coromandel saw the biggest change to its average asking price. Down 14.3% year-on-year, this is only the second time the region’s average asking price has been below $1 million since August 2021. Month-on-month, the region’s average asking price was down 20.7%. Vanessa explains small markets like Coromandel are susceptible to fluctuations.
Throughout 2023, the national average asking price has remained flat at around $870,000. Vanessa says this is likely to be increasing confidence for buyers and sellers:
“When we see big fluctuations to average asking prices, it can make buyers and sellers hesitant to transact. More stability should help both parties feel more certain around what number to expect on that final sales and purchase agreement.”

Demand lifting to meet supply
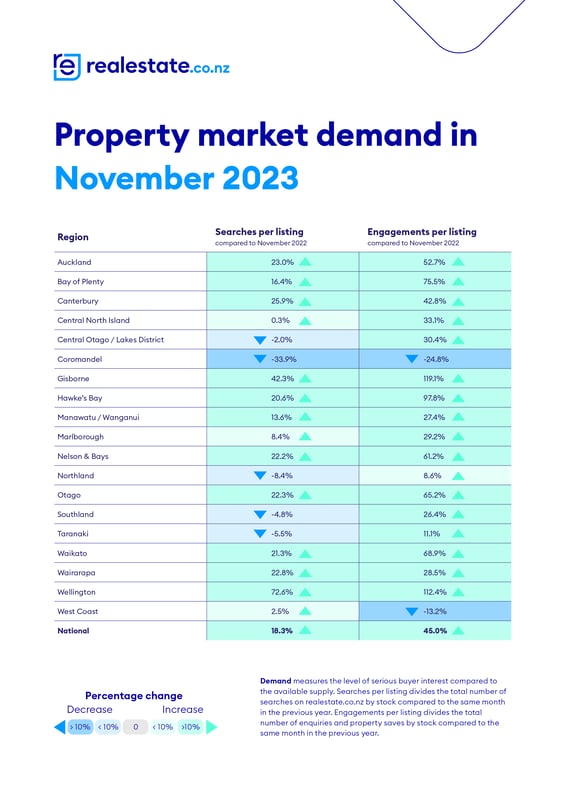
A new dataset from realestate.co.nz shows demand for property was up year-on-year during November, with searches per listing up by 18.3% and engagements per listing up by 45.0%.
Searches per listing divides the total number of searches by total stock. Engagements per listing divides the total number of enquiries and property saves by total stock. Together, both figures indicate the level of demand for property by measuring the level of serious buyer interest compared to the available supply.

“The increase in searches per listing tells us that more people are searching for property. The lift in engagements per listing signals a boost in the number of people actively keen to transact,” says Vanessa.
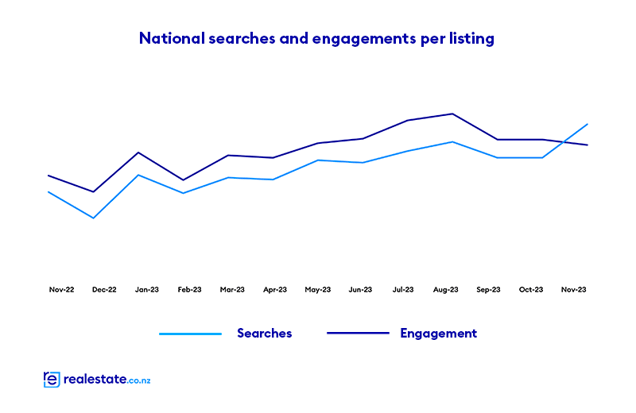
Across the last 12 months, demand for property has been trending upwards, with both searches and engagement per listing up year-on-year.
Vanessa explains it is great to see demand lifting to match supply, adding that stable average asking prices reflect the strong correlation between supply and demand:
“During November, stock and average asking prices remained fairly flat. This tells me that supply and demand were well-matched.”
Generally, when demand outstrips supply, prices increase. Whereas when supply is higher than demand, prices tend to decline.
Last month, Gisborne, Hawke’s Bay, and Wellington saw the biggest increases in demand year-on-year. Searches per listing were up by 42.3% in Gisborne, 20.6% in Hawke’s Bay, and 72.6% in Wellington. Engagements per listing were also up in these regions compared to last year: 119.1% in Gisborne, 97.8% in Hawke’s Bay, and 112.4% in Wellington.
Vanessa says high demand suggests competition is high in these regions.

National stock flat, year-on-year
Year-on-year, stock was flat during November, with a decrease of 1.5% nationally. However, across our regions, it was a mixed bag. Year-on-year, around half of our 19 regions saw stock increase during November, while the other half saw it drop back.
Compared to November 2022, the biggest lifts were in Coromandel (up 37.4%) and Central North Island (up 22.1%). Gisborne and Wellington saw the biggest decreases, down 20.5% and 22.0%, respectively.
“Despite these outliers, we are nationally on par with November 2022 levels,” says Vanessa.
For media enquiries, please contact:
Hannah Franklin | hannah@realestate.co.nz
Want more property insights?
- Market Insights: Search by suburb to see median sale prices, popular property types and trends over time.
- Sold properties: Switch your search to sold to see the last 12 months of sales and prices.
- Valuations: Get a gauge on property prices by browsing sold residential properties, with latest sale prices and an estimated value in the current market.
Find a glossary of terms here.
01 Dec 2023

