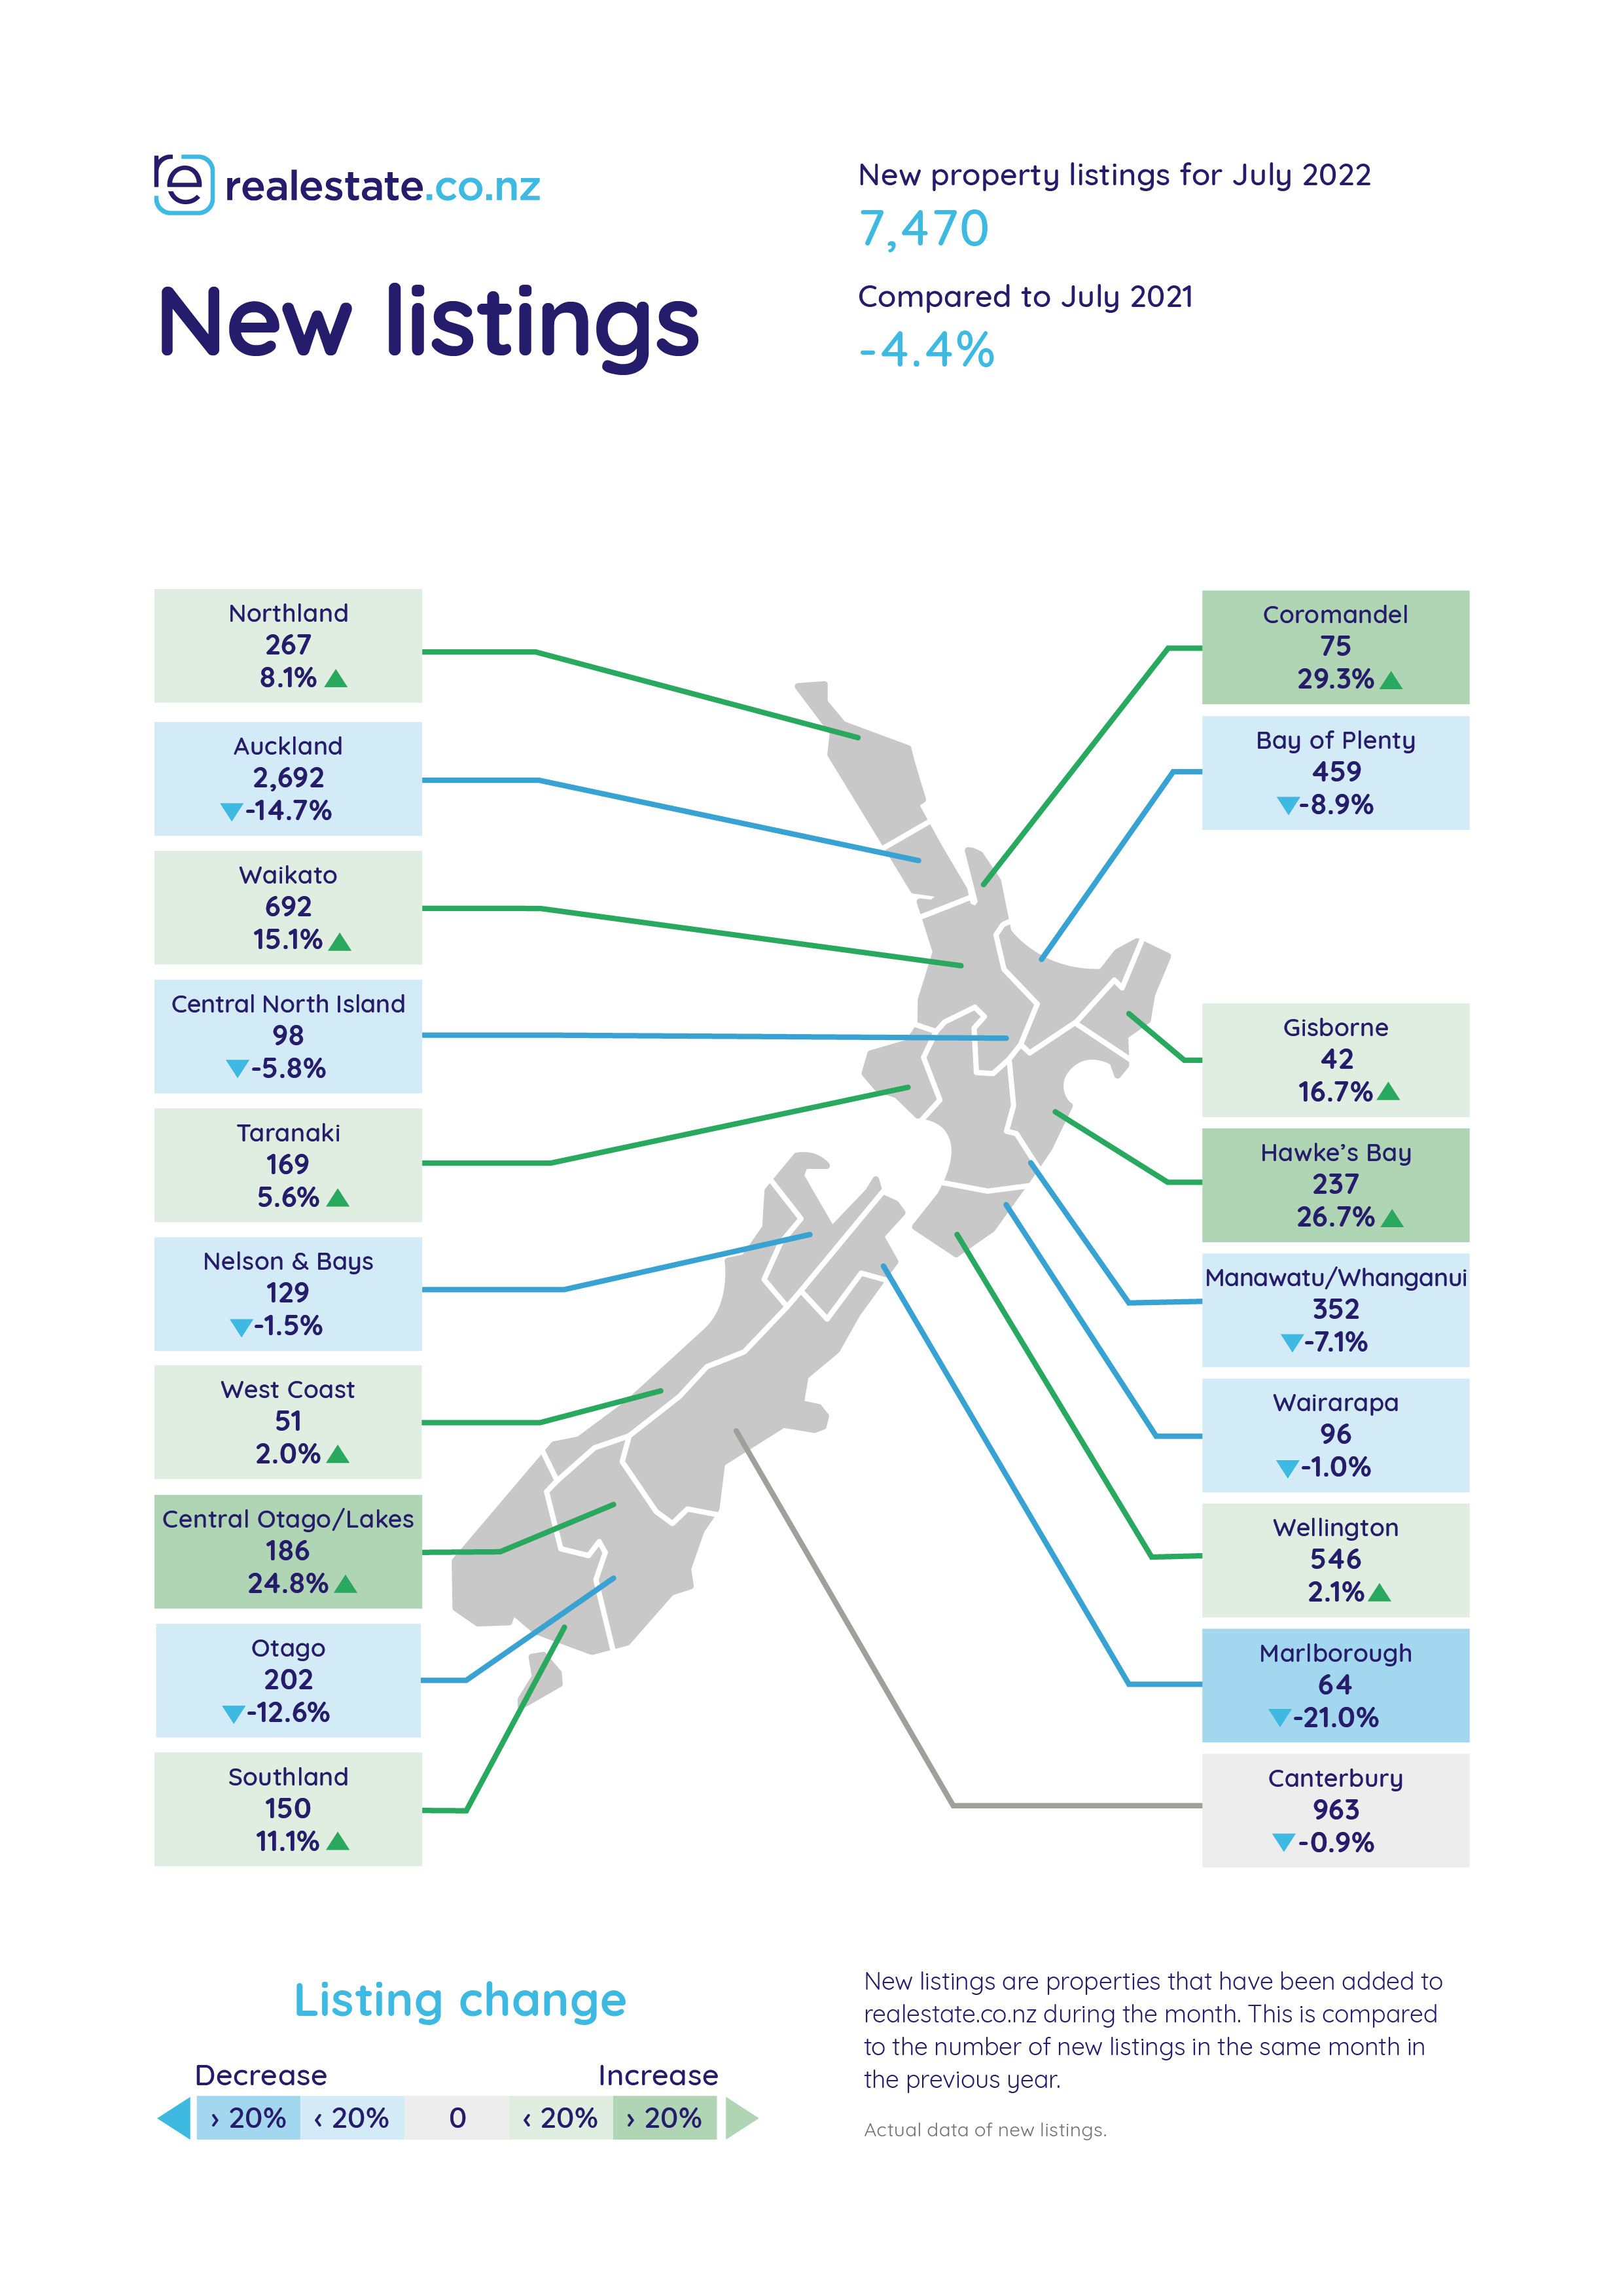
The latest data from realestate.co.nz suggests the New Zealand property market has settled into a new, more stabilised normal, resulting in bona fide buyers’ markets in Wellington, Auckland, Hawke’s Bay, and Gisborne. While Otago, Waikato, Manawatu / Wanganui, Nelson and Bays, and the Bay of Plenty show signs of tipping.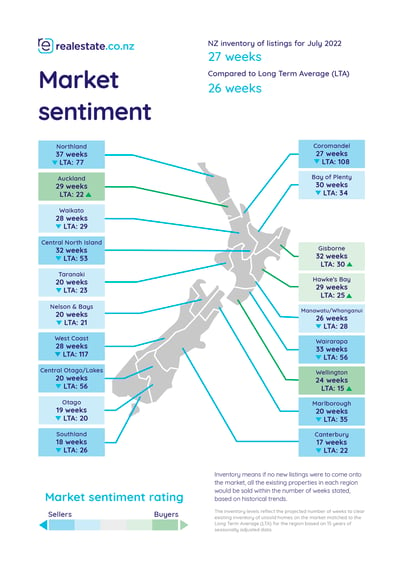
Vanessa Williams, spokesperson for realestate.co.nz, explains:
“Several factors, including total housing stock, new listings, and the current sales rate, contribute to market sentiment. In recent years we’ve experienced high demand and a lack of housing supply, driving prices up and putting the power in the hands of the seller,” said Vanessa.
“But the market has started to shift. We’ve seen a record number of consents from councils to build new homes and buyer FOMO (fear of missing out) decreasing. The scales have tipped; buyers now have the edge.”
But Vanessa suggests that, while the market has changed, it’s merely flattening—there are no signs of a “bubble burst” on the horizon.
“Because the market surprised us in 2020 and 2021 with record low stock and record high asking prices, perhaps we’re expecting the surprises to keep coming. For instance, some reports are suggesting the market is swinging from extreme to extreme. But our data does not reflect that,” said Vanessa.
Total housing stock more than doubles in 11 regions year-on-year while others follow closely
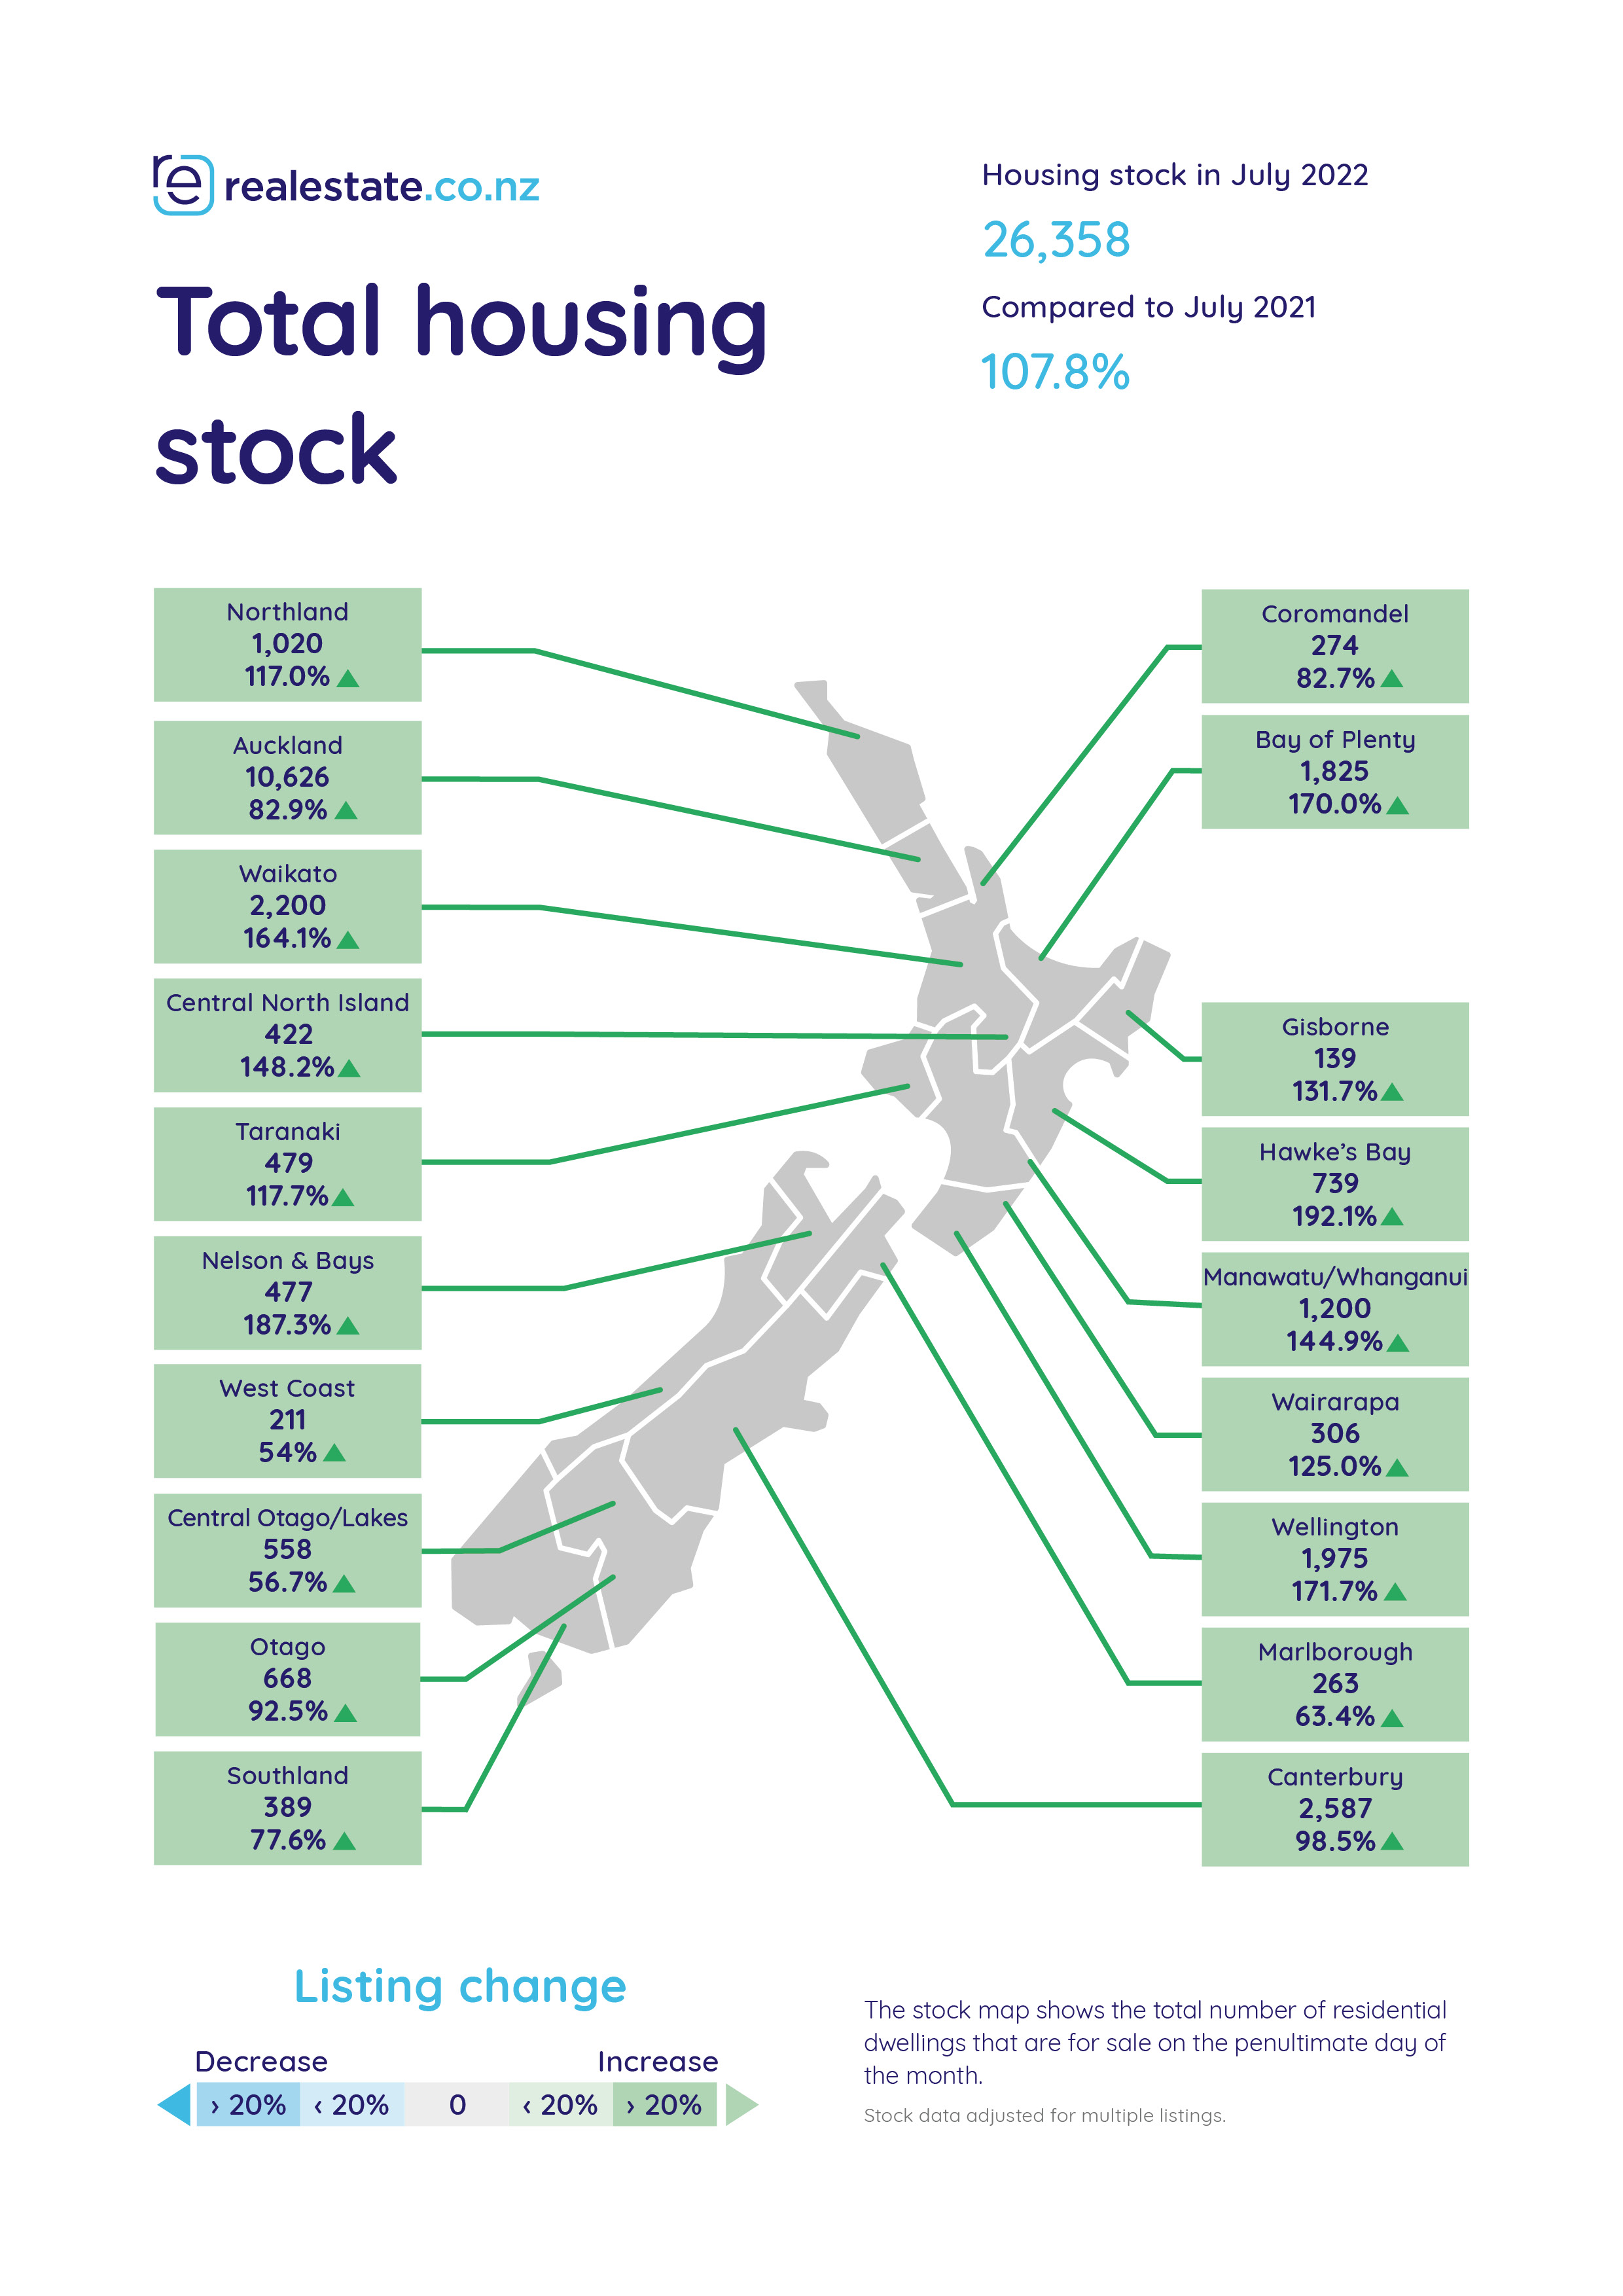
The number of homes available for Kiwis to buy has been steadily increasing since mid-2021—from 12,684 at the end of July last year to 26,358 at the end of July this year.
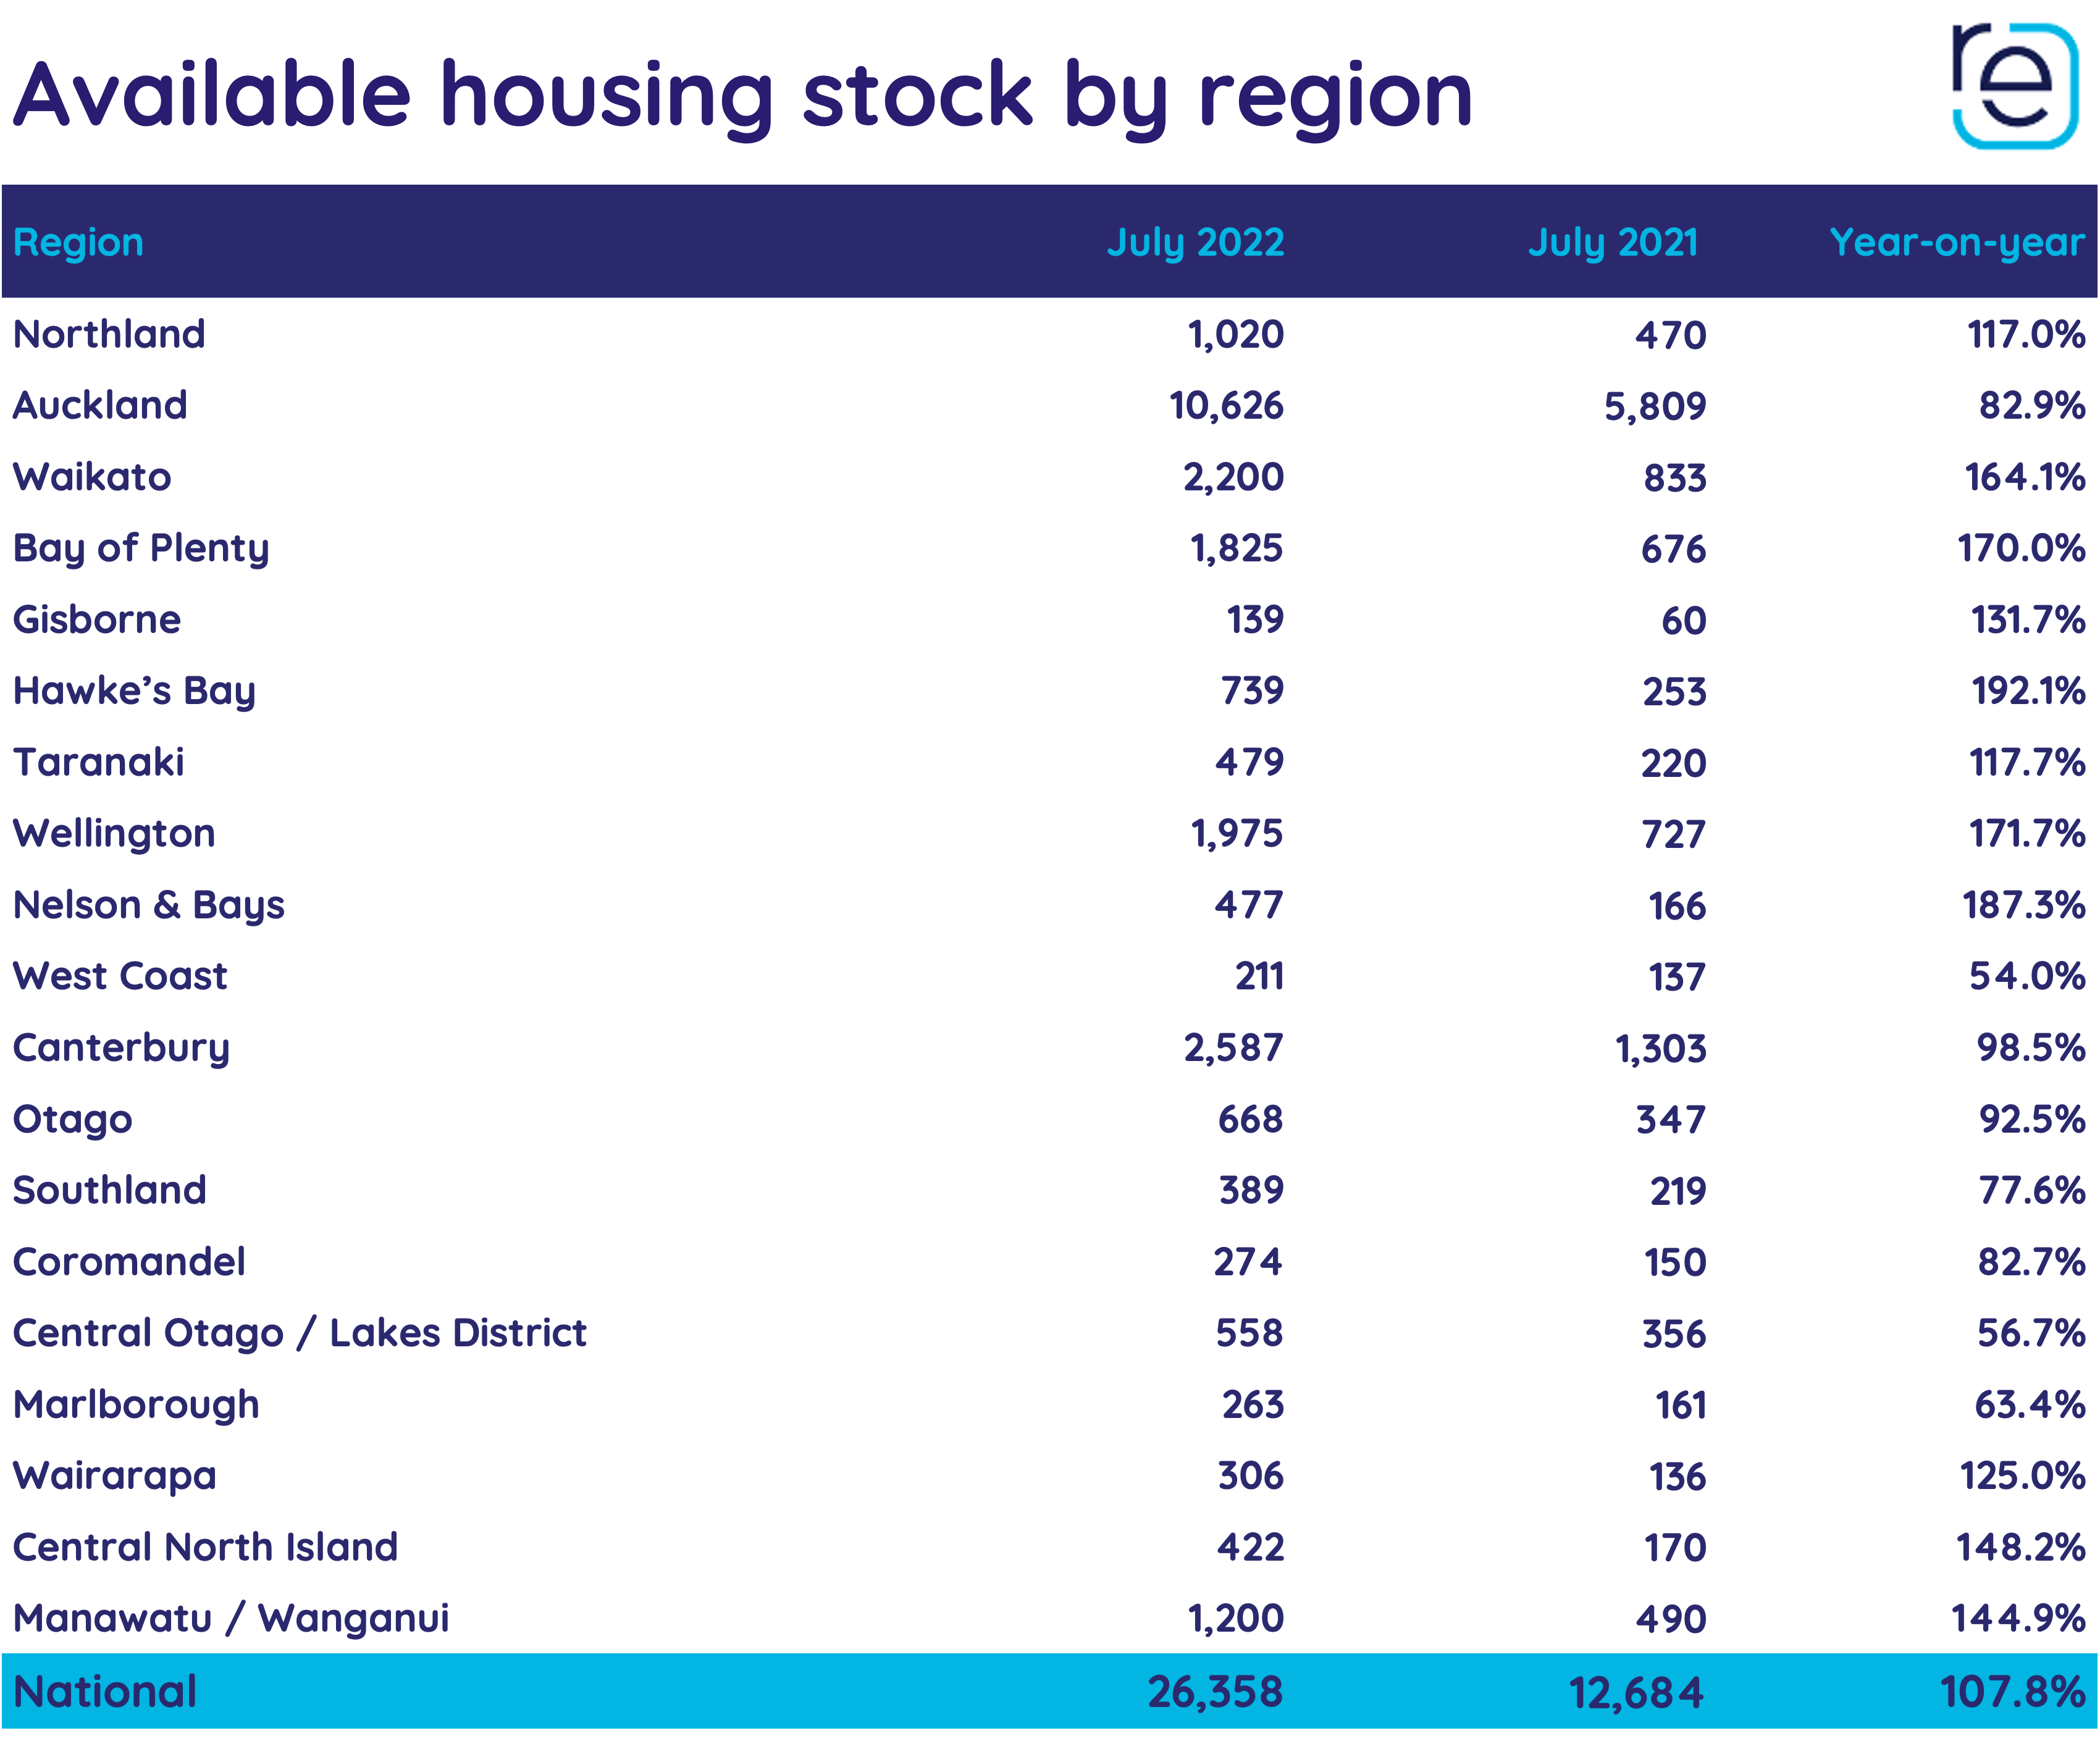
Eleven regions more than doubled their total stock year-on-year in July, including Hawke’s Bay (up 192.1%), Nelson and Bays (up 187.3%), Wellington (up 171.7%), the Bay of Plenty (up 170.0%), Waikato (up 164.1%), Central North Island (up 148.2%), Manawatu/Wanganui (up 144.9%), Wairarapa (up 125.0%) and Northland (up 117.0%)
These stock increases are in stark contrast to the record lows Kiwis witnessed only a year ago.
“Throughout 2021, we saw record-low housing stock month after month, which would have created challenges for buyers and increased urgency in the market,” said Vanessa.
“But for the last few months, New Zealand has experienced housing stock levels not seen since 2019. This has created a stable and less urgent environment for buyers—giving them time to think about their purchase, their offer, and arranging the necessary inspections.”
What’s happening with asking prices?
The national average asking price is now $942,961—up 4.2% compared to July 2021, allowing for seasonal adjustment. This number has been steadily cooling since January this year when we reported a $1 million national average asking price for the first time.
Month-on-month, New Zealand’s regions saw their prices remain relatively stable. The only outlier was the Coromandel, which hit a 15-year record high average asking price of $1,317,265. 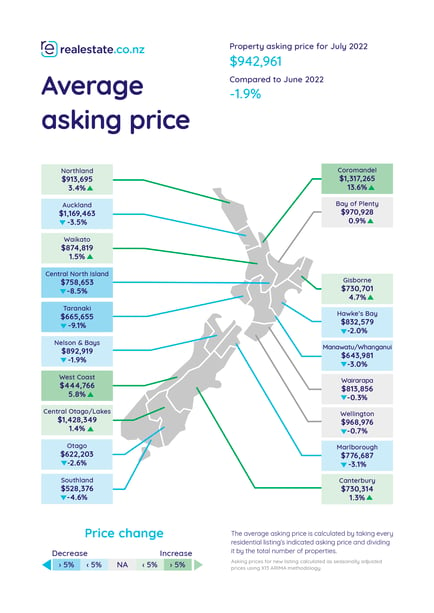
“While the rest of the country saw cooling or stable prices, the Coromandel hit a 15-year record high, overtaking Auckland as the second most expensive place to purchase property. Central Otago/Lakes District still holds the number one spot at $1,428,349,” said Vanessa.
But with buyers’ markets nationally, in two major centres, and in two regions, along with reports of a cooling market, some may wonder why average asking prices are only shifting gently. The answer? Demand.
“Although housing stock is rising and buyers are choosing more carefully, the fact remains—plenty of Kiwis are in the market, ready to purchase a home. It is a Kiwi dream.
“So, although sellers may need to adjust their sales strategy to meet the changing market, in most cases, if you market your property well, buyers will be ready and waiting to make an offer.
For media enquiries, please contact:
Ashley Harder | 021 712 210 | ashley@realestate.co.nz
About realestate.co.nz
As the longest-standing provider of real estate data in real-time, realestate.co.nz offers valuable property market information not available from other sources to make it easier for New Zealanders to buy and sell property.
Glossary of terms:
Average asking price (AAP) is neither a valuation nor the sale price. It is an indication of current market sentiment. Statistically, asking prices tend to correlate closely with the sales prices recorded in future months when those properties are sold. As it looks at different data, average asking prices may differ from recorded sales data released simultaneously.
New listings are a record of all the new residential dwellings listed for sale on realestate.co.nz for the relevant calendar month. The site reflects 97% of all properties listed through licensed real estate agents and major developers in New Zealand. This description gives a representative view of the New Zealand property market.
Seasonal adjustment is a method realestate.co.nz uses to represent better the core underlying trend of the property market in New Zealand. This is done using methodology from the New Zealand Institute of Economic Research.
Truncated mean is the method realestate.co.nz uses to supply statistically relevant asking prices. The top and bottom 10% of listings in each area are removed before the average is calculated to prevent exceptional listings from providing false impressions.
Stock is the total number of residential dwellings for sale on realestate.co.nz on the penultimate day of the month.
31 Jul 2022


