
.svg)


Following hints of a cooling market in February 2022, real-time data from realestate.co.nz shows that Wellington became a buyers’ market in March 2022, while Auckland might soon follow our trendsetting capital.
Vanessa Williams, spokesperson for realestate.co.nz, says that the data highlighted some potential market shifts last month.
“Inventory data shows that properties in Wellington are taking longer to sell than they have, on average, over the last 15 years. And the rate of sale also appears to have slowed in Auckland last month.”
“This could signal a future market shift led by our main centres. However, with year-on-year average asking prices still strong around the country, we will have to wait a little longer before we can confirm any trends,” says Vanessa.
Year-on-year, total stock levels were up 32.0% nationally, and in most regions during March. This is a telling sign there are more properties on the market for buyers to pursue.
However, new listings added to the property site during the month of March were down in 10 of our 19 regions compared to the previous year. The data suggests that less vendors decided to list when compared with March 2021, perhaps in the face of COVID-19 and inflation uncertainty.
“Despite a drop in the number of new listings last month, demand didn’t dwindle. Latest user data shows that a record number of Kiwis browsed for property on realestate.co.nz during March with 45 – 54-year-olds the most active property seekers on the site,” says Vanessa.
Buyers’ market for Wellington – properties taking longer to sell than they have on average for the last 15 years
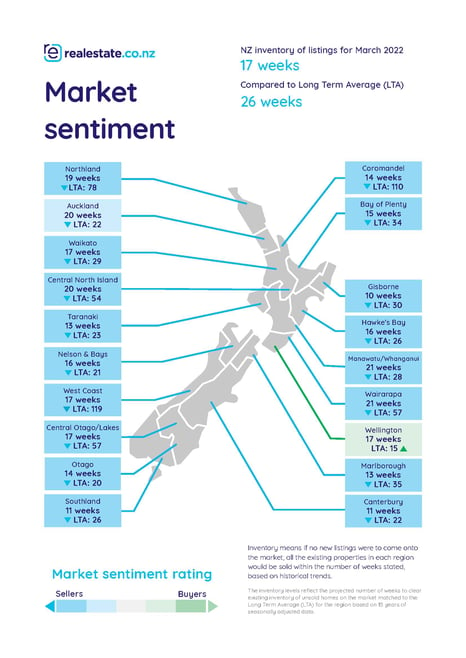
Inventory data from realestate.co.nz shows a buyers' market emerged in Wellington in March 2022. Inventory measures theoretically how long it would take to sell all current stock at the current rate of sale if no new listings came on to the market.
“Inventory data indicates the turnover in the market. So, when inventory is higher than the 15-year long-term average, it tells us that there is more stock than people buying property,” says Vanessa.
Theoretically, if no new listings came onto the market in the Wellington region and all existing stock was sold, there would be no houses available to buy in 17 weeks which is longer than the long-term average (of 15 weeks).
“According to our seasonally adjusted data, the last time Wellington was a buyers’ market was almost 8 years ago in June 2014,” says Vanessa.
Vanessa cautions that it is important to distinguish between what the data considers a buyers' market and what most people understand the term to mean.
“I think most people assume that a buyers' market means that purchasers hold most of the power in a negotiation. However, when it comes to the data, we are talking about how quickly properties are selling.”
“It is a good indication of where the market is heading, with a slowdown in sales typically being good news for buyers. But we shouldn’t lose sight that the average asking price in the region is still over $1million – up 16.9% on the same month last year,” says Vanessa.
She adds that demand in the Wellington region remained high last month, with Waikanae, Karori, Eastbourne, Wellington Central and Otaki the top suburbs searched by users.
Auckland inventory shift could also indicate that a buyers' market is on the way for the city of sails.
Meanwhile, a shift in turnover rates in Auckland could signal that a buyers' market is on the way. Last month we saw the gap close between the current sales rate of 20 weeks and the long-term average of 22 weeks to ‘sell out’ all homes on the market.
“We haven’t seen a buyers' market in Auckland since June 2020, so this is something to watch over the next few months.”
"Typically, we see our main centres leading the rest of the country with property trends, so if the city of sails follows Wellington’s lead, we might be in for a fascinating 2022,” says Vanessa.
 Average asking prices around the country are a mixed bag
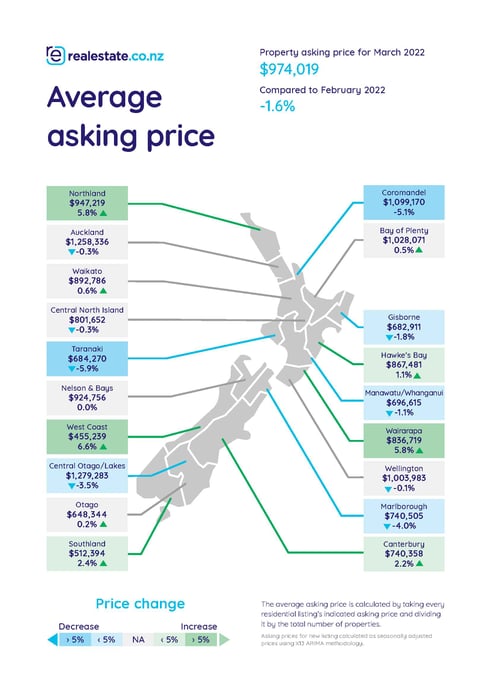
Average asking prices hit all-time highs in five of our 19 regions last month, with Northland, Bay of Plenty and Canterbury reaching record highs for the second month in a row.
Nationally, average asking prices were up 16.0% year-on-year, with the asking price at $974,019 in March 2022. However, this is around $25,000 down from our record high in January this year.
Following on from the hint of a cooling market in February 2022, six regions saw their prices drop while another seven saw them remain static compared to the previous month.
“Rising property prices have been a big topic over the last few years; these drops might be encouraging for buyers.”
However, she warns that with average asking prices still up year-on-year in all regions, it is too early to know just what these dips mean for the long term.
The six regions where average asking prices have dipped month on month are Gisborne (down -1.8% to $682.911), Taranaki (down -5.9% to $684,270), Central Otago/Lakes District (down -3.5% to $1,279,283), Marlborough (down -4.0% to $740,505), Manawatu/Whanganui (down -1.1% to $696,615) and, for the second consecutive month, Coromandel (down -5.1% to $1,099,170).
Total homes available for sale up at levels not seen since 2019
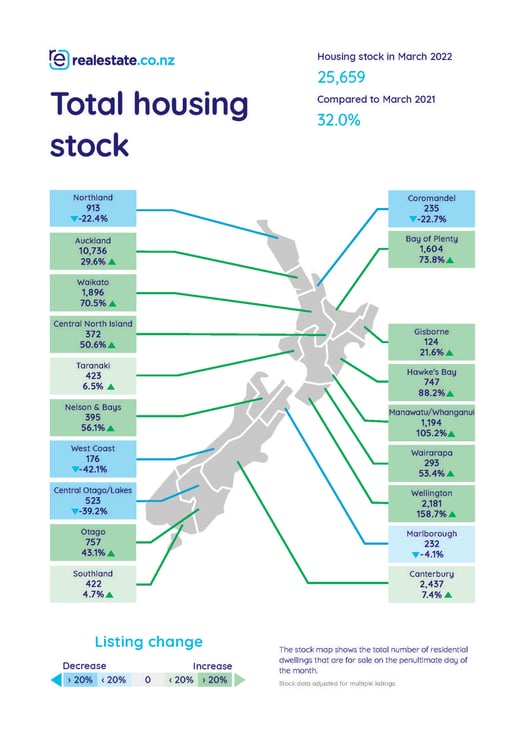
For the first time since May 2019, more than 25,000 homes were available for purchase nationally last month – an increase of 32.0% compared to the same month in 2021. 14 of New Zealand’s 19 regions also saw significant rises to year-on-year stock levels in March 2022.
Offering the most choice for buyers, when compared to March 2021, was Wellington with 2,181 total homes available for sale (up 158.7%), Manawatu/Whanganui with 1,194 total homes available for sale (up 105.2%), and Hawke’s Bay with 747 total homes available for sale (up 88.2%).
Data from realestate.co.nz shows that stock levels have consistently been low over the last few years. Vanessa says that reduced supply and high demand typically drives prices up, so it is intriguing to see this moving in a new direction.
“It is unsurprising that Wellington’s stock more than doubled compared to the same month last year.”
“This is partly why the region tipped into a buyers' market last month,” says Vanessa.
New listings down in the majority of regions
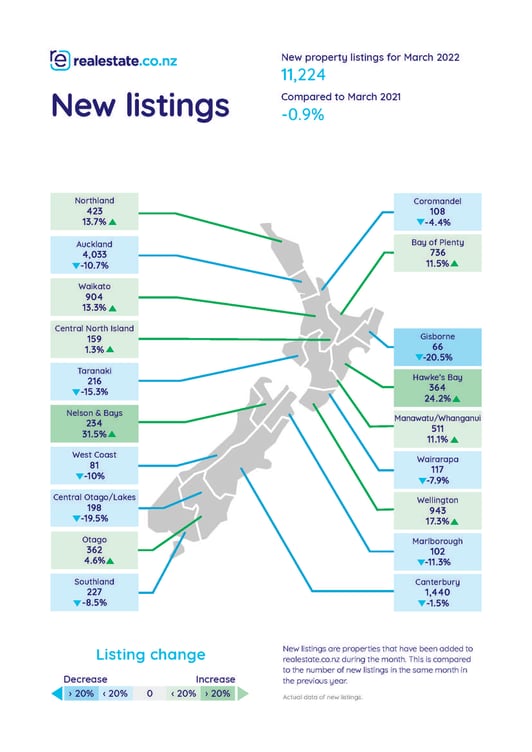
As the weather has started to cool, vendors too might have gone off the boil. The number of new listings coming onto the market during March was down in 10 of our 19 regions compared to March 2021.
Year-on-year, new listings were down -10.7% in Auckland, -20.5% in Gisborne, -15.3% in Taranaki, -10.0% in the West Coast, -1.5% in Canterbury, -8.5% in Southland, -4.4% in Coromandel, -19.5% in Central Otago/Lakes, -11.3% in Marlborough, and -7.9% in Wairarapa.
“We usually see a drop off in new listings post-summer, but with new listings lower than last year, the uncertainty around things like Omicron and inflation might be encouraging Kiwis to stay put instead of listing their home for sale,” says Vanessa.
Bucking the trend with the most significant year-on-year increases were sun-drenched hot spots Nelson & Bays and Hawke’s Bay, where new listings were up 31.5% and 24.2%, respectively.
For media enquiries, please contact:
Ashley Harder | 021 712 210 | ashley@realestate.co.nz
About realestate.co.nz
As the longest-standing provider of real estate data in real-time, realestate.co.nz offers valuable property market information not available from other sources to make it easier for New Zealanders to buy and sell property. With residential, lifestyle, rural and commercial property listings available, realestate.co.nz is the place where serious buyers look for property.
Glossary of terms:
- Average asking price (AAP) is neither a valuation nor the sale price. It is an indication of current market sentiment. Statistically, asking prices tend to correlate closely with the sales prices recorded in future months when those properties are sold. As it looks at different data, average asking prices may differ from recorded sales data released at the same time.
- New listings are a record of all the new residential dwellings listed for sale on realestate.co.nz for the relevant calendar month. As the site reflects 97% of all properties listed through licensed real estate agents in New Zealand, this gives a representative view of the New Zealand property market.
- Stock is the total number of residential dwellings that are for sale on realestate.co.nz on the penultimate day of the month.
- Inventory is a measure of how long it would take, theoretically, to sell the current stock at current average rates of sale if no new properties were to be listed for sale. It provides a measure of the rate of turnover in the market.
- Seasonal adjustment is a method realestate.co.nz uses to better represent the core underlying trend of the property market in New Zealand. This is done using methodology from the New Zealand Institute of Economic Research.
- Truncated mean is the method realestate.co.nz uses to supply statistically relevant asking prices. The top and bottom 10% of listings in each area are removed before the average is calculated, to prevent exceptional listings from providing false impressions.
Share
-
.svg)
.svg)
.svg)