
.svg)


Lore tells us that a property's value doubles every 10 years, but whether this is true depends on where you live. New data from realestate.co.nz shows that more than half of New Zealand's 76 districts saw annual average asking prices more than double in the 10 years between 2013 and 2022. For those districts where annual average asking prices did not double, most saw an increase of around 50% or higher.
The biggest increases to annual average asking prices in the last decade were in Kawerau (up 293.9% to $494,172), Horowhenua (up 169.2% to $701,884), Northland's Kaipara (up 165.5% to $1,075,074), Rangitikei (up 162.6% to $580,463), and South Wairarapa (up 162.0% to $1,033,348) 1.
Sarah Wood, CEO of realestate.co.nz, says the data shows that property values increase long-term:
"Across the board, annual average asking prices have increased in all parts of New Zealand in the last decade, which I think is important to remember amid the fall we have seen to prices over the last 12 months."
"Peaks and troughs are normal. But this data tells us that we are unlikely to see average asking prices trend downwards in the long run, so those who are seeing a dip in their area shouldn't lose hope," she adds.
Auckland: popularity soars in the 'Hamptons of New Zealand'
Asking prices have climbed steadily in Auckland's districts over the last decade, with wine lovers’ Waiheke seeing the largest increase in annual average asking prices since 2013. Up 107.7% to $2,304,037, the island has become a haven for the wealthy from New Zealand and abroad.
"Known as the 'Hamptons of New Zealand,' Waiheke has soared in popularity as a tourist destination over the last decade. Average asking prices on the island have always sat above those in other areas of the Auckland region, but this gap appears to be growing," says Wood.
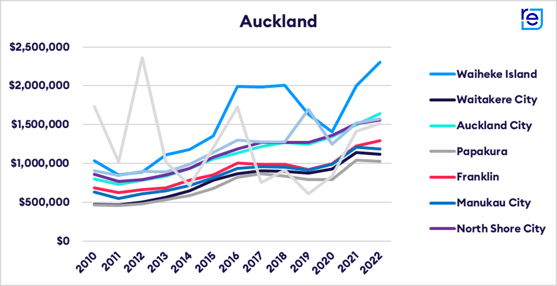
Other notable annual average asking price increases since 2013 include Waitakere City (up 98.3% to $1,121,988), , Papakura (up 94.1% to $1,028,858) and Auckland City (up 84.8% to $1,545,953).
Wood says that annual average asking prices in all areas of Auckland are above $1 million, but commuter hotspots might offer buyers the best bang for their buck.
"In Waitakere, Papakura and Manukau City, annual average asking prices are around half a million less than Auckland City."
"Not only do these districts likely offer more affordable options, but if we take the last 10 years of data as an indication, annual average asking prices will likely continue to grow," says Wood.
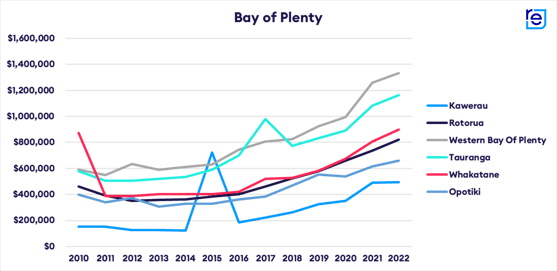
Bay of Plenty top of the table: annual average asking price almost four times higher in Kawerau than in 2013
Over the last decade, average asking prices have steadily risen in the Bay of Plenty. The region's districts all saw annual average asking prices more than double since 2013, while mill town, Kawerau, saw its annual average asking price almost quadruple.
Kawerau remains a more affordable option than other parts of the Bay of Plenty. However, the town has experienced significant peaks and troughs over the last 13 years.
"Between 2010 and 2014, average asking prices in Kawerau went backwards following the recession. But from 2015 onwards, we saw them start to climb quite steadily."
"It will be interesting to see what happens in the district given our current economic climate. Kawerau's annual average asking price actually stayed flat between 2021 and 2022, so it could be that the district is already seeing the impacts of a downturn," says Wood.
The districts with the highest annual average asking prices in the Bay of Plenty region were Western Bay of Plenty and Tauranga which both sat above $1 million in 2022.
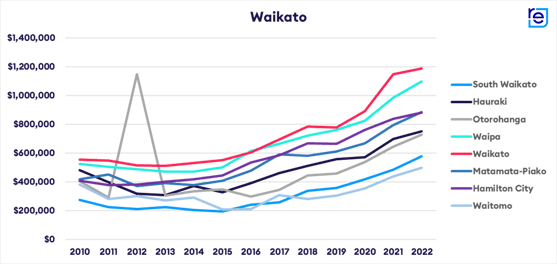
Waikato: prices go up down south
With an increase of 157.0%, annual average asking prices in South Waikato grew more than any other district in the Waikato region compared to 2013. This was followed by the Hauraki district, which experienced 142.9% growth in its annual average asking price in 2022 compared to 2013.
"Growth has been steady in most districts throughout the Waikato in the last decade. Seeing this growth to annual average asking prices outside the main centre of Hamilton reflects the labour market in the region, dominated by industries like manufacturing and agriculture."
"It is quite different to the Auckland region where we see the highest annual average asking prices in Auckland City because that is where most people live and work," says Wood.
Compared to 2013, annual average asking prices increased by 138.3% in Otorohanga, 133.6% in Waipa, 132.6% in Waikato, 125.8% in Matamata-Piako, 120.4% in Hamilton City, and 84.6% in Waitomo.
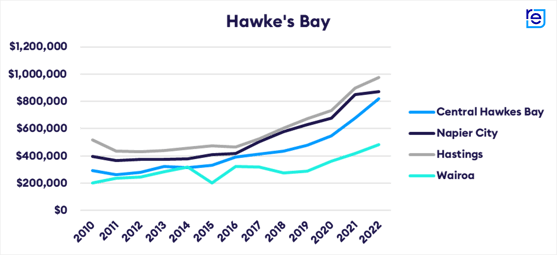
Hawke's Bay: the gap between regional and national annual average prices shrinks
Annual average asking prices in the Hawke’s Bay have grown steadily since 2013. Central Hawke's Bay saw the biggest increase in its annual average asking price, up 154.2% in 10 years. Napier City and Hastings also significantly increased 132.6% and 122.6%, respectively.
"Looking at all of Hawke's Bay's districts, the gap between average asking prices in the region and the national average asking price has shrunk over the last 10 years."
"In 2013, the annual average asking price in Napier City was $375,450, 19.3% below the national average of $447,947. In 2022, however, the annual average asking price for Napier City was just 4.4% less than the national average of $911,455," says Wood.
Wairoa was the only district in the Hawke's Bay where the annual average asking price hasn't doubled since 2013, with average asking prices growing by 69.4% in the last 10 years to $480,671.
Wellington: all districts see significant price rises compared to 10 years ago
Compared to 2013, average asking prices were up across the board in all Wellington districts last year. The Kapiti Coast saw the biggest lift for the region over 10 years (up 121.2% to $969,985). This was followed by Upper Hutt City and Lower Hutt City, where prices increased by 112.6% and 111.5%, respectively.
"Annual average asking prices in all districts in the Wellington region now sit closer to $900,000, compared to around $400,000 just 10 years ago," says Wood.
However, year-on-year, the increases are less marked. Kapiti, Upper Hutt City and Lower Hutt City saw annual average asking prices decrease in 2022 compared to 2021. Down 1.5%, 5.3%, and 1.5%, respectively; these decreases likely reflect the slowdown in the market during 2022.
"Wellington was in a buyer's market for nine months of 2022, and this easing of demand also saw prices ease in response," says Wood. 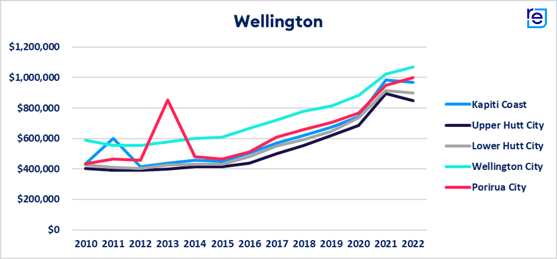
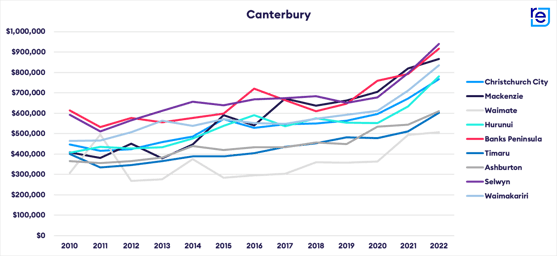
Canterbury: Steady growth but prices still modest compared to Auckland
While perhaps not the biggest growth area in the country, the Canterbury region has had steady growth to annual average asking prices since 2013. The largest increase since 2013 was in Mackenzie, where annual average asking prices grew 128.2% to $867,214 in a decade1.
Waimate and Hurunui also saw strong growth compared to 10 years ago, up 83.7% and 80.2%, respectively.
"The impact of the Canterbury earthquakes can still be seen in the region. The rebuild efforts led to an oversupply of homes in Canterbury, which has impacted average asking prices as supply has exceeded demand."
"Interestingly, average asking prices in our second largest city of Christchurch generally sit well below those in Auckland," says Wood.
In 2022, the annual average asking price in Christchurch City was $767,108 compared to $1,545,953 in Auckland City.
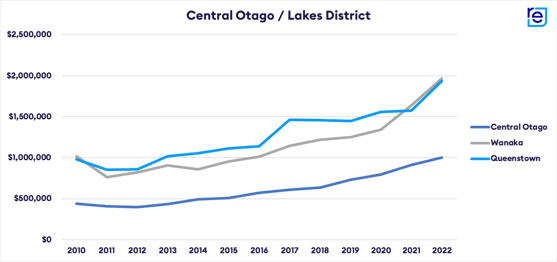
Central Otago/Lakes: annual average asking prices top central city prices
With some of the most luxurious listings in the country, the Central Otago/Lakes region has seen average asking prices lift considerably in the last 10 years. For example, central Otago and Wanaka more than doubled their annual average asking prices, increasing 130.0% and 117.0%, respectively. While long-time holiday hotspot Queenstown saw annual average asking prices jump by 90% since 2013.
"These districts often have higher average asking prices than our main centres. This differs from most overseas markets where the highest prices are usually in or near main commercial hubs,” says Wood.
The annual average asking price in Wanaka for 2022 was $1,966,673, which is $323,472 more than Auckland City.
.png?width=557&height=1686&name=Annual%20Average%20Asking%20Price%20(10%20years%202013%20to%202022).png)
*This figure appears to be an anomaly and may be due to outlying high or low average asking prices on listings during a given year. This data set has not been truncated.
Check out our Market Insights tool to see if your suburb has doubled.
For media enquiries, please contact:
Hannah Franklin | hannah@realestate.co.nz
About realestate.co.nz
As New Zealand’s longest-standing property website, realestate.co.nz’s mission is to empower New Zealanders with a property search tool they can use to find the life they want to live. With residential, lifestyle, rural and commercial property listings, realestate.co.nz is the place to start for those looking to buy or sell property.
Whatever life you’re searching for, it all starts here.
Glossary of terms:
Average asking price (AAP) is neither a valuation nor the sale price. It is an indication of current market sentiment. Statistically, asking prices tend to correlate closely with the sales prices recorded in future months when those properties are sold. As it looks at different data, average asking prices may differ from recorded sales data released simultaneously.
New listings are a record of all the new residential dwellings listed for sale on realestate.co.nz for the relevant calendar month. The site reflects 97% of all properties listed through licensed real estate agents and major developers in New Zealand. This description gives a representative view of the New Zealand property market.
Stock is the total number of residential dwellings that are for sale on realestate.co.nz on the penultimate day of the month.
Inventory is a measure of how long it would take, theoretically, to sell the current stock at current average rates of sale if no new properties were to be listed for sale. It provides a measure of the rate of turnover in the market.
Seasonal adjustment is a method realestate.co.nz uses to represent better the core underlying trend of the property market in New Zealand. This is done using methodology from the New Zealand Institute of Economic Research.
Truncated mean is the method realestate.co.nz uses to supply statistically relevant asking prices. The top and bottom 10% of listings in each area are removed before the average is calculated to prevent exceptional listings from providing false impressions.
Share
-
.svg)
.svg)
.svg)