
.svg)


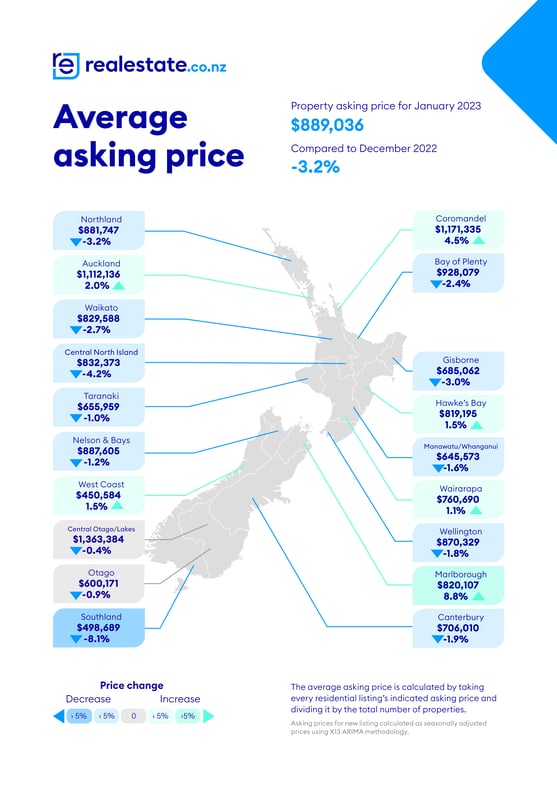
After peaking at close to $1 million in January 2022, the national average asking price fell below $900,000 last month, according to the latest data by realestate.co.nz. Sitting at $889,036, down more than $100,000 compared to January last year, this reflects the current state of the market.
“I am asked every other day when prices will stop falling. But in 2021, everyone wanted to know when they would stop rising. This speaks to the cyclical nature of the New Zealand property market,” says Vanessa Williams, spokesperson for realestate.co.nz.
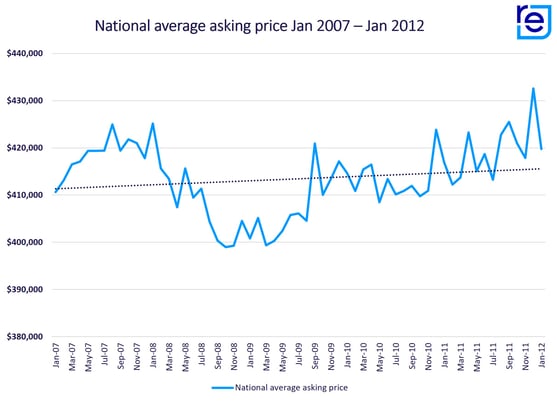
She explains that we are currently in an intense cycle due to significant economic factors. But notes that the long-term data shows prices have consistently trended upwards even during tough times like the global recession in 2008:
“After peaking in January 2008, average asking prices dropped 6% to $400,816 in January 2009. But it wasn’t long before average asking prices rose again.”
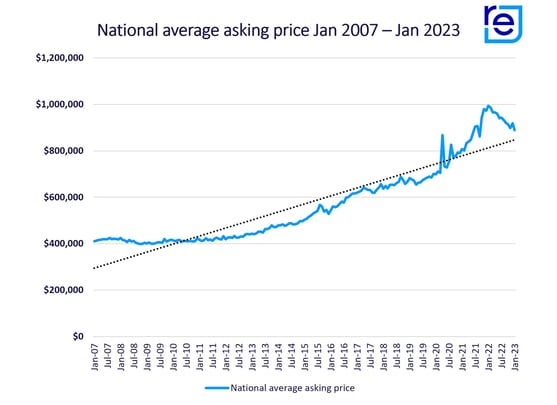
She adds that even with the price decreases of the last 12 months, the national average asking price in January 2023 is still around double what it was 10 years prior in 2013.
“Property is a long-term investment. Without diminishing the struggles, Kiwis faced during the global financial crisis, if you look at average asking prices over ten or fifteen years, the 2008 recession hasn’t affected the overall steady rise in house prices.”
“This is useful context. History tells us that we will see peaks and troughs, but prices trend upwards in the long term,” says Vanessa.
Vanessa recommends buying not based on the market but on your circumstances and ability to service a loan:
“We can only look at what has happened in the market, and nobody can predict the future.”
Property listings staying online for 25.0% longer
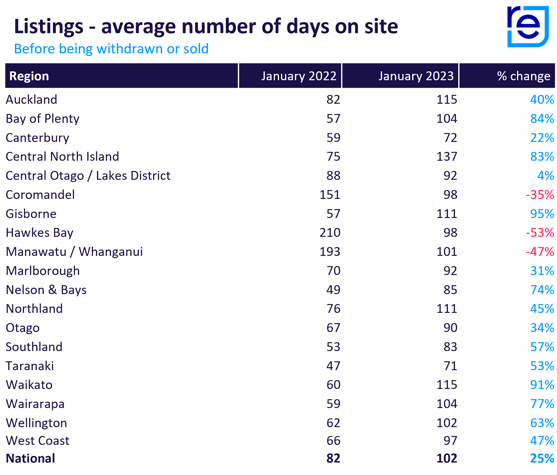
Nationally, residential listings stayed online at realestate.co.nz 25.0% longer last month than in January 2022. The data, which averages the number of days a listing was live on realestate.co.nz before being sold or withdrawn from the market, suggests vendors had to be more patient and adjust to a slower market last month.
15 of our 19 regions also saw properties staying online for longer compared to January 2022. The biggest increases in the average number of days on realestate.co.nz were in Gisborne (up 94.9%), Waikato (up 90.7%), Bay of Plenty (up 84.5%), Central North Island (up 83.0%), Wairarapa (up 76.9%), and Nelson & Bays (up 74.1%).
The average amount of days that listings were online also increased by 40.1% in Auckland and 63.1% in Wellington.
Vanessa says that vendors are either taking longer to find a buyer or are eventually deciding not to sell due to the market failing to meet their expectations.
“We hear from agents around the country that sellers have lowered their price expectations but that their expectations are often not as low as the market in their region.”
“Agents are having to work hard right now to find the middle ground between what vendors want and what buyers want to pay,” says Vanessa.
Bucking the trend were three regions that saw listings online, on average, for less time in January 2023 than in January 2022. Average days online were down by 53.4% in Hawke’s Bay, 47.3% in Manawatu/Whanganui, and 35.1% in Coromandel.
Sellers hesitant again. But for different reasons than in 2021.
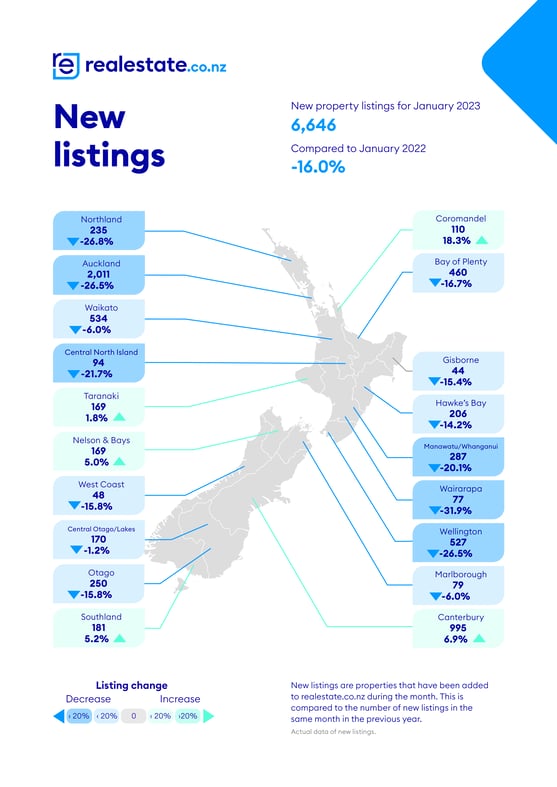
New listings were down in 14 of 19 regions last month, suggesting that sellers are holding off on listing their properties for sale right now. Regions that saw new listings down by more than 20% compared to January last year were Northland (down 26.8%), Auckland (down 26.5%), Wellington (down 26.5%), Wairarapa (down 31.9%), Central North Island (down 21.7%), and Manawatu/Whanganui (down 20.1%).
Vanessa says sellers are hesitant to put their homes up for sale because of uncertainty about the market, interest rates, and the coming election. However, she adds that seller hesitancy isn’t exclusive to our current cycle.
“In 2021, we were hearing from agents that property owners were nervous about listing because, in a highly competitive market, they worried they would wind up selling their home with nowhere to go.”
“Right now, agents are still having conversations in living rooms around New Zealand, but that same vendor hesitancy is back, albeit for different reasons,” says Vanessa.
For media enquiries, please contact:
Angela March | angela@brainchild.co.nz | Brainchild
About realestate.co.nz
As New Zealand’s longest-standing property website, realestate.co.nz’s mission is to empower New Zealanders with a property search tool they can use to find the life they want to live. With residential, lifestyle, rural and commercial property listings, realestate.co.nz is the place to start for those looking to buy or sell property.
Whatever life you’re searching for, it all starts here.
Glossary of terms:
Average asking price (AAP) is neither a valuation nor the sale price. It is an indication of current market sentiment. Statistically, asking prices tend to correlate closely with the sales prices recorded in future months when those properties are sold. As it looks at different data, average asking prices may differ from recorded sales data released simultaneously.
New listings are a record of all the new residential dwellings listed for sale on realestate.co.nz for the relevant calendar month. The site reflects 97% of all properties listed through licensed real estate agents and major developers in New Zealand. This description gives a representative view of the New Zealand property market.
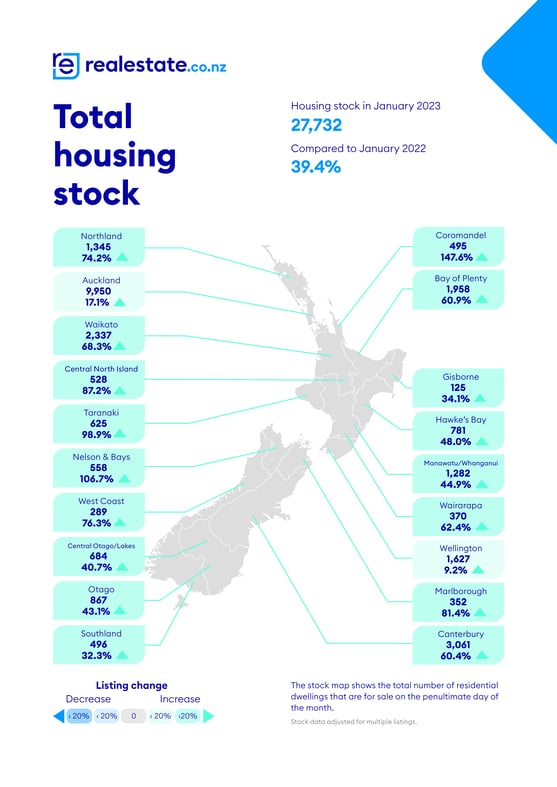
Stock is the total number of residential dwellings that are for sale on realestate.co.nz on the penultimate day of the month.
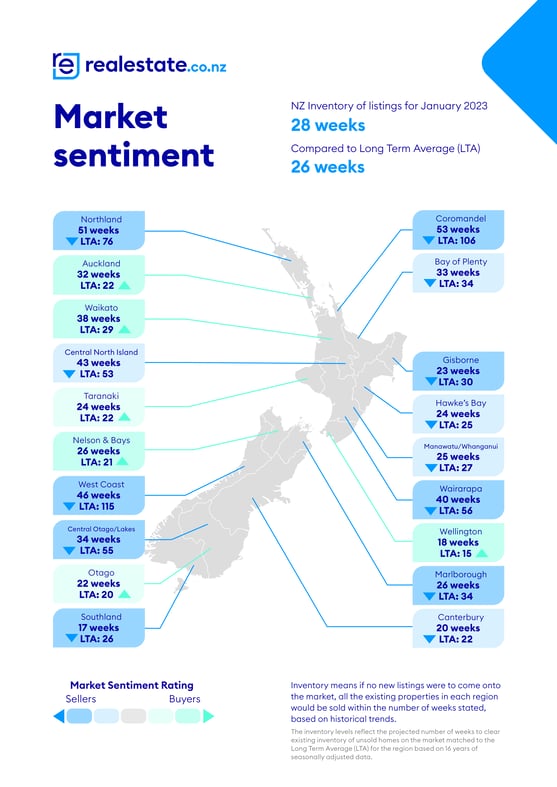
Inventory is a measure of how long it would take, theoretically, to sell the current stock at current average rates of sale if no new properties were to be listed for sale. It provides a measure of the rate of turnover in the market.
Seasonal adjustment is a method realestate.co.nz uses to represent better the core underlying trend of the property market in New Zealand. This is done using methodology from the New Zealand Institute of Economic Research.
Truncated mean is the method realestate.co.nz uses to supply statistically relevant asking prices. The top and bottom 10% of listings in each area are removed before the average is calculated to prevent exceptional listings from providing false impressions.
Share
-
.svg)
.svg)
.svg)