
.svg)


Statistics released today by realestate.co.nz for April 2016 show that strong demand means available inventory weeks of property for sale in Wellington is down a record 61% on the same time last year (April 2015).
A full copy of the report can be downloaded here.
“That’s an all-time low for any region and also the lowest level ever recorded for Wellington,” says Brendon Skipper, CEO of realestate.co.nz.
“It means that theoretically if no new listings were to come onto the market, all available property for sale in Wellington would sell out in only 5.6 weeks,” he says.
Inventory measures the amount of property on the market at any one time. In the first quarter of 2016 it has dropped significantly in Wellington.
“With the lower level of stock on the market and buyers still out there, it’s certainly a sellers’ market,” says Brendon.
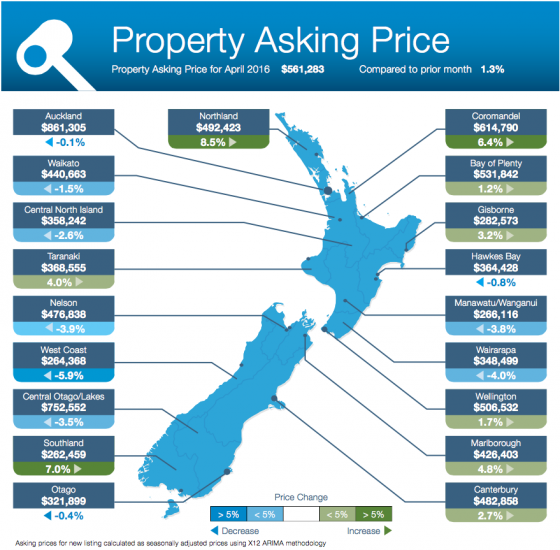
In terms of price, the April average asking price in Wellington has risen by two per cent from the previous month to $506,532, which is an all-time high for Wellington.
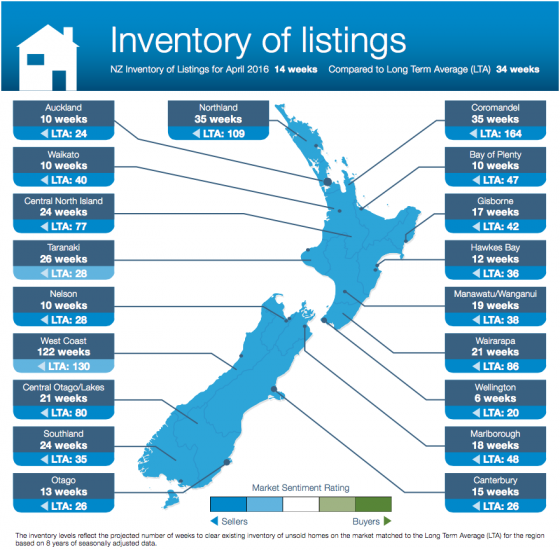
Across New Zealand, realestate.co.nz statistics show it’s a strong sellers’ market, with the inventory of listings for April showing of the 19 regions measured, all favour sellers by market sentiment (refer graph: NZ inventory of listings for April 2016, compared with long term average).
“While historic sales data is important, for buyers and sellers it’s equally important to know what’s happening right now in their own market, so they can make informed decisions,” says Brendon.
“As always, it’s the properties that are priced appropriately within the context of the market that will sell quickly,” he says.
In Auckland, weeks to sell fell by 2.78% in April 2016, compared with the same time last year.
Nationally, the inventory of listings is at the lowest level ever recorded by realestate.co.nz since January 2007 when statistics were collected via the site. The inventory of listings for all regions in April 2016 was 14 weeks compared to the Long Term Average of 34 weeks.
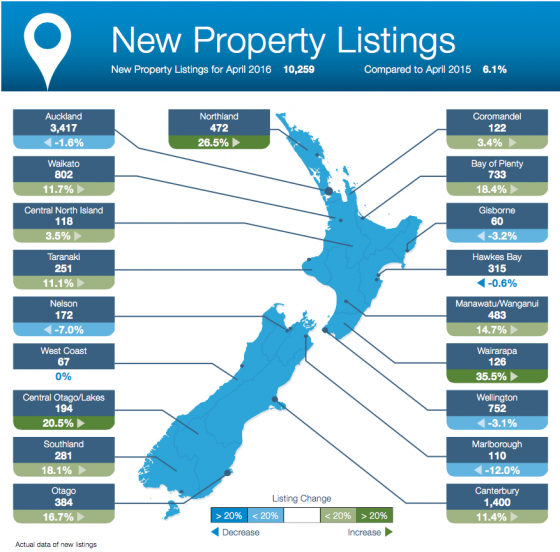
New property listings vary among major centres
While Auckland and Wellington recorded a decrease in the number of new listings during the month of April (compared to April 2015), sellers in Waikato, Canterbury and Otago are more active and the number of new listings in those regions are up by a double digit percentage increase compared with the same time last year.
Regions on the up
The majority of the regions are also in a sellers’ market phase. Star performers include Northland, Coromandel, Bay of Plenty and Southland.
Northland, Bay of Plenty and Southland recorded significant increases in new listings (compared with April 2015).
Northland, Coromandel and Southland recorded a healthy increase in average asking prices (more than a five per cent increase compared to the prior month of March 2016).
Nearly all the regional centres saw a downward trend in the Inventory of Listings for April 2016 compared to the Long Term Average.
Share
-
.svg)
.svg)
.svg)