Click here to download this report as a print-ready PDF.
Apartments on the rise in Auckland
- New apartment listings in Auckland almost double from previous month, giving buyers a more cost effective option when approaching the property ladder -
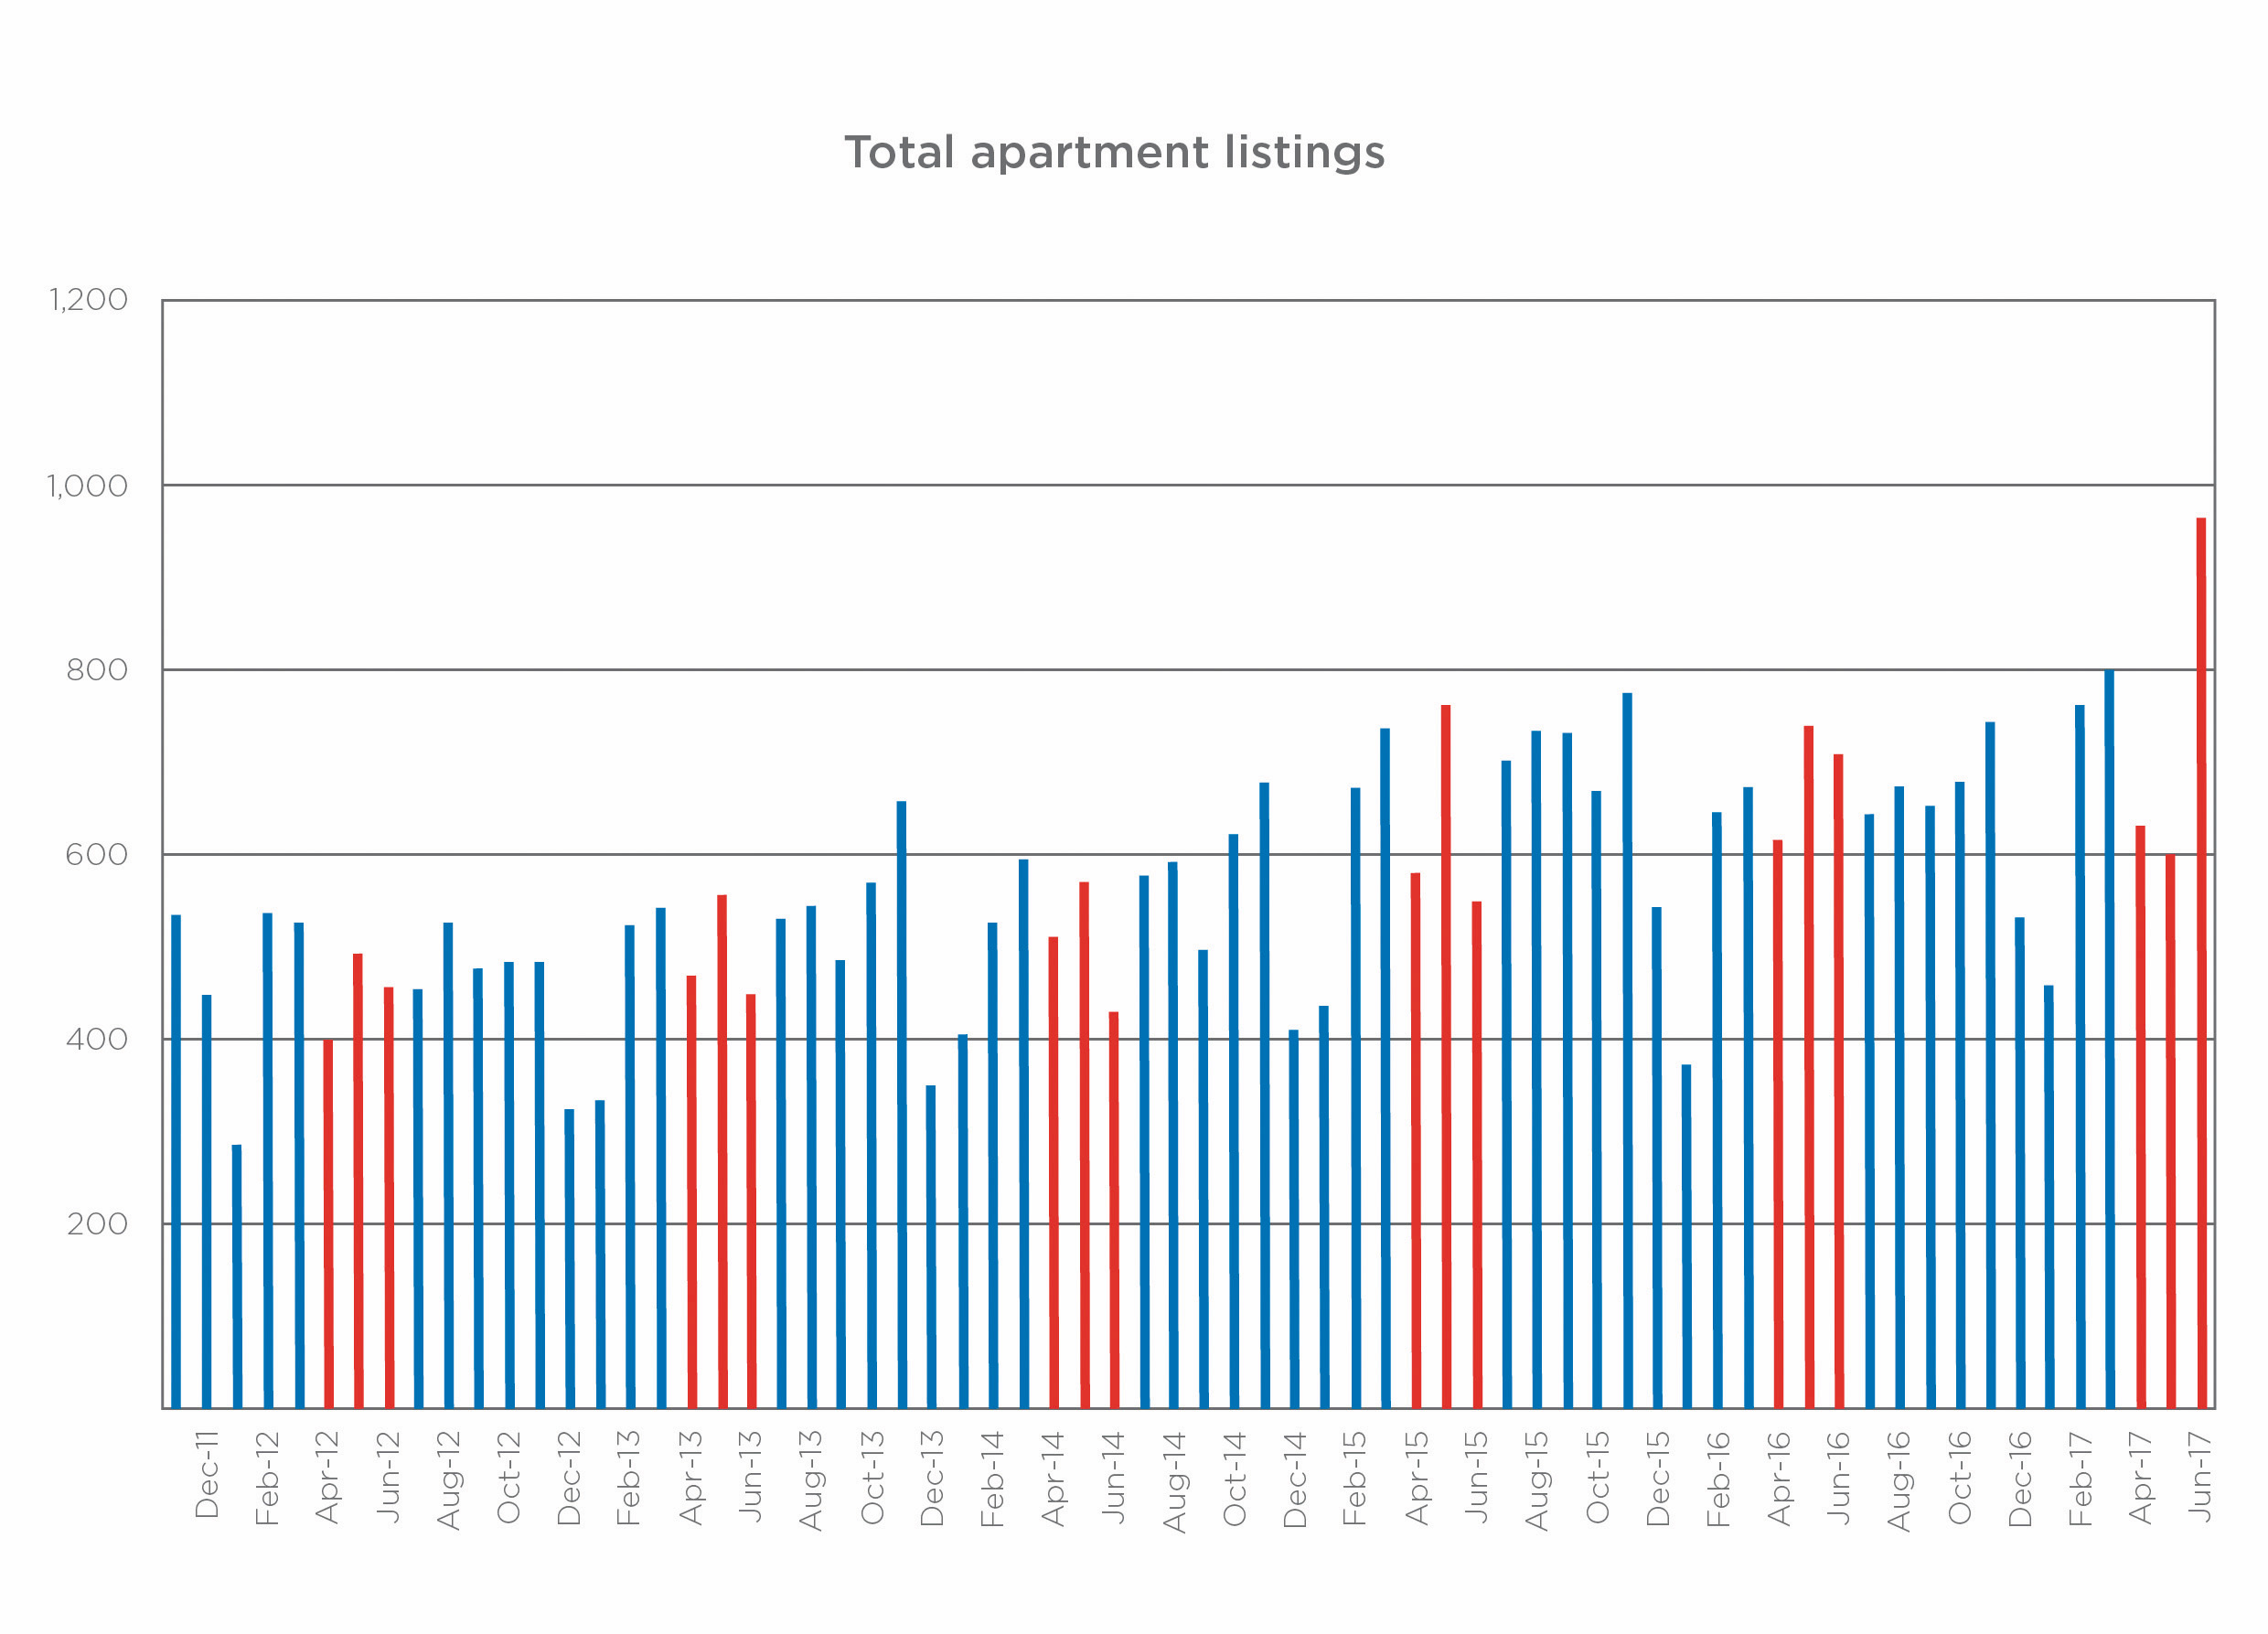
Auckland home buyers just got more choice, with the number of apartments listed for sale in June almost double the previous month (800 listings compared with 453 in May 2017).
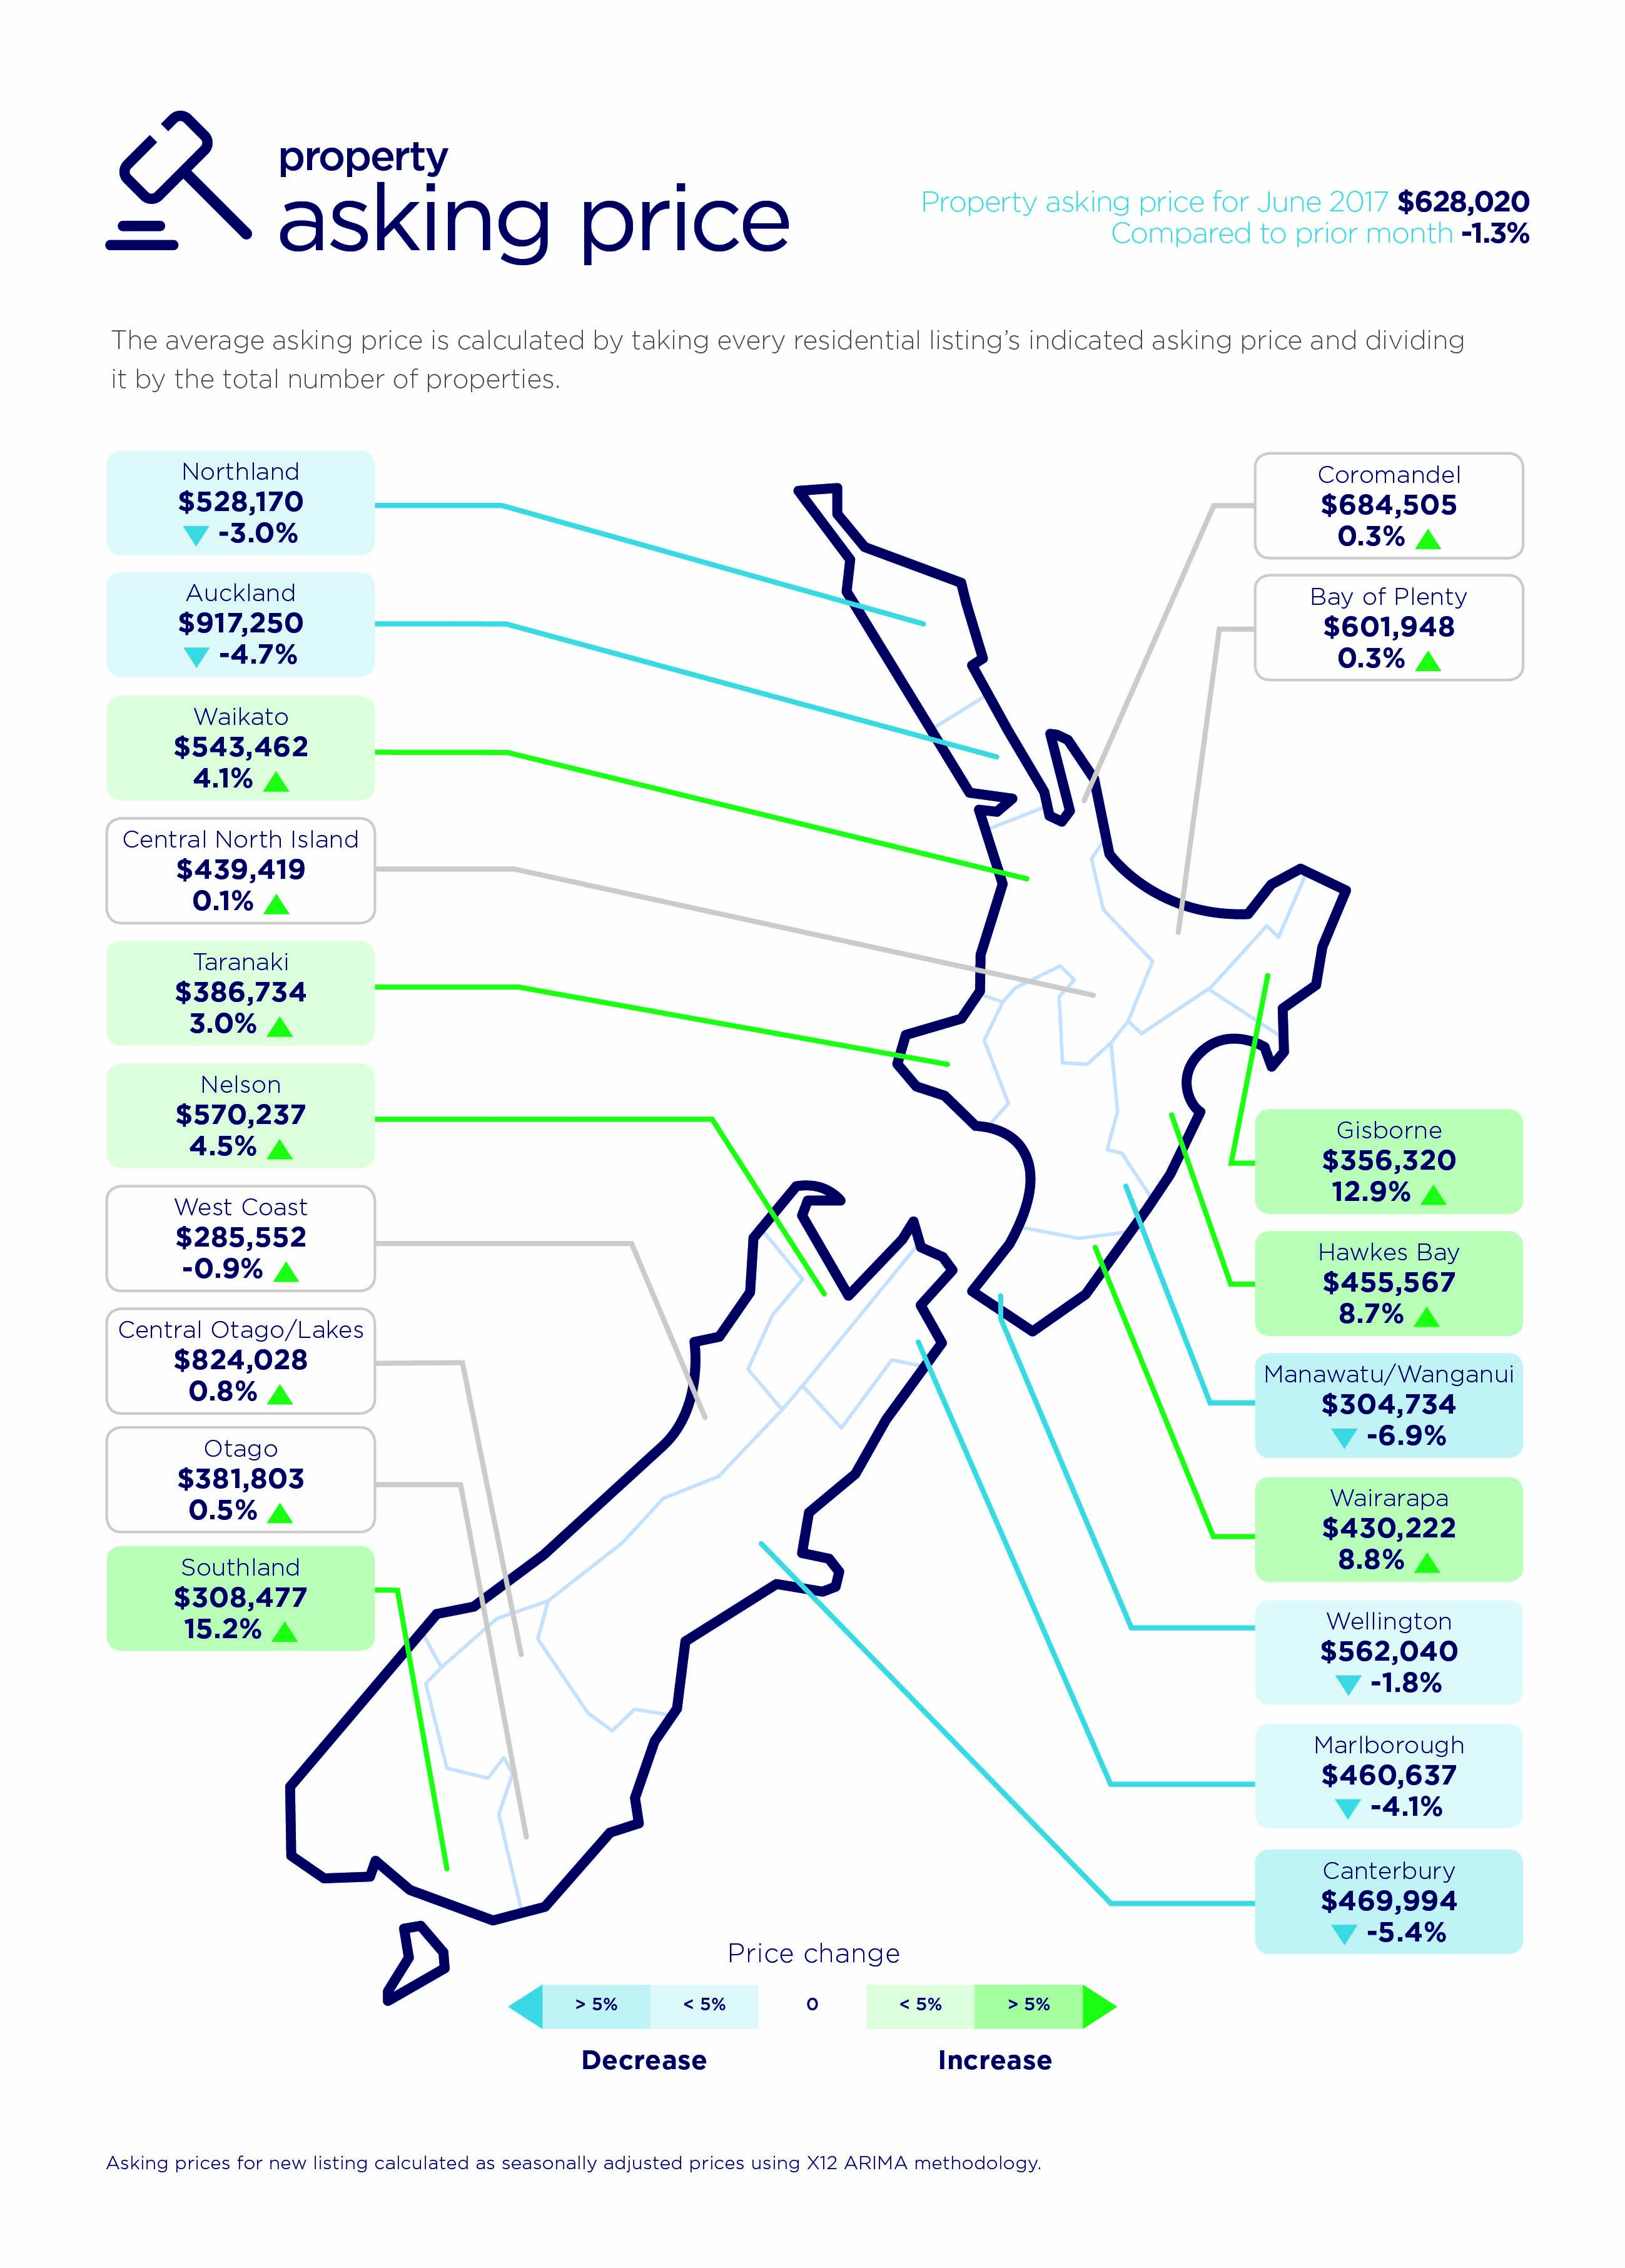
Real time statistics from realestate.co.nz show that the average asking price for an apartment in Auckland in June stood at $679,170. Compare that to the averaging asking price of all residential dwellings which was $917,250, which is 4.7 per cent lower than the previous month.
“We’ve been collecting property data for more than 10 years and never before have we seen so many apartments come onto the market in one month. With apartments typically being more affordable than houses, this has pulled down Auckland’s total average asking price for the month,” says realestate.co.nz spokesperson Vanessa Taylor.
“Kiwis have traditionally been brought up in a home and garden environment, but housing has evolved over the decades, particularly in Auckland with apartments, subdivisions, cross leases and terraced housing very much a part of the landscape,” she says.
“Ten years ago, apartments were largely confined to the Central Business District, but they are now an integrated part of developments in areas across the wider Auckland, North Shore, Waitakere and Manukau cities.
“It has shifted the mindset that buying an apartment meant buying into the Auckland CBD lifestyle, which may have only appealed to a certain demographic.
“Now, apartments are meeting a wider set of lifestyle stages and needs. There is significant choice, and buyers can take into consideration developments which meet their needs, for example schools, parks, shopping and local facilities,” says Vanessa.
“It provides buyers with a more cost-effective way to approach the property market.”
Nationally, one and two bedroom apartments made up the lion’s share of the apartment listings that came onto the market in June. Compared to June 2016, the number of one bedroom apartments increased by 45.8 per cent and two bedrooms by 28.2 per cent. However, the number of apartments for sale with three or more bedrooms decreased compared to the same time last year.
Year on year, the number of apartments for sale in Auckland rose 52.8 per cent (one bedroom) 45.5 per cent (two bedrooms) and 18.3 per cent (three bedrooms or more).
“The Auckland apartment market is catering to a wider variety of buyers, with one bedroom apartments best suited to students, two and three or more bedrooms appealing to families” Vanessa explains.
New property listings fall in four of the main centres
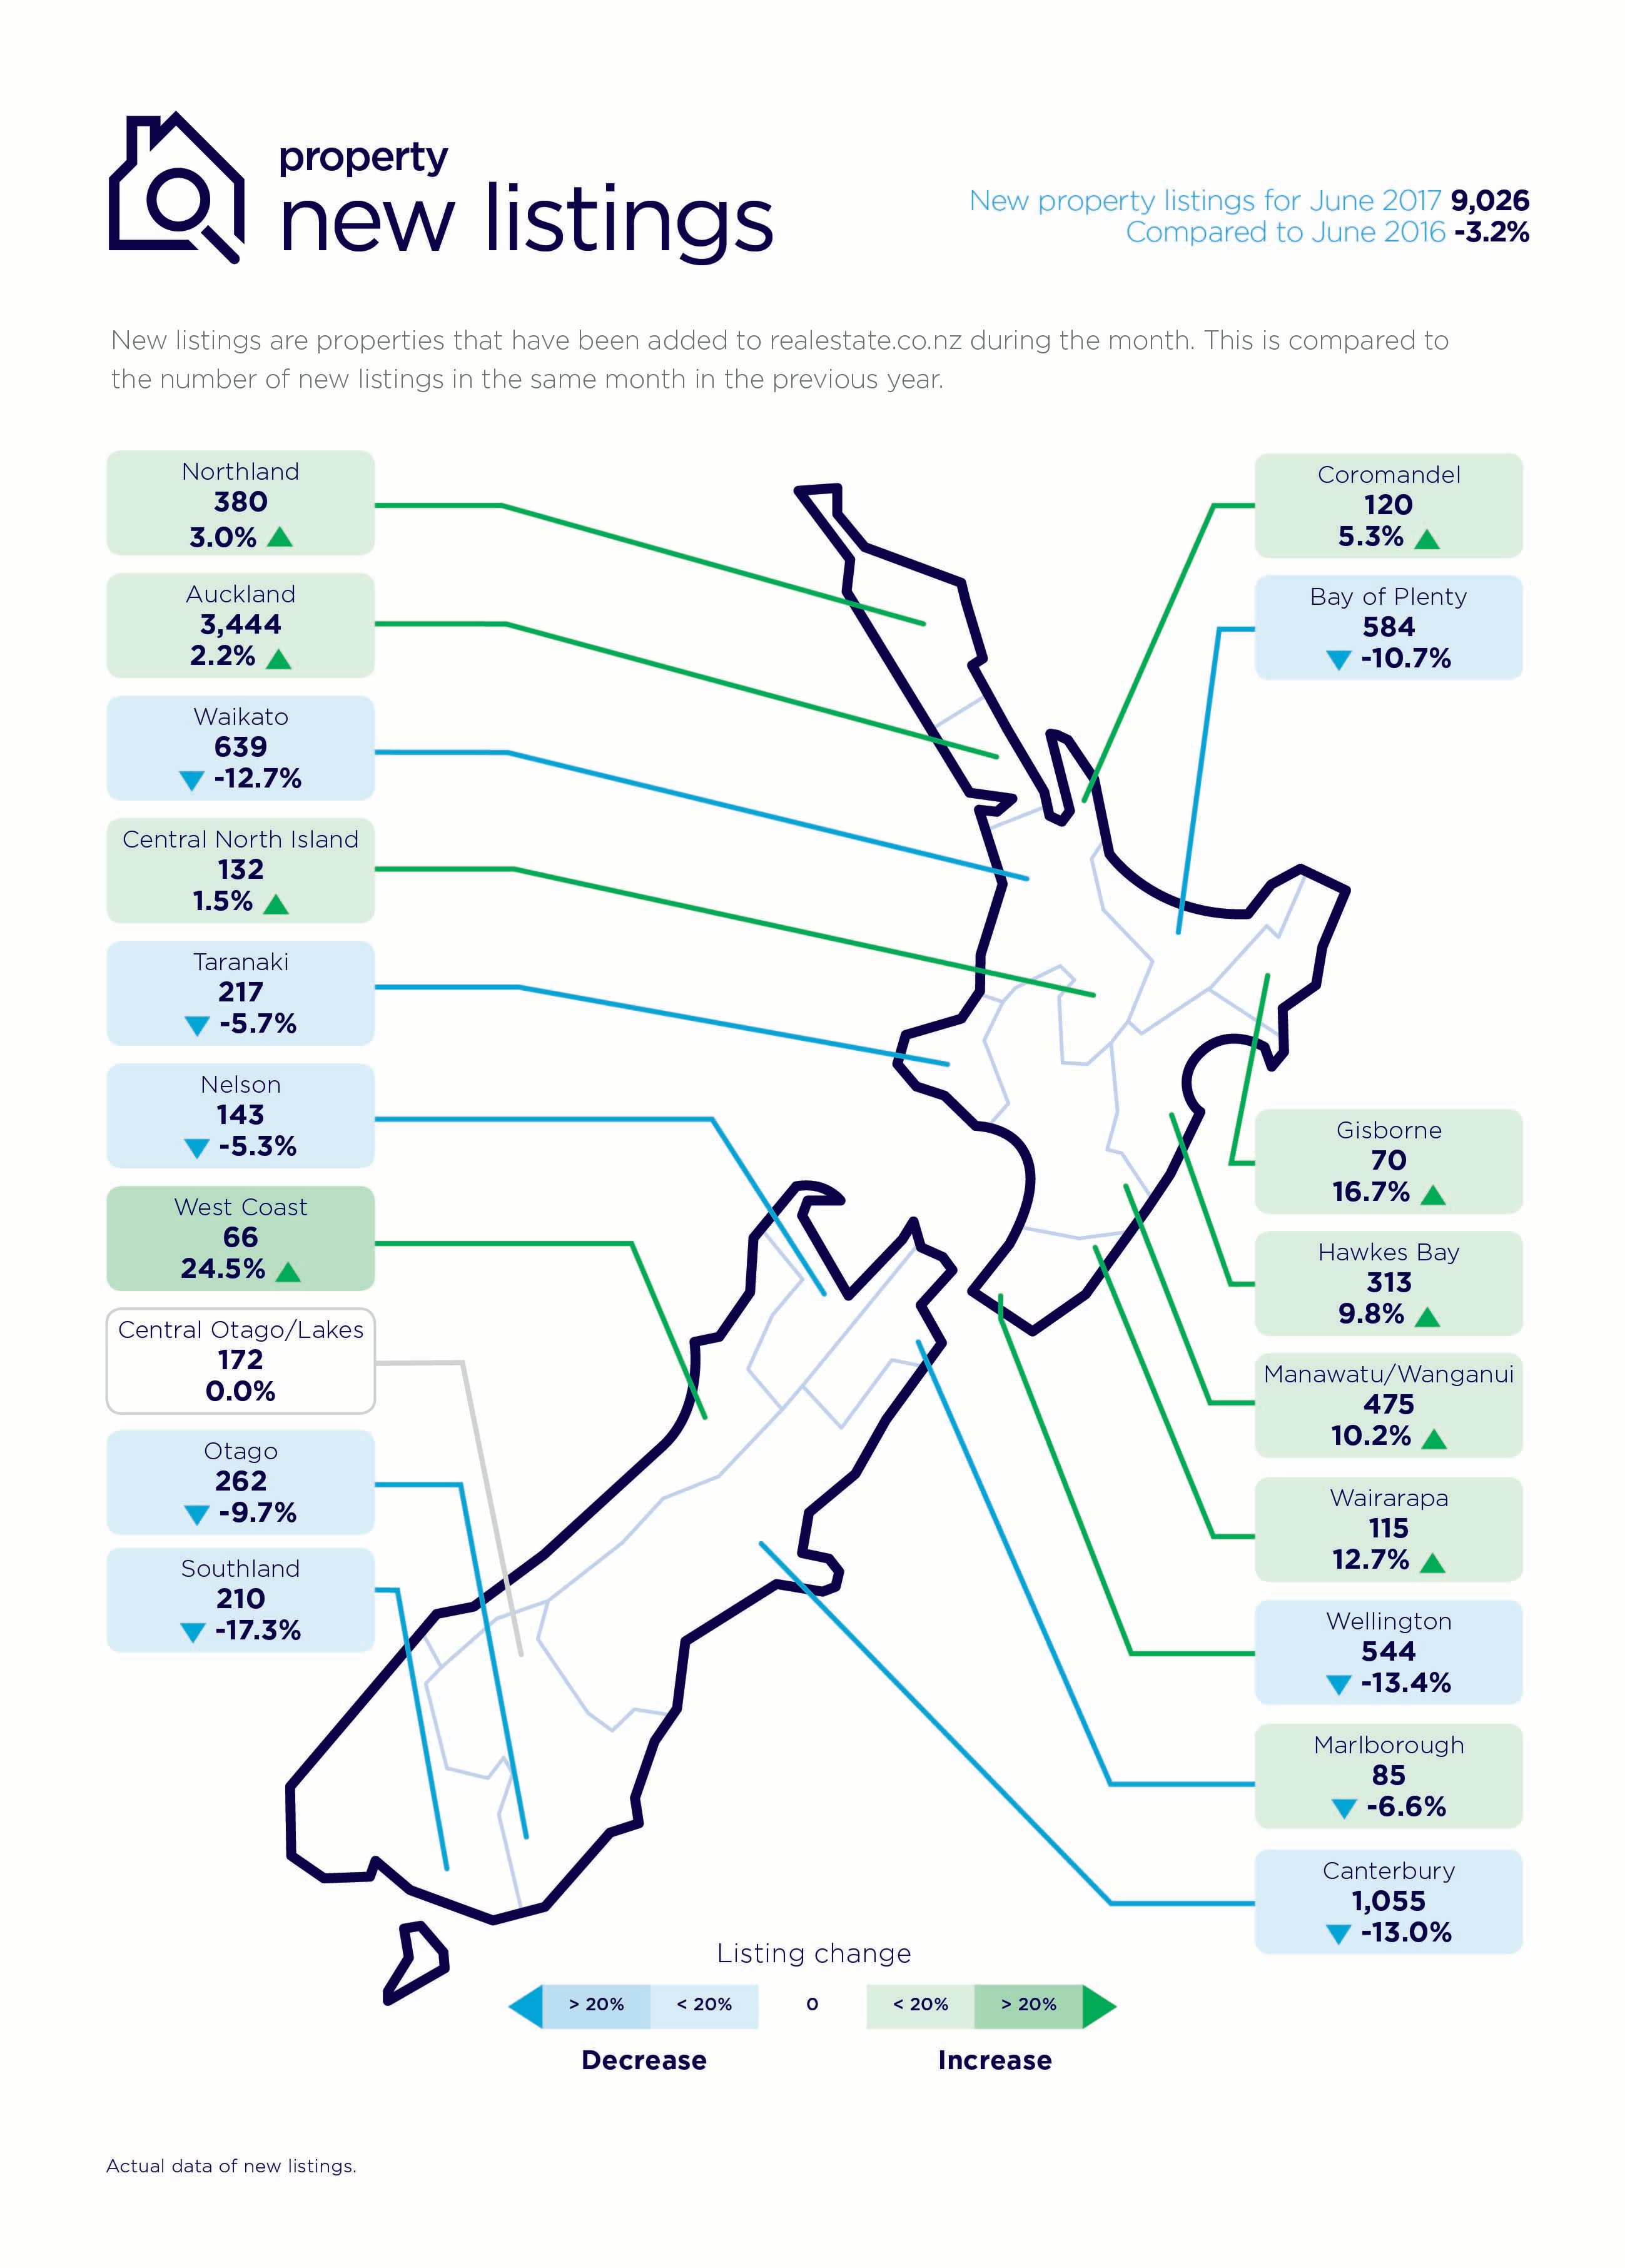
While the Auckland market had an overall lift in new listings in June (2.2 per cent) compared to the same time last year, this was underpinned by the 800 new apartments coming onto the market.
The other main centres did not fare so well. The biggest drop in new listings in June 2017 was in the Wellington region, down to 544 (-13.4 per cent). This was followed by Canterbury with 1,055 new listings (-13.0 per cent), Waikato with 639 (-12.7 per cent) and Bay of Plenty at 584 (-10.7 per cent).
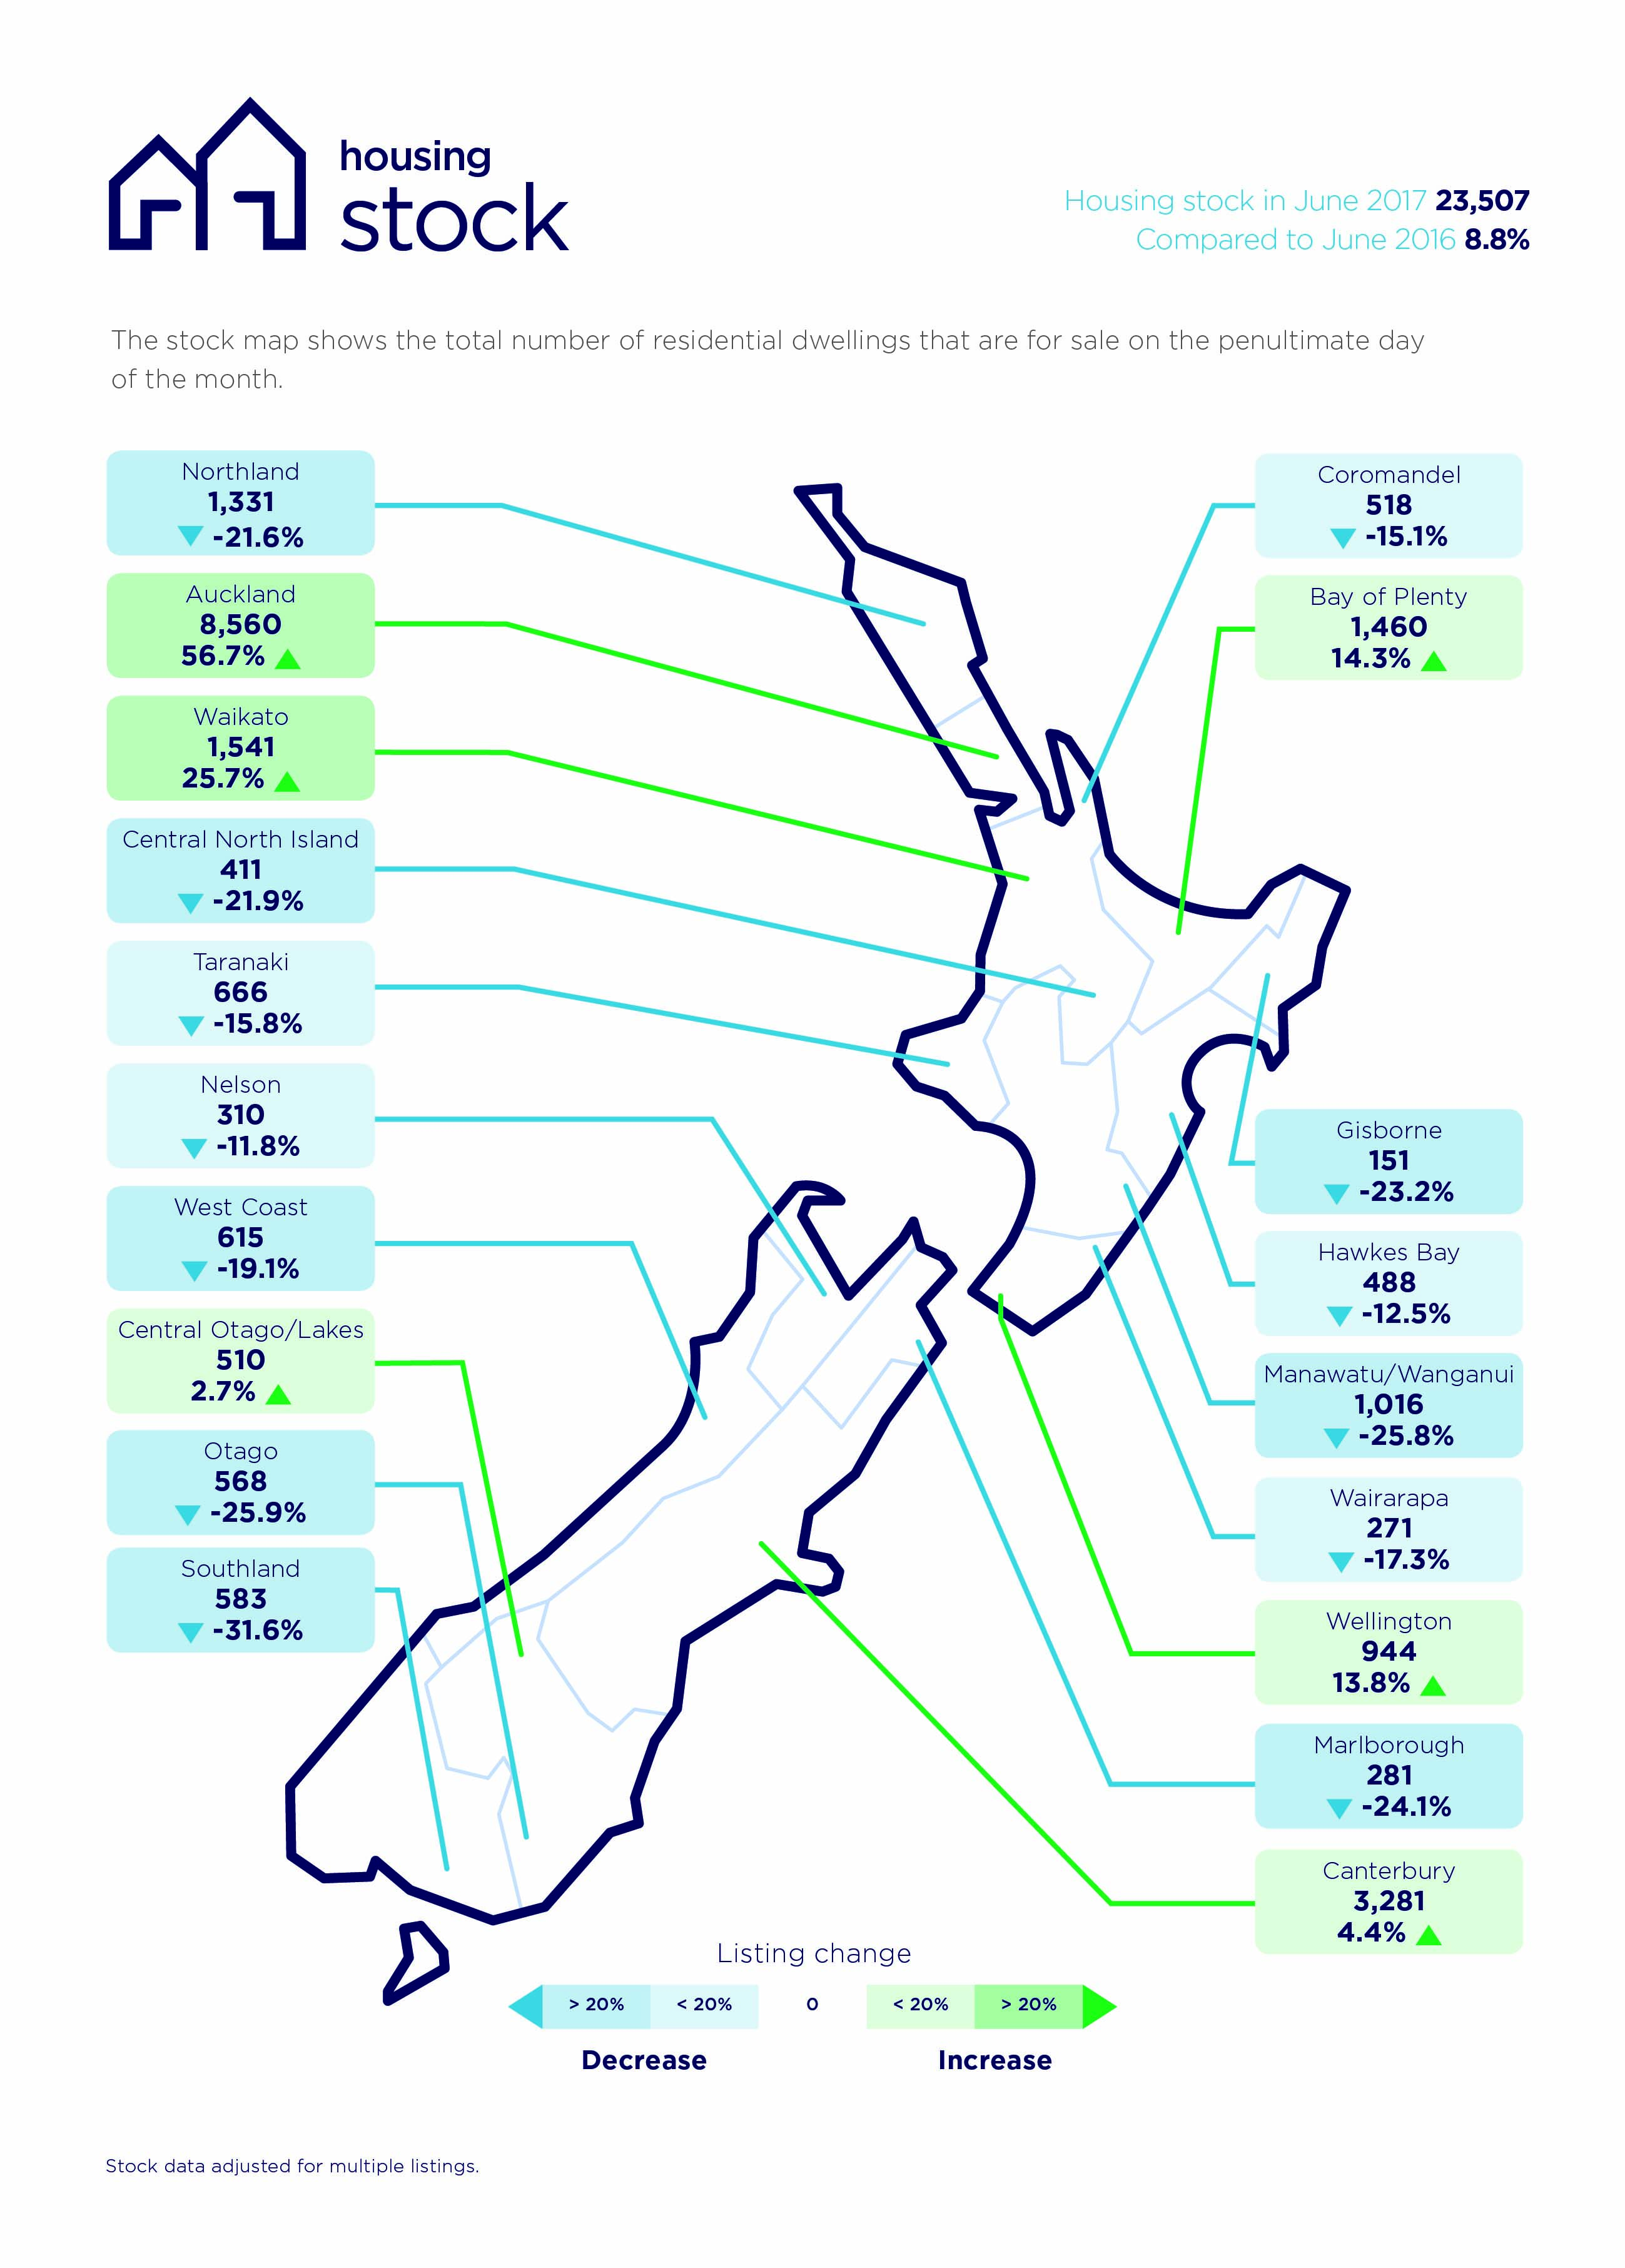
Wellington's inventory of listings lowest of main centres
Wellington Mayor Justin Lester was quoted in the media this week saying that the capital's population was likely to increase by up to 80,000 in the next 25 to 30 years and not enough housing was being built to meet that need.
The Mayor said that Wellington needed to be building more new homes – at least 1,000 per year.
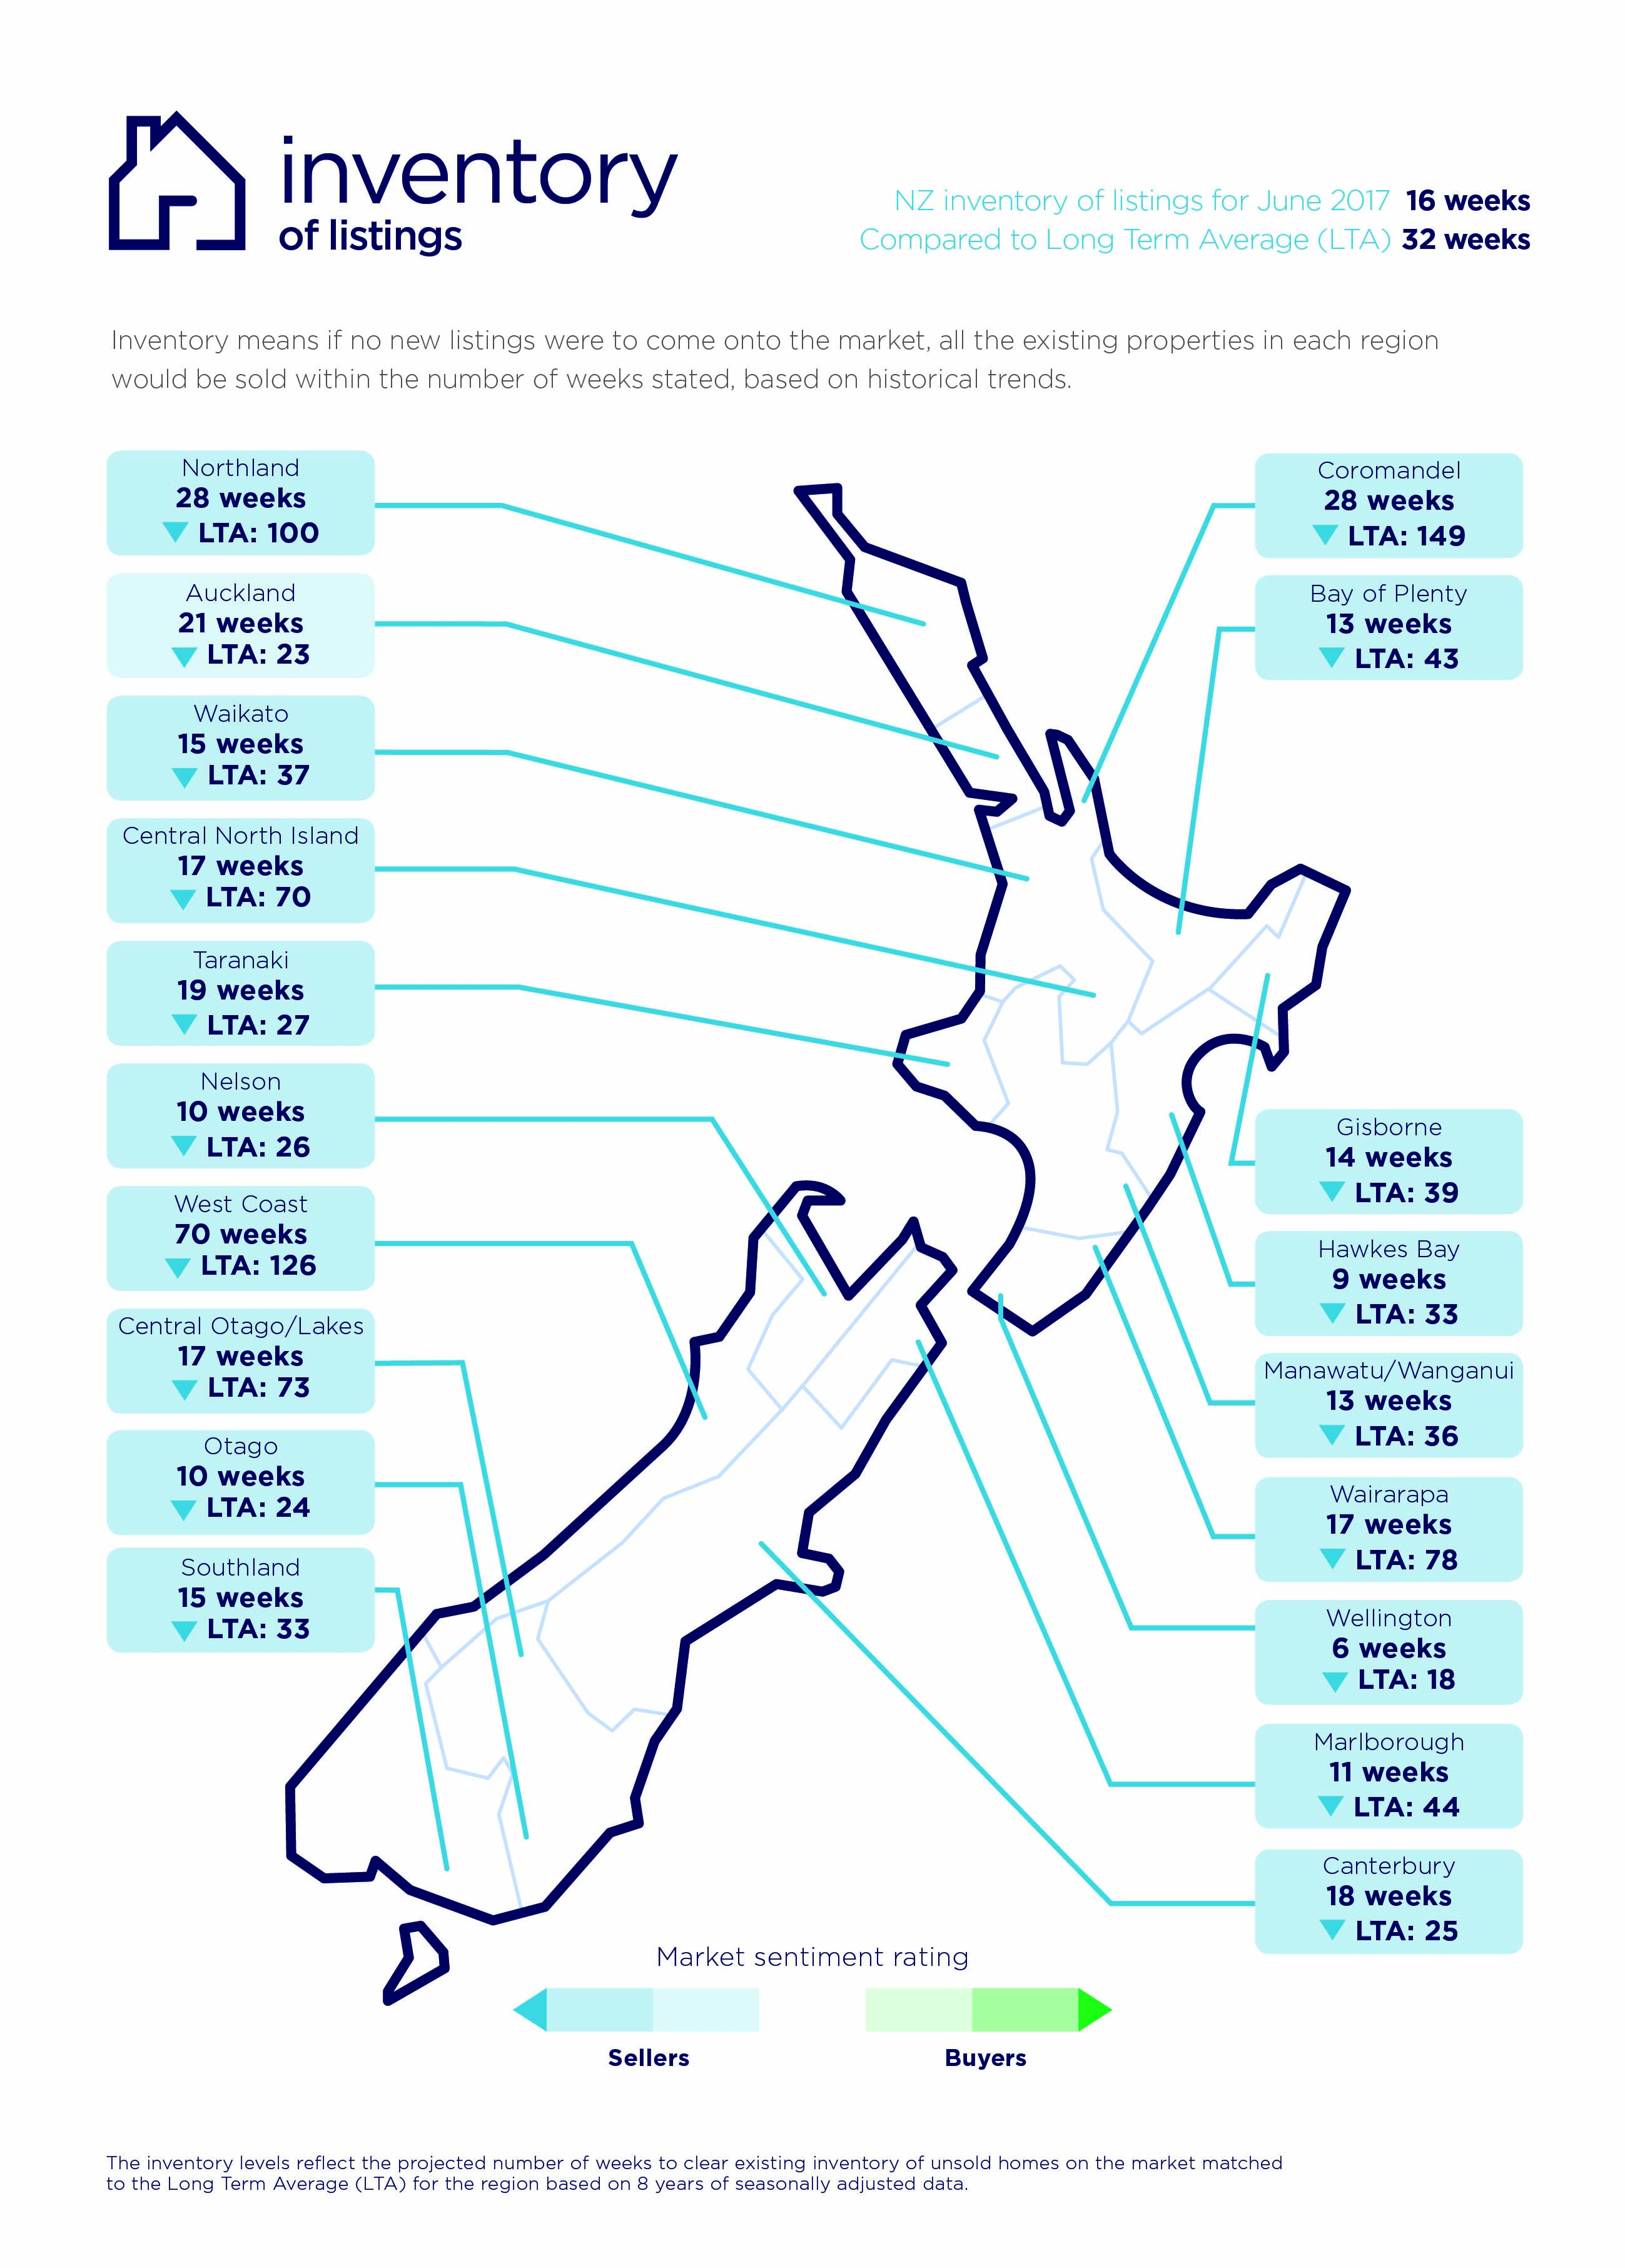
Vanessa Taylor says, “While June is traditionally a quiet month, Wellington's inventory of listings in June stood at six weeks, the lowest of all New Zealand's regions.”
“Inventory of listings means that theoretically if no new properties were to come onto the market from today, Wellington’s property stock would ‘sell out’ in six weeks,” she says.
“While it is currently a sellers' market across all New Zealand regions, in Wellington it's even more obvious,” says Vanessa.
Interestingly, the average asking price for property in Wellington for June (compared to the previous month) fell 1.8 per cent to an average of $562,040.
Glossary of terms
Being the only provider of real estate data in real time, realestate.co.nz offers valuable property market information not available from other sources.
Average asking price gives an indication of current market sentiment. Statistically, asking prices tend to correlate closely with the sales prices recorded in future months when those properties are sold. As it looks at different data, average asking prices may differ from recorded sales data released at the same time.
Inventory is a measure of how long it would take, theoretically, to sell the current stock at current average rates of sale if no new properties were to be listed for sale. It provides a measure of the rate of turnover in the market.
New listings are a record of all the new listings on realestate.co.nz for the relevant calendar month. As realestate.co.nz reflects 97 per cent of all properties listed through registered estate agents in New Zealand, this gives a representative view of the New Zealand property market.
Seasonal adjustment is a method realestate.co.nz uses to better represent the core underlying trend of the property market in New Zealand. This is done using methodology from the New Zealand Institute of Economic Research.
Truncated mean is the method realestate.co.nz uses to provide statistically relevant asking prices. The top and bottom 10 per cent of listings in each area are removed before the average is calculated, to prevent exceptional listings from providing false impressions.
Demand: the comparative view per listing change, by new listing in the previous 3 months compared to the same time last year
For media enquiries, please contact:
Kate Carter, PPR
T: +64 21 514 004 E: kate.carter@ppr.co.nz
01 Jul 2017

